Multi-Project Cloud Monitoring made easier

Customers need scale and flexibility from their cloud and this extends into supporting services such as monitoring and logging. Google Cloud’s Monitoring and Logging observability services are built on the same platforms used by all of Google that handle over 16 million metrics queries per second, 2.5 exabytes of logs per month, and over 14 quadrillion metric points on disk, as of 2020. However, you let us know through consistent feedback that the previous construct of Workspaces for Cloud Monitoring was not providing the flexibility needed for your larger scale projects.Cloud Operation’s New Approach to Multi-Project MonitoringWe’re happy to announce a new model for multi-project monitoring, which replaces the concept of Workspaces. This overhaul is geared toward maximizing the flexibility you have to manage your monitoring environments by introducing Metrics Scopes. Starting today you can associate your Google Cloud projects with multiple Metrics Scopes! Like Workspaces, Metrics Scopes will still be used to store all of the configuration content for dashboards, alerting policies, uptime checks, notification channels, and group definitions. However there is no limit to the number of Metrics Scopes to which you can associate a project. Prior to this change, a project could only be scoped with a single Workspace. Now, there are virtually unlimited possibilities for how you can set up multi-project monitoring. This unlocks a large variety of options, from more granular permissions to mission-focused configurations. At its most simple implementation though: operators/SREs can now create org-wide Metrics Scopes with monitoring configurations focused on infrastructure health. And developers can leverage Metrics Scopes built on a subset of their organization’s projects that allow them to focus on their application’s performance.How it worksWhen you have a collection of projects, Metrics Scopes enable you to view each project’s metrics in isolation as well as in combination with metrics stored by other projects. The Metrics Scope is hosted by a scoping project. This scoping project is the Cloud project that is selected in the Cloud Console project picker.ExampleIn this example, Project-SRE is the name of a scoping project to monitor your fleet. You added two developer teams’ projects: Project-Dev-1 and Project-Dev-2, to Project-SRE’s Metrics Scope. If you select Project-SRE with the Cloud Console project picker and then go to the Monitoring page, you view the metrics for all three projects: Metrics from all the projects are visible by using the scoping project Project-SRE, a project that was created specifically to monitor the fleet. It has a Metrics Scope of 3.If you select Project-Dev-1 with the Cloud Console project picker and then go to the Monitoring page, you view the Metrics Scope for Project-Dev-1 and you can only see the metrics for that project:Only metrics from the Developer’s project are visible by using the scoping project Project-Dev-1. It has a Metrics Scope of 1.What else is new?Metrics Scopes can now monitor up to 375 projects (up from 100).New projects automatically start working in Cloud Monitoring without the previous 60-second Workspace creation process.If you want to monitor more than one project simply add it to your Metrics Scope:Adding more than one project to a Metrics ScopeNavigationMentioned earlier, the Project Picker in the Cloud Console can be used to navigate between Metrics Scopes in Cloud Monitoring:A view of the Project Picker in the Cloud Console which can be used to navigate between Metrics ScopesThis is now consistent with many other services across Google Cloud. Specifically, you can see how the project picker stays consistent when navigating from Cloud Monitoring to Cloud Logging:The Project Picker stays consistent as you are navigating multiple servicesAdditionally, to make your navigation between Metrics Scopes easy we’ve added the new Metrics Scope Tab and Panel in the UI:Metrics Scopes panel in the Cloud Console UIComing SoonThe Metrics Scope API is coming within the next quarter! This API will enable you to programmatically manage your monitoring configurations and Metrics Scopes.Current Workspaces usersIf you are already using Workspaces in Cloud Monitoring you may have noticed that they converted to Metrics Scopes weeks ago. There is no additional action required and you can start taking advantage of the additional features of Metrics Scopes today.Get StartedCompanies that are digitally native or in the process of digital transformation have placed an increased operational role on developers and this often creates overlapping sets of responsibilities with Operations and SRE teams. Now multiple developer teams can focus on optimizing the performance of their applications while operators can take a fleet-wide view when maintaining and improving the performance of all of the infrastructure under their purview.For information on configuring a Metrics Scope to include metrics for multiple projects, see Viewing metrics for multiple projects.Related ArticleRead Article
Quelle: Google Cloud Platform
Build a platform with KRM: Part 1 – What’s in a platform?

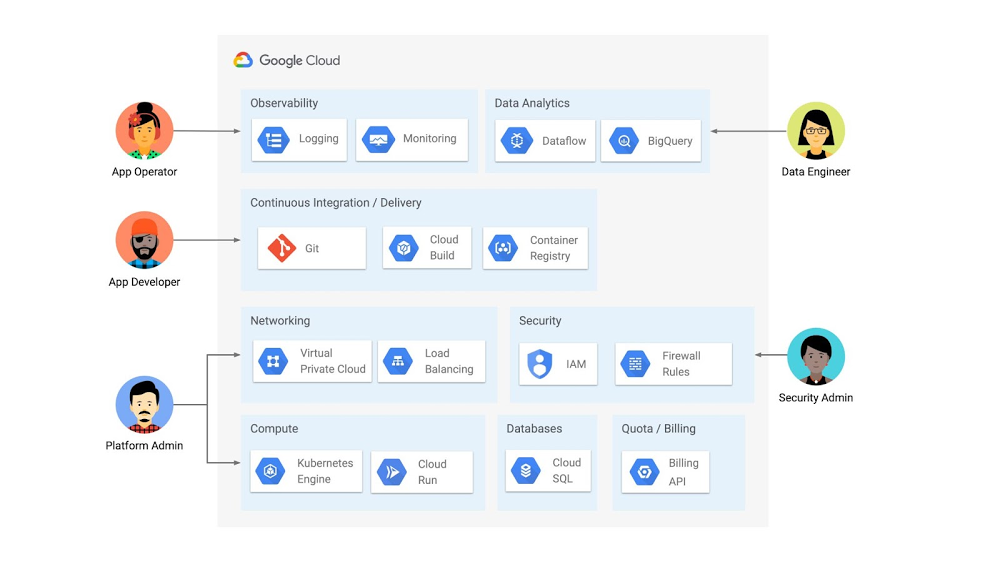
This is the first post in a multi-part series on building developer platforms with the Kubernetes Resource Model (KRM). In today’s digital world, it’s more important than ever for organizations to quickly develop and land features, scale up, recover fast during outages, and do all this in a secure, compliant way. If you’re a developer, system admin, or security admin, you know that it takes a lot to make all that happen, including a culture of collaboration and trust between engineering and ops teams. But building culture isn’t just about communication and shared values— it’s also about tools. When application developers have the tools and agency to code, with enough abstraction to focus on building features, they can build fast without getting bogged down in infrastructure. When security admins have streamlined processes for creating and auditing policies, engineering teams can keep building without waiting for security reviews. And when service operators have powerful, cross-environment automation at their disposal, they can support a growing business with new engineering teams – without having to add more IT staff. Said another way: to deliver high-quality code fast and safely, you need a good developer platform.What is a platform? It’s the layers of technology that make software delivery possible, from Git repositories and test servers, to firewall rules and CI/CD pipelines, to specialized tools for analytics and monitoring, to the production infrastructure that runs the software itself.  An organization’s platform needs depend on a variety of factors, such as industry vertical, size, and security requirements. Some organizations can get by with a fully-managed Platform as a Service (PaaS) like Google App Engine, and others prefer to build their platform in-house. At Google Cloud, we serve lots of customers who fall somewhere in the middle: they want more customization (and less lock-in) than what’s provided by an all-in-one PaaS, but they have neither the time nor resources to build their own platform from scratch. These customers may come to Google Cloud with established tech preferences and goals. For example, they may want to adopt Serverless but not Service Mesh, or vice versa. An organization in this category might turn to a provider like Google Cloud to use a combination of hosted infrastructure and services, as shown in the diagram below.(Click to enlarge)But a platform isn’t just a combination of products. It’s the APIs, UIs, and command-line tools you use to interact with those products, the integrations and glue between them, and the configuration that allows you to create environments in a repeatable way. If you’ve ever tried to interact with lots of resources at once, or manage them on behalf of engineering teams, you know that there’s a lot to keep track of. So what else goes into a platform? For starters, a platform should be human-friendly, with abstractions depending on the user. In the diagram above, for example, the app developer focuses on writing and committing source code. Any lower-level infrastructure access can be limited to what they care about: for instance, spinning up a development environment. A platform should also be scalable: additional resources should be able to be “stamped out” in an automated, repeatable way. A platform should be extensible, allowing an org to add new products to that diagram as their business and technology needs evolve. Finally, a platform needs to be secure, compliant to industry- and location-specific regulations. So how do you get from a collection of infrastructure to a well-abstracted, scalable, extensible, secure, platform? You’ll see that one product icon in that diagram is Google Kubernetes Engine (GKE), a container orchestration tool based on the open-source Kubernetes project. While Kubernetes is first and foremost a “compute” tool, that’s not all it can do. Kubernetes is unique because of its declarative design, allowing developers to declare their intent and let the Kubernetes control plane take action to “make it so.” The Kubernetes Resource Model (KRM) is the declarative format you use to talk to the Kubernetes API. Often, KRM is expressed as YAML, like the file shown below.If you’ve ever run “kubectl apply” on a Deployment resource like the one above, you know that Kubernetes takes care of deploying the containers inside Pods, scheduling them onto Nodes in your cluster. And you know that if you try to manually delete the Pods, the Kubernetes control plane will bring them back up- it still knows about your intent, that you want three copies of your “helloworld” container. The job of Kubernetes is to reconcile your intent with the running state of its resources- not just once, but continuously.  So how does this relate to platforms, and to the other products in that diagram? Because deploying and scaling containers is only the beginning of what the Kubernetes control plane can do. While Kubernetes has a core set of APIs, it is also extensible, allowing developers and providers to build Kubernetes controllers for their own resources, even resources that live outside of the cluster. In fact, nearly every Google Cloud product in the diagram above— from Cloud SQL, to IAM, to Firewall Rules — can be managed with Kubernetes-style YAML. This allows organizations to simplify the management of those different platform pieces, using one configuration language, and one reconciliation engine. And because KRM is based on OpenAPI, developers can abstract KRM for developers, and build tools and UIs on top.Further, because KRM is typically expressed in a YAML file, users can store their KRM in Git and sync it down to multiple clusters at once, allowing for easy scaling, as well as repeatability, reliability, and increased control. With KRM tools, you can make sure that your security policies are always present on your clusters, even if they get manually deleted. In short, Kubernetes is not just the “compute” block in a platform diagram – it can also be the powerful declarative control plane that manages large swaths of your platform. Ultimately, KRM can get you several big steps closer to a developer platform that helps you deliver software fast, and securely. The rest of this series will use concrete examples, with accompanying demos, to show you how to build a platform with the Kubernetes Resource Model. Head over to the GitHub repository to follow Part 1 – Setup, which will spin up a sample GKE environment in your Google Cloud project. And stay tuned for Part 2, where we’ll dive into how the Kubernetes Resource Model works.Related ArticleI do declare! Infrastructure automation with Configuration as DataConfiguration as Data enables operational consistency, security, and velocity on Google Cloud with products like Config Connector.Read Article
Quelle: Google Cloud Platform

Dritte Availability Zone in der AWS-Region China (Peking)

Heute wurde der AWS-Region China (Peking)* eine dritte Availability Zone (AZ) hinzugefügt, um die hohe Nachfrage unserer wachsenden Kundenbasis zu unterstützen. Eine Availability Zone (AZ) ist ein oder mehrere diskrete Rechenzentren mit redundanter Stromversorgung, Vernetzung und Konnektivität in einer AWS-Region. Mithilfe dieser Availability Zones (AZs) können Sie Produktionsanwendungen und Datenbanken betreiben, die verfügbarer, fehlertoleranter und skalierbarer sind, als dies von einem einzigen Rechenzentrum aus möglich wäre.
Quelle: aws.amazon.com

Introducing On-Demand OpenStack Private Clouds and Initial Use Cases

InMotion Hosting has recently brought to market an automated deployment of OpenStack and Ceph that we sell as on-demand Private Cloud and as part of our Infrastructure as a Service.  We believe that making OpenStack more accessible is critical to the health of the OpenStack community as it will allow smaller teams a low-risk and… Read more »
Quelle: openstack.org






