Resolve Vulnerabilities Sooner With Contextual Data

OpenSSL 3.0.7 and “Text4Shell” might be the most recent critical vulnerabilities to plague your development team, but they won’t be the last. In 2021, critical vulnerabilities reached a record high. Attackers are even reusing their work, with over 50% of zero-day attacks this year being variants of previously-patched vulnerabilities. 

With each new security vulnerability, we’re forced to re-examine our current systems and processes. If you’re impacted by OpenSSL or Text4Shell (aka CVE-2022-42889), you’ve probably asked yourself, “Are we using Apache Commons Text (and where)?” or “Is it a vulnerable version?” — and similar questions. And if you’re packaging applications into container images and running those on cloud infrastructure, then a breakdown by image, deployment environment, and impacted Commons-Text version would be extremely useful. 

Developers need contextual data to help cut through the noise and answer these questions, but gathering information takes time and significantly impacts productivity. An entire day is derailed if developers must context switch and spend countless hours researching, triaging, and fixing these issues. So, how do we stop these disruptions and surface crucial data in a more accessible way for developers?

Start with continuously examining images

Bugs, misconfigurations, and vulnerabilities don’t stop once an image is pushed to production, and neither should development. Improving images is a continuous effort that requires a constant flow of information before, during, and after development.

Before images are used, teams spend a significant amount of time vetting and selecting them. That same amount of effort needs to be put into continuously inspecting those same images. Otherwise, you’ll find yourself in a reactive cycle of unnecessary rework, wasted time, and overall developer frustration.

That’s where contextual data comes in. Contextual data ties directly to the situation around it to give developers a broader understanding. As an example, contextual data for vulnerabilities gives you clear and precise insights to understand what the vulnerability is, how urgent it is, and its specific impact on the developer and the application architecture — whether local, staging, or production.

Contextual data reduces noise and helps the developer know the what and the where so they can prioritize making the correct changes in the most efficient way. What does contextual data look like? It can be…

A comparison of detected vulnerabilities between images built from a PR branch with the image version currently running in productionA comparison between images that use the same custom base imageAn alert sent into a Slack channel that’s connected to a GitHub repository when a new critical or high CVE is detected in an image currently running in productionAn alert or pull request to update to a newer version of your base image to remediate a certain CVE

Contextual data makes it faster for developers to locate and remediate the vulnerabilities in their application.

Use Docker to surface contextual data

Contextual data is about providing more information that’s relevant to developers in their daily tasks. How does it work?

Docker can index and analyze public and private images within your registries to provide insights about the quality of your images. For example, you can get open source package updates, receive alerts about new vulnerabilities as security researchers discover them, send updates to refresh outdated base images, and be informed about accidentally embedded secrets like access tokens. 

The screenshot below shows what appears to be a very common list of vulnerabilities on a select Docker image. But there’s a lot more data on this page that correlates to the image:

The page breaks the vulnerabilities up by layers and base images making it easy to assess where to apply a fix for a detected vulnerability.Image refs in the right column highlight that this version of the image is currently running in production.We also see that this image represents the current head commit in the corresponding Git repository and we can see which Dockerfile it was built from.The current and potential other base images are listed for comparison.

An image report with a list of common CVEs — including Text4Shell

Using Slack, notifications are sent to the channels your team already uses. Below shows an alert sent into a Slack channel that’s configured to show activity for a selected set of Git repositories. Besides activity like commits, CI builds, and deployments, you can see the Text4Shell alert providing very concise and actionable information to developers collaborating in this channel:

Slack update on the critical Text4Shell vulnerability

You can also get suggestions to remediate certain categories of vulnerabilities and raise pull requests to update vulnerable packages like those in the following screenshot:

Remediating the Text4Shell CVE via a PR and comparing to main branch

Find out more about this type of information for public images like Docker Official Images or Docker Verified Publisher images using our Image Vulnerability Database.

Vulnerability remediation is just the beginning

Contextual data is essential for faster resolution of vulnerabilities, but it’s more than that. With the right data at the right time, developers are able to work faster and spend their time innovating instead of drowning in security tickets.

Imagine you could assess your production images today to find out where you’re potentially going to be vulnerable. Your teams could have days or weeks to prepare to remediate the next critical vulnerability, like the OpenSSL forthcoming notification on a new critical CVE next Tuesday, November 1st 2022.

Searching for Debian OpenSSL on dso.docker.com

Interested in getting these types of insights and learning more about providing contextual data for happier, more productive devs? Sign up for our Early Access Program to harness these tools and provide invaluable feedback to help us improve our product!
Quelle: https://blog.docker.com/feed/

October Extensions Roundup: CI on Your Laptop and Hacktoberfest!

This month, we’ve got some new extensions so good, they’re scary! Docker Extensions build new functionality into Docker Desktop, extend its existing capabilities, and allow you to discover and integrate additional tools that you’re already using with Docker. Let’s take a look at some of the recent ones. And if you’d like to see everything available, check out our full Extensions Marketplace!

Drone CI

Do you need to build and test a container friendly pipeline before sharing with your team? Or do you need the ability to perform continuous integration (CI) or debug failing tests on your laptop? If the answer is yes, the Drone CI extension can help you! With the extension, you can:

Import Drone CI pipelines and run them locallyRun specific steps of a pipelineMonitor execution resultsInspect logs

See it in action in the gif below!

Open Source Docker Extensions

This month, Docker celebrated Hacktoberfest, a month-long celebration of open-source projects, their maintainers, and the entire community of contributors. During this event, Docker worked with the community to contribute to our open source Docker Extensions — and encourage developers to create their own open source extensions.

In fact, here’s a list of open source extensions available in our Marketplace:

DDosify – High performance, open-source, and simple load testing tool written in Golang.Drone CI – Run Continuous Integration & Delivery Pipeline (CI/CD) from within Docker Desktop.GOSH – Build your decentralized and secure software supply chain with Docker and Git Open Source Hodler.JFrog – Scan your Docker images for vulnerabilities with JFrog Xray.Lacework Scanner – Enable developers with the insights to securely build their containers and minimize the vulnerabilities before the images go into production.Meshery – Design and operate your cloud native deployments with the Meshery extensible management plane.Mini Cluster – Run a local Apache Mesos cluster.Okteto – Remote development for Docker Compose.Open Source management tool for PostgreSQL – Use an embedded PGAdmin4 Open Source management tool for PostgreSQL.Oracle SQLcl client tool – Use an embedded version of Oracle SQLcl client tool.RedHat OpenShift – Easily deploy and test applications on to OpenShift.Volumes Backup & Share – Backup, clone, restore and share Docker volumes effortlessly.

Hacktoberfest generated a lot of great extensions from our community that aren’t yet available in the Marketplace. To check out these extensions, visit our Hacktoberfest Github Repo. All of these extensions can be installed via the CLI, and you can visit our docs to learn how. 

Check out the latest Docker Extensions with Docker Desktop

Docker is always looking for ways to improve the developer experience. We hope that these new extensions will make your life easier and that you’ll give them a try! Check out these resources for more info on extensions:

Try October’s newest extensions by installing Docker Desktop for Mac, Windows, or Linux.Visit our Extensions Marketplace to see all of our extensions.Build your own extension with our Extensions SDK.
Quelle: https://blog.docker.com/feed/

Introducing the Docker+Wasm Technical Preview

The Technical Preview of Docker+Wasm is now available! Wasm has been producing a lot of buzz recently, and this feature will make it easier for you to quickly build applications targeting Wasm runtimes.

As part of this release, we’re also happy to announce that Docker will be joining the Bytecode Alliance as a voting member. The Bytecode Alliance is a nonprofit organization dedicated to creating secure new software foundations, building on standards such as WebAssembly and WebAssembly System Interface (WASI).

What is Wasm?

WebAssembly, often shortened to Wasm, is a relatively new technology that allows you to compile application code written in over 40+ languages (including Rust, C, C++, JavaScript, and Golang) and run it inside sandboxed environments.

The original use cases were focused on running native code in web browsers, such as Figma, AutoCAD, and Photoshop. In fact, fastq.bio saw a 20x speed improvement when converting their web-based DNA sequence quality analyzer to Wasm. And Disney built their Disney+ Application Development Kit on top of Wasm! The benefits in the browser are easy to see.

But Wasm is quickly spreading beyond the browser thanks to the WebAssembly System Interface (WASI). Companies like Vercel, Fastly, Shopify, and Cloudflare support using Wasm for running code at the edge, and Fermyon is building a platform to run Wasm microservices in the cloud.

Why Docker?

At Docker, our goal is to help developers bring their ideas to life by conquering the complexity of app development. We strive to make it easy to build, share, and run your application, regardless of the underlying technologies. By making containers accessible to all, we proved our ability to make the lives of developers easier and were recognized as the #1 most-loved developer tool.

We see Wasm as a complementary technology to Linux containers where developers can choose which technology they use (or both!) depending on the use case. And as the community explores what’s possible with Wasm, we want to help make Wasm applications easier to develop, build, and run using the experience and tools you know and love.

How do I get the technical preview?

Ready to dive in and try it for yourself? Great! But before you do, a couple quick notes to keep in mind as you start exploring:

Important note #1: This is a technical preview build of Docker Desktop, and things might not work as expected. Be sure to back up your containers and images before proceeding.Important note #2: This preview has the containerd image store enabled and cannot be disabled. If you’re not currently using the containerd image store, then pre-existing images and containers will be inaccessible.

You can download the technical preview build of Docker Desktop here:

macOS Apple SiliconmacOS IntelWindows AMD64Linux Arm64 (deb)Linux AMD64 (deb, rpm, tar)

Are there any known limitations?

Yes! This is an early technical preview and we’re still working on making the experience as smooth as possible. But here are a few things you should be aware of:

Docker Compose may not exit cleanly when interruptedWorkaround: Clean up docker-compose processes by sending them a SIGKILL (killall -9 docker-compose).Pushes to Hub might give an error stating server message: insufficient_scope: authorization failed, even after logging in using Docker DesktopWorkaround: Run docker login in the CLI

Okay, so how does the Wasm integration actually work?

We’re glad you asked! First off, we need to remind you that since this is a technical preview, things may change quite rapidly. But here’s how it currently works.

We’re leveraging our recent work to migrate image management to containerd, as it provides the ability to use both OCI-compatible artifacts and containerd shims.We collaborated with WasmEdge to create a containerd shim. This shim extracts the Wasm module from the OCI artifact and runs it using the WasmEdge runtime.We added support to declare the Wasm runtime, which will enable the use of this new shim.

Let’s look at an example!

After installing the preview, we can run the following command to start an example Wasm application:

docker run -dp 8080:8080 –name=wasm-example –runtime=io.containerd.wasmedge.v1 –platform=wasi/wasm32 michaelirwin244/wasm-example

Since a few of the flags might be unfamiliar, let’s explain what they’re doing:

–runtime=io.containerd.wasmedge.v1 – This informs the Docker engine that we want to use the Wasm containerd shim instead of the standard Linux container runtime–platform=wasi/wasm32 – This specifies the architecture of the image we want to use. By leveraging a Wasm architecture, we don’t need to build separate images for the different architectures. The Wasm runtime will do the final step of converting the Wasm binary to machine instructions.

After the image is pulled, the runtime reads the ENTRYPOINT of the image to locate and extract the Wasm module. The module is then loaded into the Wasm runtime, started, and networking is configured. We now have a Wasm app running on our machine!

This particular application is a simple web server that says “Hello world!” and echos data back to us. To verify it’s working, let’s first view the logs.

docker logs wasm-example
Server is now running

We can get the “Hello world” message by either opening to http://localhost:8080 or using curl.

curl localhost:8080

And our response will give us a Hello world message:

Hello world from Rust running with Wasm! Send POST data to /echo to have it echoed back to you

To send data to the echo endpoint, we can use curl:

curl localhost:8080/echo -d ‘{“message”:”Hi there”}’ -H “Content-type: application/json”

And we’ll see the data sent back to use in the response:

{“message”:”Hi there”}

To remove the application, you can remove it as you do any other Docker service:

docker rm -f wasm-example

The new integration means you can run a Wasm application alongside your Linux containers (even with Compose). To learn more, check out the docs!

What’s next for Wasm and Docker?

Another great question! Wasm is rapidly growing and evolving, including exploration on how to support multi-threading, garbage collection, and more. There are also many still-to-tackle challenges, including shortening the developer feedback loop and possible paths to production.

So try it out yourself and then let us know your thoughts or feedback on the public roadmap. We’d love to hear from you!
Quelle: https://blog.docker.com/feed/

Developer Engagement in the Remote Work Era with RedMonk and Miva

With the rise of remote-first and hybrid work models in the tech world, promoting developer engagement has become more important than ever. Maintaining a culture of engagement, productivity, and collaboration can be a hurdle for businesses making this new shift to remote work. But it’s far from impossible.

As a fully-remote, developer-focused company, Docker was thrilled to join in a like-minded conversation with RedMonk and Miva. Jake Levirne (Head of Product at Docker) was joined by Jon Burchmore (CTO at Miva) for a talk led by RedMonk’s Sr. Analyst Rachel Stephens. In this webinar on developer engagement in the remote work era, these industry specialists discuss navigating developer engagement with a focus on productivity, collaboration, and much more.

Navigating developer engagement

Companies with newly-distributed work environments often struggle to create an engaging culture for their employees. This remains especially true for the developer workforce. Because of this, developer engagement has become a priority for more organizations than ever, including Miva.

“We actually brought [developer engagement] up as a part of our developer roadmap. As we were talking about ‘this is our product roadmap for 2022 — what’s the biggest challenge?’, my answer was ‘keeping people engaged so that we can keep productivity high.’” Jon Burchmore

Like Miva, other organizations are starting to incorporate developer engagement into their broader business decisions. Teams are intentionally choosing tools and processes that support not only development requirements but also involvement and preference. By taking a look at productivity and collaboration, we can see the impact of these decisions. 

Measuring developer productivity and collaboration

As both an art and a science, measuring developer productivity and collaboration can be difficult. While metrics can be informative, Jon is most interested in seeing the qualitative impact.

“How much is the team engaging with itself […] and is that engagement bottom up […] or from peer-to-peer? And a healthy team to me feels like a team where the peers are engaging as well. It’s not everyone just going upstream to get their problems solved.” Jon Burchmore

As Jake adds, it’s more than just tracking lines of code. It’s about focusing on the outcomes. While developer engagement can be difficult to measure, the message is clear. Engaged developers are non-negotiable for high-performing teams.

Approaching developer collaboration

Developer collaboration is another linchpin for building developer engagement. Teams are now challenging themselves to find more opportunities for pair programming or similar types of coworking. Healthy collaboration should also not be limited to single teams.

“When you unlock collaboration both within teams and across teams, I think that’s what allows you to build what effectively are the increasingly complex real-world applications that are needed to keep creating business value.” Jake Levirne

Organizations are taking a more holistic, inter-team perspective to avoid the dreaded, siloed productivity approach.

Watch the full, on-demand webinar

These points are just a snapshot of our talk with RedMonk and Miva on the challenges of developer engagement in the remote work era. Hear the rest of the discussion and more detail by watching the full conversation on demand.
Quelle: https://blog.docker.com/feed/

Security Advisory: CVE-2022-42889 “Text4Shell”

What is it?

CVE-2022-42889, aka “Text4Shell”, is a vulnerability in the popular Java library “Apache Commons Text” which can result in arbitrary code execution when processing malicious input. More information can be found at GitHub advisory or this Apache thread.

What can an attacker do?

If you’re vulnerable, an attacker can inject malicious input containing keywords which can trigger: 

a DNS requesta call to a remote URLan inline script to execute

These three mechanisms will be executed on the server and can trigger arbitrary code to execute, pulling code from external sources or embedding arbitrary scripts.

This makes this vulnerability highly serious, although, in many cases, consumers of this library won’t be vulnerable due to not using the StringSubstitutor class (as below) and/or not passing in untrusted input into vulnerable functions.

Security researchers are also reporting that increased and significant activity to exploit this vulnerability is being recorded.

Am I vulnerable?

To be vulnerable, you must:

Use Apache Commons Text version 1.5-1.9 inclusiveHave code using the StringSubstitutor class with variable interpolationHave a mechanism of accepting input and passing it into the StringSubstitutor class

Docker vulnerability scanning tools including the docker scan CLI and Docker Hub Vulnerability Scanning, powered by Snyk, will detect the presence of the vulnerable versions of the library and flag your image as vulnerable (see below).

Note that you may not be vulnerable even if you’re using these versions, as your code paths may already mitigate this by either not using the vulnerable methods, or by not passing in user input into them (see the Mitigations section below). This may be difficult to validate, however, without understanding all the code paths in detail and where they may get input from. So the easiest fix is simply to upgrade all applications depending on vulnerable versions.

You can use docker scan to check if the image has the vulnerability. If Text4Shell is present you will see a message in the output log like this:

  Upgrade org.apache.commons:commons-text@1.9 to org.apache.commons:commons-text@1.10.0 to fix
✗ Arbitrary Code Execution (new) [High Severity][https://security.snyk.io/vuln/SNYK-JAVA-ORGAPACHECOMMONS-3043138] in org.apache.commons:commons-text@1.9
introduced by org.apache.commons:commons-text@1.9

To test this, you can check a vulnerable image, for example this neo4j image contains a vulnerable version of commons-text at /var/lib/neo4j/lib/commons-text-1.9.jar:

docker scan neo4j:latest@sha256:17334cbc668d852ca8a3d8590f66c4fda64d9c7de7d93cc62803f534ae7dbce6

Docker Hub scans

As of 12:00 UTC 21 October 2022, Docker Hub now identifies the Text4Shell vulnerability and will badge any image it finds vulnerable. This badge will be publicly visible for Docker Official Images and Docker Verified Publisher images, and privately visible for any other images with vulnerability scanning enabled.

Scans before this date may not reflect this vulnerability, however, we will continue to scan older Docker Official and Docker Verified Publisher images and will update the badges as the results are checked.

If an image has been scanned and is found to be affected by the Text4Shell vulnerability, then you’ll see the below badging and information next to the image:

Mitigations

The safest mitigation to execute is to update to version 1.10 of Apache Commons Text.

If updating to this version isn’t possible, the secondary mitigation is to check usage closely across your codebase and ensure untrusted user input isn’t being passed to the vulnerable functions.

Docker Official Images

A number of the Docker Official images do contain the vulnerable versions of Apache Commons Text. These will be publicly labeled in the Docker Hub user interface. For more detailed information on the current status of Docker Official Images please see https://docs.docker.com/security/.

Other images

We’re working with the Docker Verified Publishers to identify and update their affected images. We’re also looking at ways to highlight images that are affected, and we’ll continue to update this post as we have more information.

Is Docker infrastructure affected?

Docker Desktop and Docker Hub are not affected by the Text4Shell vulnerability. Docker largely uses Go code to build our applications, not Java. Although we do use some Java applications, we have confirmed we aren’t vulnerable to CVE-2022-42889.
Quelle: https://blog.docker.com/feed/

Control Dev Environments Better with Hardened Desktop (and More!)

Are you looking for even simpler and faster ways to do what you need in Docker Desktop? Whether you’re an admin looking for new ways to secure the supply chain or a developer who wants to discover new Docker Extensions or streamline your use of Dev Environments, Docker Desktop 4.13 has the updates you’re looking for. Read on to see what’s part of this release! 

Enhanced security and management for Docker Business customers

With this release, we’re introducing a new Docker Desktop security model: Hardened Docker Desktop This model includes two new features for Docker Business customers — Settings Management and Enhanced Container Isolation.

Settings Management

With Settings Management, admins can configure Docker Desktop’s settings on client machines throughout their org. In the new admin-settings.json file, admins are able to configure important security settings like proxies and network ranges, and ensure that these values can’t be modified by users.

Enhanced Container Isolation

For an extra layer of security, admins can also enable Enhanced Container Isolation, which ensures that any configurations set with Settings Management cannot be modified by user containers. Enhanced Container Isolation ensures that all containers run unprivileged in the Docker Desktop Linux VM using the Linux user-namespace, as well as introducing a host of other security enhancements. These features are the first within Docker’s new Hardened Desktop security model for Docker Business customers, which provides more granular control over Docker Desktop’s Linux VM.

Docker Extensions Categories

The Docker Extension Marketplace continues to grow, with over 25 extensions added since we launched at DockerCon! With all of these new options, it might be hard to know which extension will benefit you the most in your day to day workflows. 

That’s why in Docker Desktop 4.13, you can now search the Extensions Marketplace by title, description, or author. But there’s more — we also now provide a list of categories for filtering as per our roadmap issue.

The below screenshot shows the new categories that allow you to find useful extensions more easily. There’s categories for Kubernetes, security, testing tools, and more!Are there any extensions you’d like to see in the Marketplace? Let us know here!

How can I categorize my extension?

If you plan to publish your extension to the Marketplace, you can specify to which categories your extension belongs to. Add the label com.docker.extension.categories to the extension’s Dockerfile, followed by a list of comma separated values with the category keys defined in the docs.

For instance:

LABEL com.docker.extension.categories=”kubernetes,security”

Note that extensions published to the Marketplace before the 22nd of September 2022 have been auto-categorized by Docker, so if you’re the author of any of these, you don’t have to do anything.

Streamlined Dev Environments Experience

We’ve also made a number of improvements to Dev Environments with Docker Desktop 4.13:

CLI Plugin

Use the new docker dev CLI plugin to get the full Dev Environments experience from the terminal in addition to the Dashboard.

Launch from a Git repo

Now you can quickly launch a new environment from a Git repo:

docker dev create https://github.com/dockersamples/compose-dev-env

Simplified project configuration

Now all you need to get started is a compose-dev.yaml file. If you have an existing project with a .docker/ folder — don’t worry! It’ll be migrated automatically the next time you launch.

Dev Environments is still in beta, and your feedback is more important than ever. You can submit feedback directly from the Dev Environments tab in Docker Desktop.

What other features would make your life easier?

Now that you’ve learned what’s new, let us know what you think! Is there a feature or extension that will make using Docker an even better experience for you? Check out our public roadmap to leave feedback and to see what else is coming.
Quelle: https://blog.docker.com/feed/

Docker and Wasm Working Together? Find Out How at Wasm Day NA

You may have seen some hype around WebAssembly, or Wasm, as it’s often called. It’s a relatively new technology that allows you to compile application code written in languages like Rust, C, C++, Javascript, and Golang to byte code, then run it inside a sandboxed environment.

So why all the hype? Well, those sandboxed environments can run in a large variety of locations — including your web browser using a Javascript virtual machine. Not only does this mean the sandbox benefits from billions of dollars of investment in security, speed, and cross compatibility, it also means you can run existing code in your browser with some minor changes. And before you ask, yes, it can run Doom.

But running Doom in the browser is just one use case. Companies like WasmEdge are using Tensorflow to push the boundaries of what can be run with Wasm. Fermyon is building tools for Wasm to be used in microservices, while Vercel, Fastly, Shopify, and Cloudflare use Wasm for running code at the edge. Figma is using Wasm to provide higher performance in the browser for their application, and their new parent company Adobe is bringing their desktop applications to the Web using Wasm.

If all those examples don’t excite you about what’s possible with Wasm, I’m not sure what will!

How do Docker and Wasm fit together?

So what is Docker doing with Wasm? We see Wasm and containers as complementary technologies. The problem you’re solving will make one or the other more applicable, but they’re compatible, and should work well together in your cloud native application.

It really comes down to the use case. For example, Wasm’s quick startup time is great for short lived operations, and its isolation is a good match when you need strict security guarantees enforceable at the code level. But as of now, it doesn’t have multithreading or garbage collection capabilities, so any use case with those requirements isn’t a good fit. It also requires that you rebuild your software from source to work.

Join Docker at Cloud Native Wasm Day

We’ll be at the Cloud Native Wasm Day NA in Detroit on October 24, as a Diamond sponsor, to talk about how we’re providing developers the tooling they need using development experiences they already know and love.

Justin Cormack, our CTO, will be presenting during the keynote. In his presentation, he’ll talk about how the container, Docker, and cloud native communities are embracing Wasm — and give some insights as to where we can go from here. If you’ve never seen him speak, I highly recommend it!

Michael Yuan (WasmEdge) and I will also be giving a talk to show how WASI and container workloads work together in Docker Desktop. You’ll find out when to use Wasm, the current tooling options for Wasm, and how to use Docker and Wasm together. We’ll even share download links to the Docker + Wasm preview so you can give it a try yourself!

If you’re attending the Cloud Native Wasm Day don’t miss our keynote and talk!
Quelle: https://blog.docker.com/feed/

How to Fix and Debug Docker Containers Like a Superhero

While containers help developers rapidly build and run cross-platform applications, creating error-free apps remains a constant challenge. And while it’s not always obvious how container errors occur, this mystery is even harder for newer developers to unravel. Figuring out how to debug Docker containers can seem daunting.

In this Community All-Hands session, Ákos Takács demonstrated how to solve many of these pesky problems and gain the superpower of fixing containers.

Each issue can impact your image builds and final applications. Some bugs may not trigger clear error messages. To further complicate things, source-code inspection isn’t always helpful. 

But, common container issues don’t have to be your kryptonite! We’ll share Ákos’ favorite tips and show you how to conquer these development challenges.

In this tutorial:

Finding and fixing common container mistakesUsing the CLI for extra container visibilityChange your CLI output formatting for visibility and readabilityRemember to leverage your logsTackle issues with ENTRYPOINTAccess and inspect container contentDive deeply into files and foldersSolve Docker Build errorsSolve Docker Compose errorsOptional: Make direct file edits within running containersInvestigate less and develop more

Finding and fixing common container mistakes

Everyone is prone to the occasional silly mistake. You code when you’re tired, suffer from the occasional keyboard slip, or sometimes fail to copy text correctly between steps. These missteps can carry forward from one command to the next. And because easy-to-miss things like spelling errors or character omissions can fly under the radar, you’re left doing plenty of digging to solve basic problems. Nobody wants that, so what tools are at your disposal? 

Using the CLI for extra container visibility

Say we have an image downloaded from Docker Hub — any image at all — and use some variation of the docker run command to run it. The resulting container will be running the default command. If you want to surface that command, entering docker container ls –all will grab a list of containers with their respective commands. 

Users often copy these commands and reuse them within other longer CLI commands. As you’d expect, it’s incredibly easy to highlight incorrectly, copy an incomplete phrase, and run a faulty command that uses it.

While spinning up a new container, you’ll hit a snag. The runtime in this instance will fail since Docker cannot find the executable. It’s not located in the PATH, which indicates a problem:

Running the docker container ls –all command also offers some hints. Note the httpd-foregroun container command paired with its created (but not running) container. Conversely, the v0 container that’s running successfully leverages a valid, complete command:

How do we investigate further? Use the docker run –rm -it –name MYCONTAINER [IMAGE] bash command to open an interactive terminal within your container. Take the container’s default command and attempt to run it again. A “command not found” error message will appear.

This is much more succinct and shows that you’ve likely entered the wrong command — in this case by forgetting a character. While Ákos’ example uses httpd, it’s applicable to almost any container image. 

Change your CLI output formatting for visibility and readability

Container commands are clipped once they exceed a certain length in the terminal output. That prevents you from inspecting the command in its entirety. 

Luckily, Ákos showed how the –format ‘{{ json . }}’ | jq -C flag can improve how your terminal displays outputs. Instead of cutting off portions of text, here’s how your docker container ls –all result will look:

You can read and compare any parameters in full. Nothing is hidden. If you don’t have jq installed, you could instead enter the following command to display outputs similarly minus syntax highlighting. This beats the default tabular layout for troubleshooting:

docker container ls –all –format ‘{{ json . }}’ | python3 -m json.tool –json-lines

Lastly, why not just expand the original table view while only displaying relevant information? Run the following command with the –no-trunc flag to expand those table rows and completely reveal each cell’s contents:

docker container ls –all –format ‘table {{ .Names }}/t{{ .Status }}/t{{ .Command }}’ –no-trunc

These examples highlight the importance of visibility and transparency in troubleshooting. When you can uncover and easily digest the information you need, making corrections is much easier.      

Remember to leverage your logs

By following best practices, any active application running within a Docker container will produce log outputs. While you might view logging as a problem-catching mechanism, many running containers don’t experience issues.

Ákos believes it’s important to understand how normal log entries look. As a result, identifying abnormal log entries becomes that much easier. The docker logs command enables this:

The process of tuning your logs differs between tools and languages. For example, Ákos drew from methods involving httpd — like trace for detailed trace-level messages or LogLevel for filtering error messages — but these practices are widely applicable. You’ll probably want to zero in on startup and runtime errors to diagnose most issues. 

Log handling is configurable. Here are some common commands to help you drill down into container issues (and reduce noise):

Grab your container’s last 100 logs:

docker logs –tail 100 [container ID]

Grab all logs for a specific container:

docker logs [container ID]

View all active processes within a running container, should its logs be inaccessible:

docker top [container ID]

Log inspection enables easier remediation. Alongside Ákos, we agree that you should confirm any container changes or fixes after making them. This means you’ve taken the right steps and can move ahead.

Want to view all your logs together within Docker Desktop? Download our Logs Explorer extension, which lets you browse through your logs using filters and advanced search capabilities. You can even view new logs as they populate.

Tackle issues with ENTRYPOINT

When running applications, you’ll need to run executable files within your container. The ENTRYPOINT portion of your Dockerfile sets the main command within a container and basically assigns it a task. These ENTRYPOINT instructions rely on executable files being in the container. 

In Ákos’ example, he tackles a scenario where improper permissions can prevent Docker from successfully mounting and running an entrypoint.sh executable. You can copy his approach by doing the following: 

Use the ls -l $PWD/examples/v6/entrypoint.sh command to view your file’s permissions, which may be inadequate.Confirm that permissions are incorrect. Run a chmod 774 command to let this file read, write, and execute for all users.Use docker run to spin up a container v7 from the original entrypoint, which may work briefly but soon stop running. Inspect the entrypoint.sh file to confirm our desired command exists. 

We can confirm this again by entering docker container inspect v7-exiting to view our container definition and parameters. While the Entrypoint is specified, its Cmd definition is null. That’s what’s causing the issue:

Why does this happen? Many don’t know that by setting –entrypoint, any image with a default command will empty that command automatically. You’ll need to redefine your command for your container to work properly. Here’s how that CLI command might look:

docker run -d -v $PWD/examples/v7/entrypoint.sh:/entrypoint.sh –entrypoint /entrypoint.sh –name v7-running httpd:2.4 httpd-foreground

This works for any container image but we’re just drawing from an earlier example. If you run this and list your containers again, v7 will be active. Confirm within your logs that everything looks good. 

Access and inspect container content

Carefully managing files and system resources is critical during local development. That’s doubly true while working with multiple images, containers, or resource constraints. There are scenarios where your containers bloat as their contents accumulate over time. 

Keeping your files tidy is one thing. However, you may also want to copy your files from your container and move them into a temporary folder — using the docker cp command with a specified directory. Using a variation of ls -la ./var/v8, borrowing from Ákos’ example, then produces a list containing every file. 

This is great for visibility and confirming your container’s contents. And we can diagnose any issues one step further with docker container diff v8 to view which files have been changed, appended, or even deleted. If you’re experiencing strange container behavior, digging into these files might be useful. 

Dive deeply into files and folders

Close inspection is where hexdump comes in handy. The hexdump function converts your file into hexadecimal code, which is much more readable than binary. Ákos used the following commands:

docker cp v8:/usr/local/apache2/bin/httpd ./var/v8-httpd`
`hexdump -C -n 100 ./var/v8-httpd

You can adjust this -n number to read additional or fewer initial bytes. If your file contains text, this content will stand out and reveal the file’s main purpose. But, say you want to access a folder. While changing your directory and running docker container inspect … is standard, this method doesn’t work for Docker Desktop users. Since Desktop runs things in a VM, the host cannot access the folders within. 

Ákos showcased CTO Justin Cormack’s own nsenter1 image on GitHub, which lets us tap into those containers running with Docker Desktop environments. Docker Captain Bret Fisher has since expanded upon nsenter1’s documentation while adding useful commands. With these pieces in place, run the following command:

docker run –rm –privileged –pid=host alpine:3.16.2 nsenter -t 1 -m -u -i -n -p — sh -c “ cd ”$(docker container inspect v8 –format ‘{{ .GraphDriver.Data.UpperDir }}’}” && find .”

This command’s output mirrors that from our earlier docker container diff command. You can also run a hexdump using that same image above, which gives you the same troubleshooting abilities regardless of your environment. You can also inspect your entrypoint.sh to make important changes.  

Solve Docker Build errors 

While Docker BuildKit is quick and resilient, you can encounter errors that prevent image build completion. To learn why, run the following command to view each sequential build stage:

docker build $PWD/[MY SOURCE] –tag “MY TAG” –progress plain

BuildKit will provide readable context for each step and display any errors that occur:

If you see a missing file or directory error like the one above, don’t worry! You can use the cat $PWD/[MY SOURCE]/[MY DOCKERFILE] command to view the contents of your Dockerfile. Not only can you see where you misstepped more clearly, but you can also add a new instruction before the failing command to list your folder’s contents. 

Maybe those contents need updating. Maybe your folder is empty! In that case, you need to update everything so docker build has something to leverage. 

Next, run the build command again with the –no-cache flag added. This flag tells Docker to cleanly build from scratch each time without relying on caching:

You can progressively build updated versions of your Dockerfile and test those changes, given the cascading nature of instructions. Writing new instructions after the last working instruction — or making changes earlier on in your file — can eliminate those pesky build issues. Mechanisms like unlink or cp are helpful. The first behaves like rm while accepting only one argument, while cp copies critical files and folders into your image from a source.  

Solve Docker Compose errors

We use Docker Compose to spin up multiple services simultaneously using the docker compose –project-directory $PWD/[MY SOURCE] up -d command. 

However, one or more of those containers might unexpectedly exit. By running docker compose –project-directory $PWD/[MY SOURCE] ps to list out our services, you can see which containers are running or exited.

To pinpoint the problem, you’d usually grab logs via the docker compose logs command. You won’t need to specify a project directory in most cases. However, your container produces no logs since it isn’t running. 

Next, run the cat $PWD/[MY SOURCE]/docker-compose.yml command to view your Docker Compose file’s contents. It’s likely that your services definitions need fixing, so digging line by line within the CLI is helpful. Enter the following command to make this output even clearer:

docker compose –project-directory $PWD/[MY SOURCE] config

Your container exits when the commands contained within are invalid — just like we saw earlier. You’ll be able to see if you’ve entered a command incorrectly or if that command is empty. From there, you can update your Compose file and re-run docker compose –project-directory $PWD/[MY SOURCE] up -d. You can now confirm that everything is working by listing your services again. Your terminal will also output logs! 

Optional: Make direct file edits within running containers

Finally, it’s possible (and tempting) to directly edit your files within your container. This is viable while testing new changes and inspecting your containers. However, it’s usually considered best practice to create a new image and container instead. 

If you want to make edits within running containers, an editor like VS Code allows this, while IntelliJ doesn’t by comparison. Install the Docker extension for VS Code. You can then browse through your containers in the left sidebar, expand your collection of resources, and directly access important files. For example, web developers can directly edit their index.html files to change how user content is structured. 

Investigate less and develop more

Overall, the process of fixing a container, on the surface, may seem daunting to newer Docker users. The methods we’ve highlighted above can dramatically reduce that troubleshooting complexity — saving you time and effort. You can spend less time investigating issues and more time creating the applications users love. And we think those skills are pretty heroic. 

For more information, you can view Ákos Takács’ full presentation on YouTube to carefully follow each step. Want to dive deeper? Check out these additional resources to become a Docker expert: 

Learn how to view logs for a container or serviceView our Docker Run reference documentationLearn about best practices for writing Dockerfiles
Quelle: https://blog.docker.com/feed/

State of Application Development Survey: Tell Us How You Develop!

Welcome to the first annual Docker State of Application Development survey! Please help us deepen our knowledge of the developer community with 20 minutes of your time. We want to know where developers are focused in 2023 so we can make sure our products continue to serve you effectively. Your participation helps us to build the best experiences for you!

Participation will also enter you into a raffle for a chance to win one of the following prizes*:

1 Laptop Computer (Apple M1 Pro 14” or HP Dev One)3 Legos kits — Choose from the Millennium Falcon™, App-Controlled Cat® D11 Bulldozer, or The Colosseum.2 Consoles — Choose from a Playstation 5, Xbox Series X, or Nintendo Switch OLED.2 $300 Amazon.com gift cardsDocker swag sets

We’ll choose the winners randomly from those who complete the survey with meaningful answers. The results of the prize draw will be announced via email on November 11, 2022.

We’ll release the data in a full report in January 2023 so you can see what we heard from all of you — and gain key insights into today’s application development experience.

We’ve already started getting responses from the 7+ million Docker users worldwide, and we want to make sure our results are as representative and inclusive as possible.

Click here to take the State of Application Development survey.

We greatly appreciate every contribution. Your voice counts!

*Docker State of Application Development Promotion Official Rules.
Quelle: https://blog.docker.com/feed/

9 Tips for Containerizing Your Node.js Application

Over the last five years, Node.js has maintained its position as a top platform among professional developers. It’s an open source, cross-platform JavaScript runtime environment designed to maximize throughput. Node.js uses an event-driven, non-blocking I/O model that makes it lightweight and efficient — perfect for data intensive, real-time, and distributed applications. 

With over 90,500 stars and 24,400 forks, Node’s developer community is highly active. With more devs creating Node.js apps than ever before, finding efficient ways to build and deploy and cross platform is key. Let’s discuss how containerization can help before jumping into the meat of our guide. 

Why is containerizing a Node application important?

Containerizing your Node application has numerous benefits. First, Docker’s friendly, CLI-based workflow lets any developer build, share, and run containerized Node applications. Second, developers can install their app from a single package and get it up and running in minutes. Third, Node developers can code and test locally while ensuring consistency from development to production.

We’ll show you how to quickly package your Node.js app into a container. We’ll also tackle key concerns that are easy to forget — like image vulnerabilities, image bloat, missing image tags, and poor build performance. Let’s explore a simple todo list app and discuss how our nine tips might apply.

Analyzing a simple todo list application

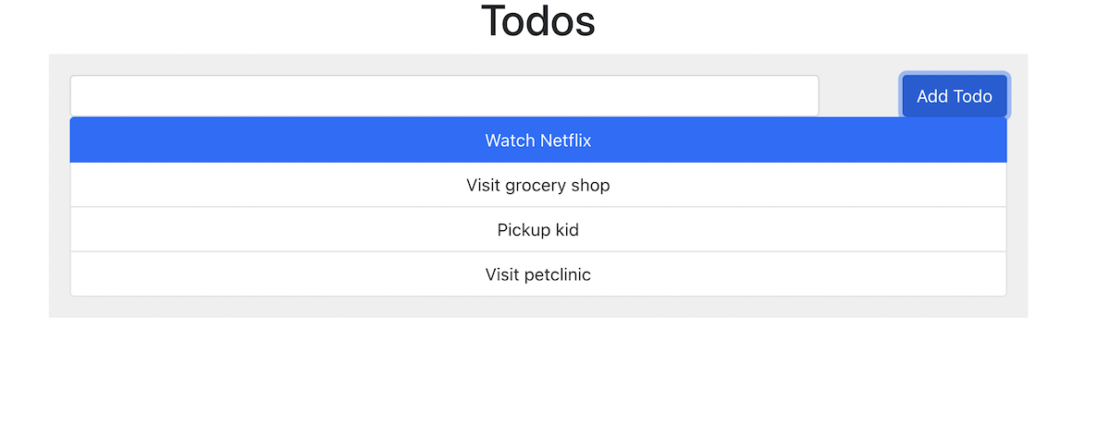
Let’s first consider a simple todo list application. This is a basic React application with a Node.js backend and a MongoDB database. The source code of the complete project is available within our GitHub samples repo.

Building the application

Luckily, we can build our sample application in just a few steps. First, you’ll want to clone the appropriate awesome-compose sample to use it with your project:

git clone https://github.com/dockersamples/awesome-compose/
cd awesome-compose/react-express-mongodb
docker compose -f docker-compose.yaml up -d

Second, enter the docker compose ps command to list out your services in the terminal. This confirms that everything is accounted for and working properly:

docker compose ps
NAME COMMAND SERVICE STATUS PORTS
backend "docker-entrypoint.s…" backend running 3000/tcp
frontend "docker-entrypoint.s…" frontend running 0.0.0.0:3000->3000/tcp
mongo "docker-entrypoint.s…" mongo running 27017/tcp

Third, open your browser and navigate to https://localhost:3000 to view your application in action. You’ll see your todo list UI and be able to directly interact with your application:

This is a great way to spin up a functional application in a short amount of time. However, remember that these samples are foundations you can build upon. They’re customizable to better suit your needs. And this can be important from a performance standpoint — since our above example isn’t fully optimized. Next, we’ll share some general optimization tips and more to help you build the best app possible. 

Our top nine tips for containerizing and optimizing Node applications

1) Use a specific base image tag instead of “version:latest”

When building Docker images, we always recommended specifying useful tags which codify version information, intended destination (prod or test, for instance), stability, or other useful information for deploying your application across environments.

Don’t rely on the latest tag that Docker automatically pulls, outside of local development. Using latest is unpredictable and may cause unexpected behavior. Each time you pull a latest image version, it could contain a new build or untested code that may break your application. 

Consider the following Dockerfile that uses the specific node:lts-buster Docker image as a base image instead of node:latest. This approach may be preferable since lts-buster is a stable image:

# Create image based on the official Node image from dockerhub
FROM node:lts-buster

# Create app directory
WORKDIR /usr/src/app

# Copy dependency definitions
COPY package.json ./package.json
COPY package-lock.json ./package-lock.json

# Install dependencies
#RUN npm set progress=false
# && npm config set depth 0
# && npm i install
RUN npm ci

# Get all the code needed to run the app
COPY . .

# Expose the port the app runs in
EXPOSE 3000

# Serve the app
CMD ["npm", "start"]

Overall, it’s often best to avoid using FROM node:latest in your Dockerfile.

2) Use a multi-stage build

With multi-stage builds, a Docker build can use one base image for compilation, packaging, and unit testing. A separate image holds the application’s runtime. This makes the final image more secure and shrinks its footprint (since it doesn’t contain development or debugging tools). Multi-stage Docker builds help ensure your builds are 100% reproducible and lean. You can create multiple stages within a Dockerfile to control how you build that image.

You can containerize your Node application using a multi-layer approach. Each layer may contain different app components like source code, resources, and even snapshot dependencies. What if we want to package our application into its own image like we mentioned earlier? Check out the following Dockerfile to see how it’s done:

FROM node:lts-buster-slim AS development

WORKDIR /usr/src/app

COPY package.json ./package.json
COPY package-lock.json ./package-lock.json
RUN npm ci

COPY . .

EXPOSE 3000

CMD [ "npm", "run", "dev" ]

FROM development as dev-envs
RUN <<EOF
apt-get update
apt-get install -y –no-install-recommends git
EOF

# install Docker tools (cli, buildx, compose)
COPY –from=gloursdocker/docker / /
CMD [ "npm", "run", "dev" ]

We first add an AS development label to the node:lts-buster-slim statement. This lets us refer to this build stage in other build stages. Next, we add a new development stage labeled dev-envs. We’ll use this stage to run our development.

Now, let’s rebuild our image and run our development. We’ll use the same docker build command as above — while adding the –target development flag to specifically run the development build stage:

docker build -t node-docker –target dev-envs .

3) Fix security vulnerabilities in your Node image

Today’s developers rely on third-party code and apps while building their services. External software can introduce unwanted vulnerabilities into your code if you’re not careful. Leveraging trusted images and continually monitoring your containers helps protect you.

Whenever you build a node:lts-buster-slim Docker image, Docker Desktop prompts you to run security scans of the image to detect any known vulnerabilities.

Let’s use the the Snyk Extension for Docker Desktop to inspect our Node.js application. To begin, install Docker Desktop 4.8.0+ on your Mac, Windows, or Linux machine. Next, check the box within Settings > Extensions to Enable Docker Extensions.

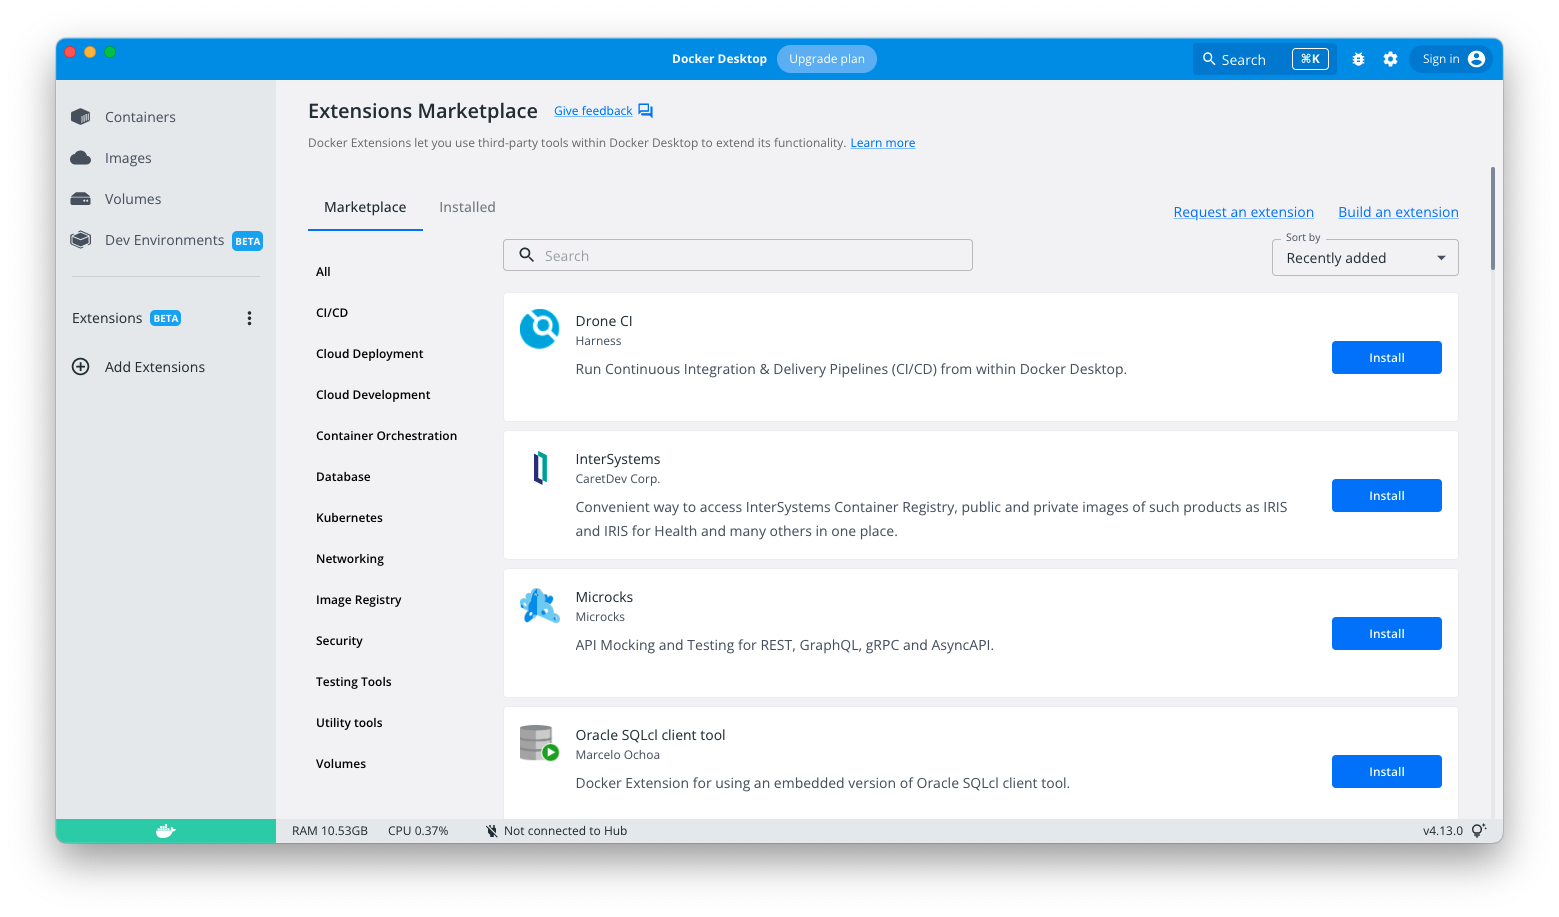
You can then browse the Extensions Marketplace by clicking the “Add Extensions” button in the left sidebar, then searching for Snyk.

Snyk’s extension lets you rapidly scan both local and remote Docker images to detect vulnerabilities.

Install the Snyk and enter the node:lts-buster-slim Node Docker Official Image into the “Select image name” field. You’ll have to log into Docker Hub to start scanning. Don’t worry if you don’t have an account — it’s free and takes just a minute to create.

When running a scan, you’ll see this result within Docker Desktop:

Snyk uncovered 70 vulnerabilities of varying severity during this scan. Once you’re aware of these, you can begin remediation to fortify your image.

That’s not all. In order to perform a vulnerability check, you can use  the docker scan command directly against your Dockerfile:

docker scan -f Dockerfile node:lts-buster-slim

4) Leverage HEALTHCHECK

The HEALTHCHECK instruction tells Docker how to test a container and confirm that it’s still working. For example, this can detect when a web server is stuck in an infinite loop and cannot handle new connections — even though the server process is still running.

When an application reaches production, an orchestrator like Kubernetes or a service fabric will most likely manage it. By using HEALTHCHECK, you’re sharing the status of your containers with the orchestrator to enable configuration-based management tasks. Here’s an example:

# syntax=docker/dockerfile:1.4

FROM node:lts-buster-slim AS development

# Create app directory
WORKDIR /usr/src/app

COPY package.json ./package.json
COPY package-lock.json ./package-lock.json
RUN npm ci

COPY . .

EXPOSE 3000

CMD [ "npm", "run", "dev" ]

FROM development as dev-envs
RUN <<EOF
apt-get update
apt-get install -y –no-install-recommends git
EOF

RUN <<EOF
useradd -s /bin/bash -m vscode
groupadd docker
usermod -aG docker vscode
EOF

HEALTHCHECK CMD curl –fail http://localhost:3000 || exit 1

# install Docker tools (cli, buildx, compose)
COPY –from=gloursdocker/docker / /
CMD [ "npm", "run", "dev" ]

When HEALTHCHECK is present in a Dockerfile, you’ll see the container’s health in the STATUS column after running the docker ps command. A container that passes this check is healthy. The CLI will label unhealthy containers as unhealthy:

docker ps
CONTAINER ID IMAGE COMMAND CREATED STATUS PORTS NAMES
1d0c5e3e7d6a react-express-mongodb-frontend "docker-entrypoint.s…" 23 seconds ago Up 21 seconds (health: starting) 0.0.0.0:3000->3000/tcp frontend
a89721d3c42d react-express-mongodb-backend "docker-entrypoint.s…" 23 seconds ago Up 21 seconds (health: starting) 3000/tcp backend
194c953f5653 mongo:4.2.0 "docker-entrypoint.s…" 3 minutes ago Up 3 minutes 27017/tcp mongo

You can also define a healthcheck (note the case difference) within Docker Compose! This can be pretty useful when you’re not using a Dockerfile. Instead of writing a plain text instruction, you’ll write this configuration in YAML format. 

Here’s a sample configuration that lets you define healthcheck within your docker-compose.yml file:

backend:
container_name: backend
restart: always
build: backend
volumes:
– ./backend:/usr/src/app
– /usr/src/app/node_modules
depends_on:
– mongo
networks:
– express-mongo
– react-express
expose:
– 3000
healthcheck:
test: ["CMD", "curl", "-f", "http://localhost:3000"]
interval: 1m30s
timeout: 10s
retries: 3
start_period: 40s

5) Use .dockerignore

To increase build performance, we recommend creating a .dockerignore file in the same directory as your Dockerfile. For this tutorial, your .dockerignore file should contain just one line:

node_modules

This line excludes the node_modules directory — which contains output from Maven — from the Docker build context. There are many good reasons to carefully structure a .dockerignore file, but this simple file is good enough for now.

Let’s now explain the build context and why it’s essential . The docker build command builds Docker images from a Dockerfile and a “context.” This context is the set of files located in your specified PATH or URL. The build process can reference any of these files. 

Meanwhile, the compilation context is where the developer works. It could be a folder on Mac, Windows, or a Linux directory. This directory contains all necessary application components like source code, configuration files, libraries, and plugins. With a .dockerignore file, we can determine which of the following elements like source code, configuration files, libraries, plugins, etc. to exclude while building your new image. 

Here’s how your .dockerignore file might look if you choose to exclude the node_modules directory from your build:

Backend:

Frontend:

6) Run as a non-root user for security purpose

Running applications with user privileges is safer since it helps mitigate risks. The same applies to Docker containers. By default, Docker containers and their running apps have root privileges. It’s therefore best to run Docker containers as non-root users. 

You can do this by adding USER instructions within your Dockerfile. The USER instruction sets the preferred user name (or UID) and optionally the user group (or GID) while running the image — and for any subsequent RUN, CMD, or ENTRYPOINT instructions:

FROM node:lts-buster AS development

WORKDIR /usr/src/app

COPY package.json ./package.json
COPY package-lock.json ./package-lock.json

RUN npm ci

COPY . .

EXPOSE 3000

CMD ["npm", "start"]

FROM development as dev-envs
RUN <<EOF
apt-get update
apt-get install -y –no-install-recommends git
EOF

RUN <<EOF
useradd -s /bin/bash -m vscode
groupadd docker
usermod -aG docker vscode
EOF
# install Docker tools (cli, buildx, compose)
COPY –from=gloursdocker/docker / /
CMD [ "npm", "start" ]

7) Favor multi-architecture Docker images

Your CPU can only run binaries for its native architecture. For example, Docker images built for an x86 system can’t run on an Arm-based system. With Apple fully transitioning to their custom Arm-based silicon, it’s possible that your x86 (Intel or AMD) container image won’t work with Apple’s M-series chips. 

Consequently, we always recommended building multi-arch container images. Below is the mplatform/mquery Docker image that lets you query the multi-platform status of any public image in any public registry:

docker run –rm mplatform/mquery node:lts-buster
Unable to find image ‘mplatform/mquery:latest’ locally
d0989420b6f0: Download complete
af74e063fc6e: Download complete
3441ed415baf: Download complete
a0c6ee298a93: Download complete
894bcacb16df: Downloading [=============================================> ] 3.146MB/3.452MB
Image: node:lts-buster (digest: sha256:a5d9200d3b8c17f0f3d7717034a9c215015b7aae70cb2a9d5e5dae7ff8aa6ca8)
* Manifest List: Yes (Image type: application/vnd.docker.distribution.manifest.list.v2+json)
* Supported platforms:
– linux/amd64
– linux/arm/v7
– linux/arm64/v8

We introduced the docker buildx command to help you build multi-architecture images. Buildx is a Docker component that enables many powerful build features with a familiar Docker user experience. All Buildx builds run using the Moby BuildKit engine.

BuildKit is designed to excel at multi-platform builds, or those not just targeting the user’s local platform. When you invoke a build, you can set the –platform flag to specify the build output’s target platform (like linux/amd64, linux/arm/v7, linux/arm64/v8, etc.):

docker buildx build –platform linux/amd64,linux/arm/v7 -t node-docker .

8) Explore graceful shutdown options for Node

Docker containers are ephemeral in nature. They can be stopped and destroyed, then either rebuilt or replaced with minimal effort. You can terminate containers by sending a SIGTERM notice signal to the process. This little grace period requires you to ensure that your app is handling ongoing requests and cleaning up resources in a timely fashion. 

On the other hand, Node.js accepts and forwards signals like SIGINT and SIGTERM from the OS, which is key to properly shutting down your app. Node.js lets your app decide how to handle those signals. If you don’t write code or use a module to handle them, your app won’t shut down gracefully. It’ll ignore those signals until Docker or Kubernetes kills it after a timeout period. 

Using certain init options like docker run –init or tini within your Dockerfile is viable when you can’t change your app code. However, we recommend writing code to handle proper signal handling for graceful shutdowns.

Check out this video from Docker Captain Bret Fisher (12:57) where he covers all three available Node shutdown options in detail.

9) Use the OpenTelemetry API to measure NodeJS performance

How do Node developers make their apps faster and more performant? Generally, developers rely on third-party observability tools to measure application performance. This performance monitoring is essential for creating multi-functional Node applications with top notch user experiences.

Observability extends beyond application performance. Metrics, traces, and logs are now front and center. Metrics help developers to understand what’s wrong with the system, while traces help you discover how it’s wrong. Logs tell you why it’s wrong. Developers can dig into particular metrics and traces to holistically understand system behavior.

Observing Node applications means tracking your Node metrics, requests rates, request error rate, and request durations. OpenTelemetry is one popular collection of tools and APIs that help you instrument your Node.js application.

You can also use an open-source tool like SigNoz to analyze your app’s performance. Since SigNoz offers a full-stack observability tool, you don’t need to rely on multiple tools.

Conclusion

In this guide, we explored many ways to optimize your Docker images — from carefully crafting your Dockerfile to securing your image via Snyk scanning. Building better Node.js apps doesn’t have to be complex. By nailing some core fundamentals, you’ll be in great shape. 

If you’d like to dig deeper, check out these additional recommendations and best practices for building secure, production-grade Docker images:

Docker development best practicesDockerfile best practicesBuilding images with BuildKitBest practices for scanning images Getting started with the Snyk Extension
Quelle: https://blog.docker.com/feed/