Kafka 101 | Red Hat Developer
developers.redhat.com – Learn about the fundamentals of Apache Kafka. This tutorial covers basic concepts of Kafka and its components.
Quelle: news.kubernauts.io
developers.redhat.com – Learn about the fundamentals of Apache Kafka. This tutorial covers basic concepts of Kafka and its components.
Quelle: news.kubernauts.io
This post was co-written with Eduardo Silva, Founder and CEO of Calyptia.
Applications produce a lot of observability data. And it can be a constant struggle to source, ingest, filter, and output that data to different systems. Managing these observability data pipelines is essential for being able to leverage your data and quickly gain actionable insights.
In cloud and containerized environments, Fluent Bit is a popular choice for marshaling data across cloud-native environments. A super fast, lightweight, and highly scalable logging and metrics processor and forwarder, it recently reached three billion downloads.
Calyptia Core, from the creators of Fluent Bit, further simplifies the data collection process with a powerful processing engine. Calyptia Core lets you create custom observability data pipelines and take control of your data.
And with the new Calyptia Core Docker Extension, you can build and manage observability pipelines within Docker Desktop. Let’s take a look at how it works!
What is Calyptia Core?
Calyptia Core plugs into your existing observability and security infrastructure to help you process large amounts of logs, metrics, security, and event data. With Calyptia Core, you can:
Connect common sources to the major destinations (e.g. Splunk, Datadog, Elasticsearch, etc.)
Process 100k events per second per replicas with efficient routing.
Automatically collect data from Kubernetes and its various flavors (GKE, EKS, AKS, OpenShift, Tanzu, etc).
Build reliability into your data pipeline at scale to debug data issues.
Why Calyptia Core?
Observability as a concept is common in the day-to-day life of engineers. But the different data standards, data schemas, storage backends, and dev stacks contribute to tool fatigue, resulting in lower developer productivity and increased total cost of ownership.
Calyptia Core aims to simplify the process of building an observability pipeline. You can also augment the streaming observability data to add custom markers and discard or mask unneeded fields.
Why run Calyptia Core as a Docker Extension?
Docker Extensions help you build and integrate software applications into your daily workflows. With Calyptia Core as a Docker Extension, you now have an easier, faster way to deploy Calyptia Core.
Once the extension is installed and started, you’ll have a running Calyptia core. This allows you to easily define and manage your observability pipelines and concentrate on what matters most — discovering actionable insights from the data.
Getting started with Calyptia Core
Calyptia Core is in Docker Extension Marketplace. In the tutorial below, we’ll install Calyptia Core in Docker Desktop, build a data pipeline with mock data, and visualize it with Vivo.
Initial setup
Make sure you’ve installed the latest version of Docker Desktop (or at least v4.8+). You’ll also need to enable Kubernetes under the Preferences tab. This will start a Kubernetes single-node cluster when starting Docker Desktop.
Installing the Calyptia Core Docker Extension
Step 1
Open Docker Desktop and click “Add Extensions” under Extensions to go to the Docker Extension Marketplace.
Step 2
Install the Calyptia Core Docker Extension.
By clicking on the details, you can see what containers or binaries are pulled during installation.
Step 3
Once the extension is installed, you’re ready to deploy Calyptia Core! Select “Deploy Core” and you’ll be asked to login and authenticate the token for the Docker Extension.
In your browser, you’ll see a message from https://core.calyptia.com/ asking to confirm the device.
Step 4
After confirming, Calyptia Core will be deployed. You can now select “Manage Core” to build, configure, and manage your data pipelines.
You’ll be taken to core.calyptia.com, where you can build your custom observability data pipelines from a host of source and destination connectors.
Step 5
In this tutorial, let’s create a new pipeline and set docker-extension as the name.
Add “Mock Data” as a source and “Vivo” as the destination.
NOTE: Vivo is a real time data viewer embedded in the Calyptia Core Docker Extension. You can make changes to the data pipelines like adding new fields or connectors and view the streaming observability data from Vivo in the Docker Extension.
Step 6
Hit “Save & Deploy” to create the pipeline in the Docker Desktop environment.
With the Vivo Live Data Viewer, you can view the data without leaving Docker Desktop.
Conclusion
The Calyptia Core Docker Extension makes it simple to manage and deploy observability pipelines without leaving the Docker Desktop developer environment. And that’s just the beginning. You can also use automated logging in Calyptia Core for automated data collection from your Kubernetes pods and use metadata to perform processing rules before it’s delivered to the chosen destination.
Give the Calyptia Core Docker Extension a try, and let us know what you think at hello@calyptia.com.
Quelle: https://blog.docker.com/feed/
medium.com – Compass has been growing rapidly over the last couple of years. As we became the largest independent brokerage in terms of 2021 closed sales volume as of March 25, 2022, our tech team has been…
Quelle: news.kubernauts.io
This article was co-authored by Advait Ruia, CEO at SuperTokens.
Authentication directly affects the UX, dev experience, and security of any app. Authentication solutions ensure that sensitive user data is protected and only owners of this data have access to it. Although authentication is a vital part of web services, building it correctly can be time-consuming and expensive. For a personal project, a simple email/password solution can be built in a day, but the security and reliability requirements of production-ready applications add additional complexities.
While there are a lot of resources available online, it takes time to go through all the content for every aspect of authentication (and even if you do, you may miss important information). And it takes even more effort to make sure your application is up to date with security best practices. If you’re going to move quickly while still meeting high standards, you need a solution that has the right level of abstraction, gives you maximum control, is secure, and is simple to use — just like if you build it from scratch, but without spending the time to learn, build, and maintain it.
Meet SuperTokens
SuperTokens is an open-source authentication solution. It provides an end-to-end solution to easily implement the following features:
Support for popular login methods:
Email/password
Passwordless (OTP or magic link based)
Social login through OAuth 2.0
Role-based access control
Session management
User management
Option to self-host the SuperTokens core or use the managed service
SDKs are available for all popular languages and front-end frameworks such as Node.js, React.js, Reactive Native, Vanilla JS, and more.
The architecture of SuperTokens
SuperTokens’ architecture is optimized to add secure authentication for your users without compromising on user and developer experience. It consists of three building blocks:
Frontend SDK: The frontend SDK is responsible for rendering the login UI, managing authentication flows, and user sessions. There are SDKs for Vanilla JS (Vue / Angular / JS), ReactJS, and React-Native.
Backend SDK: The backend SDK provides APIs for sign-up, sign-in, sign-out, session refreshing, etc. Your frontend will talk to these APIs, which are exposed on the same domain as your application’s APIs. Available SDKs: Node.js, Python, and GoLang.
SuperTokens Core: The HTTP service for the core authentication logic and database operations. This service is used by the Backend SDK. It’s responsible for interfacing with the database and is queried by our backend SDK for operations that require the database.
Architecture diagram of a self-hosted core.
To learn more about the SuperTokens architecture, watch this video
What’s unique about SuperTokens?
Here are some features that set SuperTokens apart from other user-authentication solutions:
Supertokens is easy to set up and offers quick start guides specific to your use case.
It’s open source, which means you can self-host the SuperTokens core and have control over user data. When you self-host the SuperTokens core, there are no usage limits — it can be used for free, forever.
It has low vendor lock-in since users have complete control over how SuperTokens works and where their data is stored.
The frontend of Supertokens is highly customizable. The authentication UI and authentication flows can be customized to your use case. The SuperTokens frontend SDK also offers helper functions for users who are looking to build their own custom UI.
SuperTokens integrates natively into your frontend and API layer. This means you have complete control over authentication flows. Through overrides, you can add analytics, add custom logic, or completely change authentication flows to fit your use case.
Why run Supertokens in Docker Desktop?
Docker Extensions help you build and integrate software applications into your daily workflows. With the SuperTokens extension, you get a simple way to quickly deploy Supertokens.
Once the extension is installed and started, you’ll have a running Supertokens core application. The extension allows you to connect to your preferred database, set the environment variable, and get your core connected to your backend.
The SuperTokens extension speeds up the process of getting started with SuperTokens and, over time, we hope to make it the best place to manage the SuperTokens core.
Getting started with SuperTokens
Step 1: Pick your authentication method
Your first step is picking the authentication strategy, or recipe, you want to implement in your applications:
Email Password
Social Login & Enterprise SSO
Passwordless (with SMS or email)
You can find user guides for all supported recipes here.
Step 2: Integrate with the SuperTokens Frontend and Backend SDKs.
After picking your recipe, you can start integrating the SuperTokens frontend and backend SDKs into your tech stack.
For example, if you want both email password and social authentication methods in your application, you can use this guide to initialize SuperTokens in your frontend and backend.
Step 3: Connect to the SuperTokens Core
The final step is setting up the SuperTokens core. SuperTokens offers a managed service to get started quickly, but today we’re going to take a look at how you can self-host and manage the SuperTokens core using the SuperTokens Docker extension.
Running the Supertokens core from Docker Desktop
Prerequisites: Docker Desktop 4.8 or later
Hop into Docker Desktop and confirm that the Docker Extensions feature is enabled. Go to Settings > Extensions > and check the “Enable Docker Extensions” box.
Setting up the extension
Step 1: Clone the SuperTokens extension
Run this command to clone the extension:
git clone git@github.com:supertokens/supertokens-docker-extension.git
Step 2: Follow the instructions in the README.md to set up the SuperTokens Extension
Build the extension:
make build-extension
Add the extension to Docker Desktop:
docker extension install supertokens/supertokens-docker-extension:latest
Once the extension is added to Docker Desktop, you can run the SuperTokens core.
Step 3: Select which database you want to use to persist user data.
SuperTokens currently supports MySQL and PostgreSQL. Choose which Docker image to load.
Step 4: Add your database connection URI
You’ll need to create a database SuperTokens can write to. Follow this guide to see how to do this. If you don’t provide a connection URI, SuperTokens will run with an in-memory database.
In addition to the connection URI, you can add environment variables to the Docker container to customize the core.
Step 5: Run the Docker container
Select “Start docker container” to start the SuperTokens core. This will start the SuperTokens core on port 3567. You can ping “https://localhost:3567” to check if the core is running successfully.
Step 6: Update the connection URI in your backend to “http://localhost:3567”
(Note: This example code snippet is for Node.js, but if you’re using Python or Golang, a similar change should be made. You can find the guide on how to do that here.)
Now that you’ve set up your core and connected it to your backend, your application should be up and ready to authenticate users!
Try SuperTokens for yourself!
To learn more about SuperTokens, you can visit our website or join our Discord community.
We’re committed to making SuperTokens a more powerful user-authentication solution for our developers and users — and we need help! We’re actively looking for active contributors to the SuperTokens Docker extension project. The current code is simple and easy to get started with. And we’re always around to give potential contributors a hand.
If you like SuperTokens, you can help us spread the word by adding a star to the repo.
Quelle: https://blog.docker.com/feed/
medium.com – Recently I got promoted to a Cloud Security Principle Consultant at Red Hat; As part of my advancing process, I’ve been working on multiple PoCs and demos around making Kubernetes & Openshift…
Quelle: news.kubernauts.io
Docker has a built-in stats command that makes it simple to see the amount of resources your containers are using. Just drop $ docker stats in your CLI and you’ll get a read out of the CPU, memory, network, and disk usage for all your running containers.
But this command only gives you a current moment in time. What if you wanted to see the evolution of the resources over time? Or see how much CPU and memory a Docker Compose project is using? Or sort containers by the most CPU-intensive, then filter by CPU usage over 80%?
With the Resource Usage extension, you can get a clearer view of your usage and the ability to analyze the data for better insights.
Let’s take a look at how it works.
How the Docker stats command works
Using Docker’s stats command, you get a live view of the resources used by your containers. Every running container can be analyzed using this tool to determine its CPU, memory, network, and disk utilization.
To use the command, open a terminal and run the docker stats command:
$ docker stats
CONTAINER CPU % MEM USAGE / LIMIT MEM % NET I/O BLOCK I/O
redis1 0.07% 796 KB / 64 MB 1.21% 788 B / 648 B 3.568 MB / 512 KB
redis2 0.07% 2.746 MB / 64 MB 4.29% 1.266 KB / 648 B 12.4 MB / 0 B
You can find out more about this command in the Docker documentation.
Docker stats is a useful command that provides information about the resources your containers are using at a given point in time. But that’s all it does. Before this extension, if you wanted to string together the information over a period of time, you were looking at a fairly manual process of pings and data consolidation.
Meet the Resource Usage extension
The Resource Usage extension shows which containers consume the most resources on their development machines by running the Docker stats command, then compiling the data into a user interface.
With the Resource Usage extension, you can quickly:
Analyze the most resource-intensive containers or Docker Compose projects.
Observe how resource usage changes over time for containers.
View how much CPU, memory, network, and disk space your containers use.
The cards at the top top of the extension give you a quick global overview of the resources in use:
CPU cores usage
Memory usage
# of running containers
The Table view shows the details for your containers. You can customize the view by selecting which columns you want to display and which values you want to filter. Here are the available columns:
NAME – The container name
STATUS – The container status (running or not running)
CPU (%) – The percentage of the host’s CPU and memory used by the container
MEM (%) – The amount of memory used out of the total limit it’s allowed to use
DISK READ/WRITE -The amount of data the container has read to and written from block devices on the host
NETWORK I/O – The amount of data the container has sent and received over its network interface
PIDs – the number of processes or threads the container has created
The Chart view provides a visual representation of usage over time.
How do I install the Resource Usage extension?
The Resource Usage extension is available on Docker Hub and under Extensions in Docker Desktop.
Let us know how you like it!
The Resource Usage extension helps you get powerful insights into how your containers are using resources so it’s easier and simpler to optimize your containers. Once you’ve tried it, we’d love to hear your feedback.
And if you haven’t tried Docker Extensions, explore the Extensions Marketplace and install a few! They expand your Docker Desktop capabilities with new tooling, like the ability to reclaim disk space used by Docker, explore logs, or backup, restore, and share volumes.
You can even create your own Docker Extensions for all OSes, including Windows, WSL2, macOS (both Intel and Apple Silicon), and Linux. Take a look at the official documentation for our Extensions SDK. You’ll find tutorials, design guidelines, and everything else you need to build an extension.
Once you’ve created an extension, if you’d like to share your extension with the Docker Community, submit it to the Extensions Marketplace.
Quelle: https://blog.docker.com/feed/

CNAs, or CVE Numbering Authorities, are an essential part of vulnerability reporting because they compose a cohort of bug bounty programs, organizations, and companies involved in the secure software supply chain. When millions of developers depend on your projects, like in Docker’s case, it’s important to be a CNA to reinforce your commitment to cybersecurity and good stewardship as part of the software supply chain.
Previously, Docker reported CVEs directly through MITRE and GitHub without CNA status (there are many other organizations that still do this today, and CVE reporting does not require CNA status).
But not anymore! Docker is now officially a CNA under MITRE, which means you should get better notifications and documentation when we publish a vulnerability.
What are CNAs? (And where does MITRE fit in?)
To understand how CNAs, CVEs, and MITRE fit together, let’s start with the reason behind all those acronyms. Namely, a vulnerability.
When a vulnerability pops up, it’s really important that it has a unique identifier so developers know they’re all talking about the same vulnerability. (Let’s be honest, calling it, “That Java bug” really isn’t going to cut it.)
So someone has to give it a CVE (Common Vulnerabilities and Exposures) designation. That’s where a CNA comes in. They submit a request to their root CNA, which is often MITRE (and no, MITRE isn’t an acronym). A new CVE number, or several, is then assigned depending on how the report is categorized, thus making it official. And to keep all the CNAs on the same page, there are companies that maintain the CVE system.
MITRE is a non-profit corporation that maintains the system with sponsorship from the US government’s CISA (Cybersecurity and Infrastructure Security Agency). Like CISA, MITRE helps lead the charge in protecting public interest when it comes to defense, cybersecurity, and a myriad of other industries.
The CVE system provides references and information about the scary-ickies or the ultra terrifying vulnerabilities found in the world of technology, making vulnerabilities for shared resources and technologies easy to publicize, notify folks about, and take action against.
If you feel like learning more about the CVE program check out MITRE’s suite of videos here or the program’s homepage.
Where does Docker fit in?
Docker has reported CVEs in the past directly through MITRE and has, for example, used the reporting functionality through GitHub on Docker Engine. By becoming a CNA, however, we can take a more direct and coordinated approach with our reporting.
And better reporting means better awareness for everyone using our tools!
Docker went through the process of becoming a CNA (including some training and homework) so we can more effectively report on vulnerabilities related to Docker Desktop and Docker Hub. The checklist for CNA status also includes having appropriate disclosure and advisory policies in place. Docker’s status as a CNA means we can centralize CVE reporting for our different offerings connected to Docker Desktop, as well as those connected to Docker Hub and the registry.
By becoming a CNA, Docker can be more active in the community of companies that make up the software supply chain. MITRE, as the default CNA and one of the root CNAs (CISA is a root CNA too), acts as the unbiased reviewer of vulnerability reports. Other organizations, vendors, or bug bounty programs, like Microsoft, HashiCorp, Rapid7, VMware, Red Hat, and hundreds of others, also act as CNAs.
Keep in mind that Docker’s status as a CNA means we’ll only report for products and projects we maintain. Being a CNA also includes consideration of when certain products might be end-of-life and how that affects CVE assignment.
Ch-ch-changes?
Will the experience of using Docker Hub and Docker Desktop because of Docker’s new CNA status? Short answer: no. Long answer: the core experience of using Docker will not change. We’ve just leveled up in tackling vulnerabilities and providing better notifications about those vulnerabilities.
By better notifications, we mean a centralized repository for our security advisories. Because these reported vulnerabilities will link back to MITRE’s CVE program, it makes them far easier to search for, track, and tell your friends, your dog, or your cat about.
To see the latest vulnerabilities as Docker reports them and CVEs become assigned, check out our advisory location here: https://docs.docker.com/security/. For historic advisories also check https://docs.docker.com/desktop/release-notes/ and https://docs.docker.com/engine/release-notes/.
Keep in mind that CVEs that get reported are those that affect the consumers of Docker’s toolset and will require remediation from us and potential upgrade actions from the user, just like any other CVE announcement you might have seen in the news recently.
So keep your fins ready for when CVEs we may announce might apply to you.
Help Docker help you
We still encourage users and security researchers to report anything concerning they encounter with their use of Docker Hub and/or Docker Desktop to security@docker.com. (For reference, our security and privacy guidelines can be found here.)
We also still encourage proper configuration according to Docker documentation and to not to do anything Moby wouldn’t do. (That means you should be whale-intentioned in your builds and help your fin-ends and family using Docker configure it properly.)
And while we can’t promise to stop using whale puns any time soon, we can promise to continue to be good stewards for developers — and a big part of that includes proper security procedures.
Quelle: https://blog.docker.com/feed/
Docker Desktop 4.15 is here, packed with usability upgrades to make it simpler to find the images you want, manage your containers, discover vulnerabilities, and work with dev environments. Not enough for you? Well, it’s also easier to build and share extensions to add functionality to Docker Desktop. And Wasm+Docker has moved from technical preview to beta!
Let’s dig into what’s new and great in Docker Desktop 4.15.
Improvements for macOS
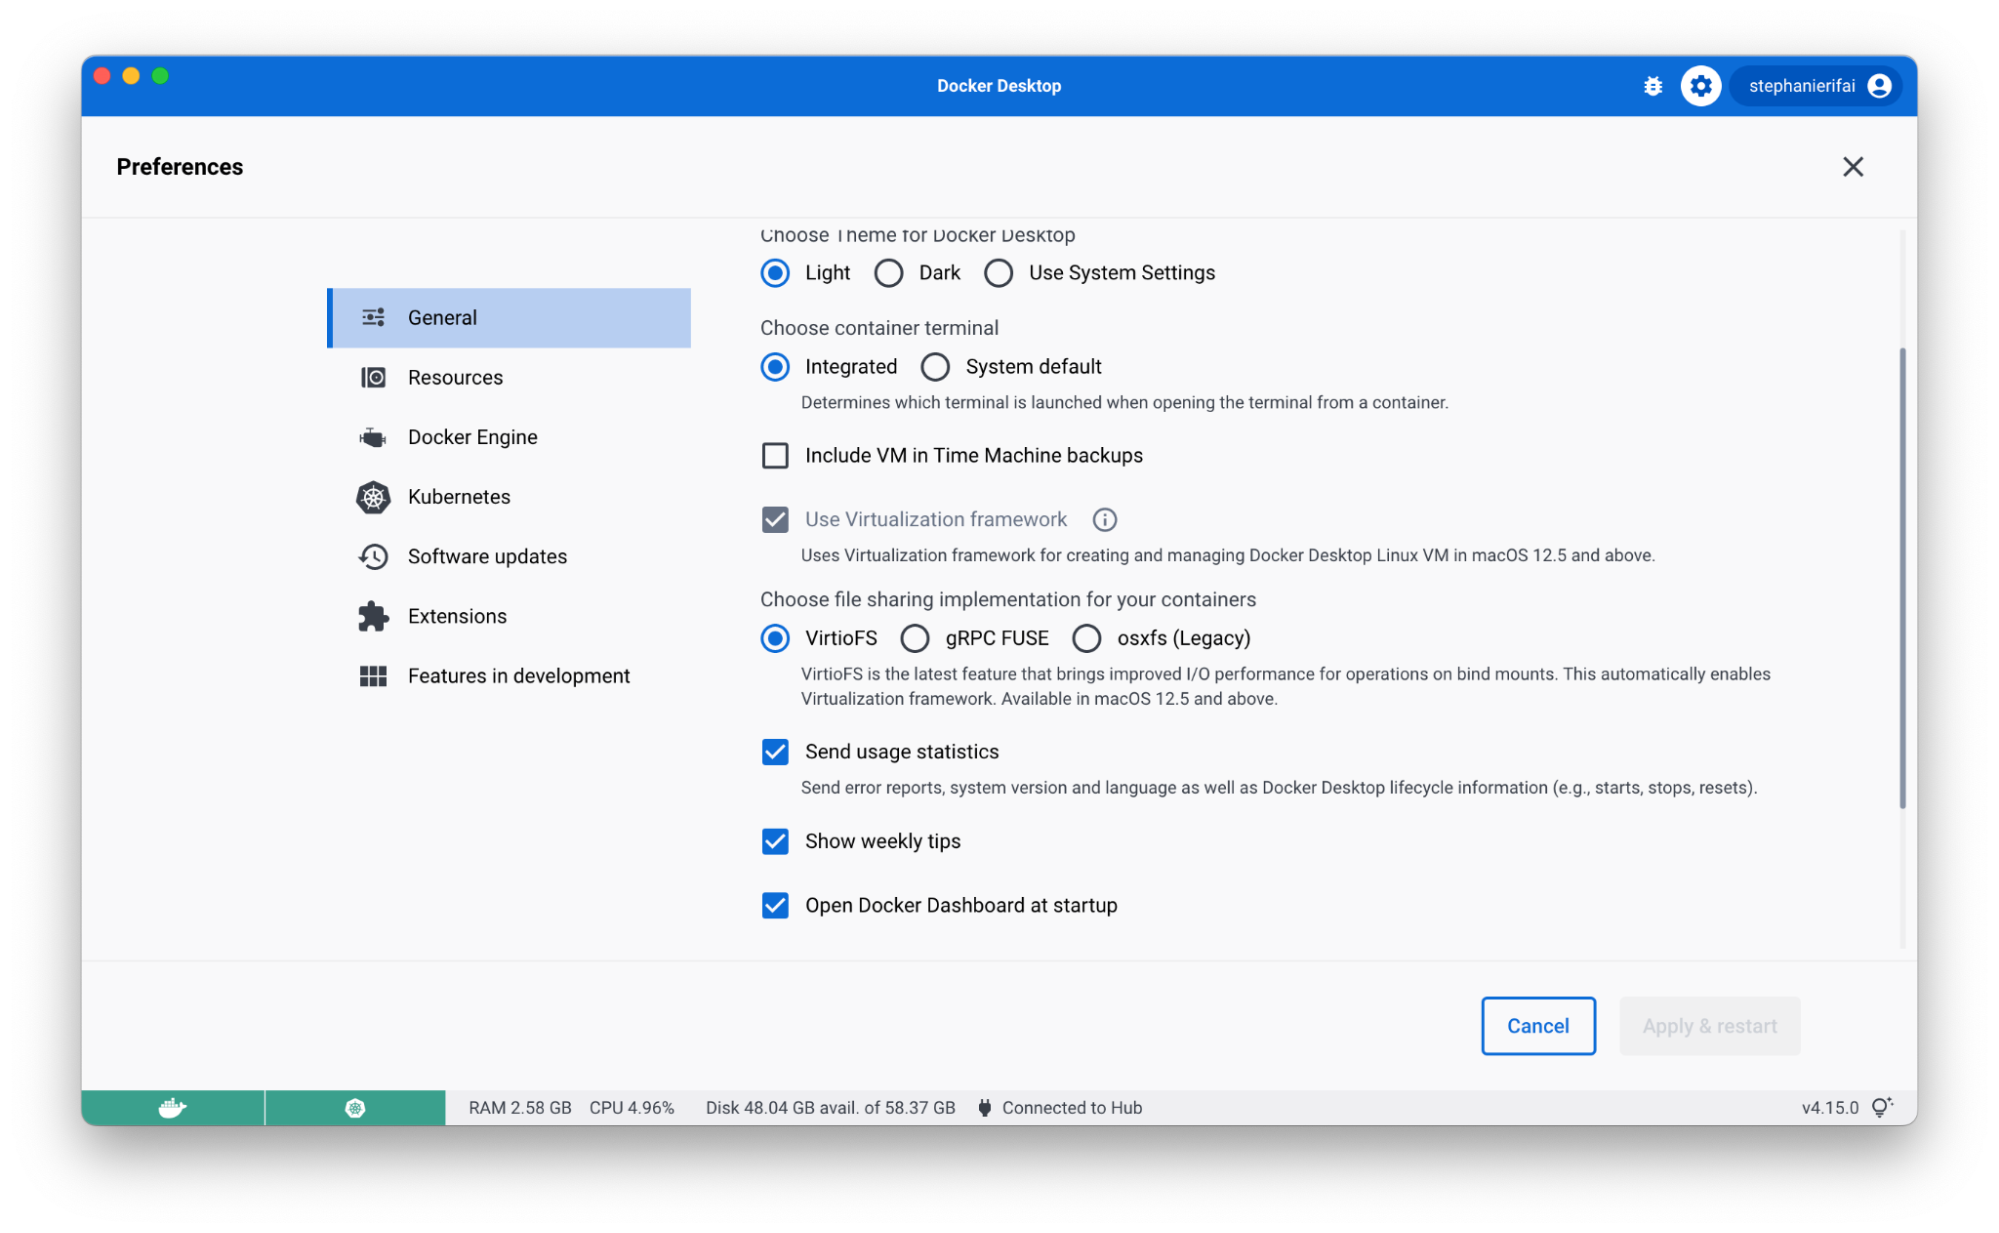
Move Faster with VirtioFS — now GA
Back in March, we introduced VirtioFS to improve sharing performance for macOS users. With Docker Desktop 4.15, it’s now generally available and you can enable it on the Preferences page.
Using VirtioFS and Apple’s Virtualization Framework can significantly reduce the time it takes to complete common tasks like package installs, database imports, and running unit tests. For developers, these gains in speed mean less time waiting for common operations to complete and more time focusing on innovation.
This option is available for macOS 12.5 and above. If you encounter any issues, you can turn this off in your settings tab.
Adminless install during first run on macOS
Now you don’t need to grant admin privileges to install and run Docker Desktop. Previously, Docker Desktop for Mac had to install the privileged helper process com.docker.vmnetd on install or on the first run.
There are some actions that may still require admin privileges (like binding to a privileged port), but when it’s needed, Docker Desktop will proactively inform you that you need to grant permission.
For more information see permission requirements for Mac.
Jump in faster with quick search
When you work with Docker Desktop, you probably know exactly which container you want to start with or image you want to run. But there might be times when you don’t remember if it’s already running — or if you pulled it locally at all.
So you might check a few of the current tabs in the Docker Dashboard, or maybe do a docker ps in the CLI. By the time you find what you need, you’ve checked a few different places, spent some time searching Docker Hub to find the right image, and probably got a little annoyed.
With quick search, you get to skip all of this (especially the annoyance!) and find exactly what you’re looking for in one simple search — along with relevant actions like the option to start/stop a container or run a new image. It even searches the Docker Hub API to help you run any public and private images you’ve hosted there!
To get started, click the search bar in the header (or use the shortcut: command+K on Mac / ctrl+K on Windows) and start typing.
The first tab shows results for any local containers or compose apps. You can perform quick actions like start, stop, delete, view logs, or start an interactive terminal session with a running container. You can also get a quick overview of the environment variables.
If you flip over to the Images tab, you’ll see results for Docker Hub images, local images, and images from remote repositories. (To see remote repository images, make sure you’re signed into your Docker Hub account.) Use the filter to easily narrow down the result types you want to see.
When you filter for local images, you’ll see some quick actions like run and an overview of which containers are using the image.
With Docker Hub images, you can pull the image by tag, run it (running will also pull the image as the first step), view documentation, or go to Docker Hub for more details.
Finally, with images in remote repositories, you can pull by tag or get quick info, like last updated date, size, or vulnerabilities.
Be sure to check out the tips in the footer of the search modal for more shortcuts and ways to use it. We’d love to hear your feedback on the experience and if there’s anything else you’d like to see added!
Flexible image management
Based on user feedback, Docker Desktop 4.15 includes user experience enhancements for the images tab. Cleaning up multiple images can now be done easier with multi-select checkboxes (this functionality used to be behind the “bulk clean up” button).
You can also manage your columns to only show exactly what you want. Want to view your complete container and image names? Drag the dividers in the table header to resize columns. You can also sort columns by header attributes or hide columns to create more space and reduce clutter.
And if you navigate away from your tab, don’t worry! State persistence will keep everything in place so your sorting and search results will be right where you left them.
Know your image vulnerabilities automatically
Docker Desktop now automatically analyzes images for vulnerabilities. When you explore an image, Docker Desktop will automatically provide you with vulnerability information at a base image and image layer level. The base image overview provides a high level view of any dependencies in packages that introduce Common Vulnerabilities and Exposures (CVEs). And it’ll let you know if there’s a newer base image version available.
If you’d prefer images were only analyzed on viewing them, you can turn off auto-analysis in Settings > Features in development > Experimental features > Enable background SBOM indexing.
Thanks to everyone who provided feedback in our 4.14 release. And let us know what you think of the new image overview!
Use Dev Environments with any IDE
When you create a new Dev Environment via Docker Desktop, you can now use any editor or IDE you’ve installed locally. Docker Desktop bind mounts your source code directory to the container. You can interact with the files locally as you normally do, and all your changes will be reflected in the Dev Environment.
Dev Environments help you manage and run your apps in Docker, while isolated from your local environment. For example, if you’re in the middle of a complicated refactor, Dev Environments makes it easier to review a PR without having to stash WIP. (Pro tip: you can install our extension for Chrome or Firefox to quickly open any PR as a Dev Environment!)
We’ve been making lots of little fixes to make Dev Environments better, including:
Custom names for projects
Better private repo support
Better port handling
CLI fixes (like interactive docker dev open)
Let us know what other improvements you’d like to see!
Building and sharing Docker Extensions just got easier
Did you know that you can build your own Docker Extension? Whether you’re just sharing it with your team or adding it to the Extensions Marketplace, Docker Desktop 4.15 makes the process easier and faster.
Meet the Build tab
In the Extensions Marketplace, you’ve got your Browse tab, your Manage tab, and, now, your Build tab. The Build tab brings all the resources you need to get started into one centralized view. You’ll find links to videos, documentation, community resources, and more! To start building, click “+ Add Extensions” in Docker Desktop and navigate to the new Build tab.
Share a link to your extension with others
So now you’ve made an extension to share with your teammates or the community. You could submit it to the Extensions Marketplace, but what if you aren’t quite ready to? (Or what if it’s just for your team?)
Prior to Docker Desktop 4.15, the extension developer had to share a CLI command that looked something like this: docker extension install IMAGE[:TAG]. Then anyone who wanted to install the extension had to paste that command into their CLI.
In Docker Desktop 4.15, we’ve simplified the process for both you and the developer you want to run your extension. When your extension’s ready to share, use the share button in the Manage tab to create a link. When the person you share it with opens on the link, they’ll be able to select the “Install” button from Docker Desktop.
Have an idea for a new Docker Extension?
If you have an idea for a new Docker Extension, we’ve got a new way that you can share them with Docker and the community. Inside the Extensions Marketplace, there’s a link to request an extension. This link will take you to our new GitHub repo that allows you to add your idea to our discussions and upvote existing ones. If you’re an extension developer, but aren’t sure what to build, be sure to check out the repo for some inspiration!
Docker+Wasm is now beta
We’ve integrated WasmEdge’s runwasi containerd shim into Docker Desktop (previously provided in a Technical Preview build).
This allows developers to run Wasm applications and compose Wasm applications with other containerized workloads, such as a database, in a single application stack. Learn more about it in the documentation and be on the lookout for more soon!
What else would make your life easier?
Take a test drive of the new usability upgrades and let us know what you think! Is there something you think we missed? Be sure to check out our public roadmap to see upcoming features — and to suggest any other ones you’d like to see.
And don’t forget to check out the release notes for a full breakdown of what’s new in Docker Desktop 4.15!
Quelle: https://blog.docker.com/feed/

Docker Hub now supports OCI Artifacts!
Docker Hub can now serve as a registry for any type of application artifact! It can help you distribute WebAssembly modules, helm charts, Docker Volumes, SBOMs, and more.
Learn More
Check out the most popular Docker content this month:
Security Advisory: High Severity OpenSSL Vulnerabilities– by Christian Dupuis, Principal Software Engineer at Docker
Build, Share, and Run WebAssembly Apps Using Docker (Video)– from Chris Crone, Director of Engineering at Docker
New in Docker Desktop 4.14: Greater Visibility Into Your Containers– by Amy Bass, Group Product Manager at Docker
How to Implement Decentralized Storage Using Docker Extensions– by Marton Elek, Principal Software Engineer at Storj
See more great content from Docker and the community
Read Now
Find us at AWS re:Invent!
Did you know you can buy Docker through AWS Marketplace? Stop by booth #946 to chat about the Hardened Desktop security model, Wasm, and deploying Docker to AWS.
Learn More
Subscribe to our newsletter to get the latest news, blogs, tips, how-to guides, best practices, and more from Docker experts sent directly in your inbox once a month.
Quelle: https://blog.docker.com/feed/
November’s been a busy month, and we’ve got three new Docker Extensions for you to try! Docker Extensions build new functionality into Docker Desktop, extend its existing capabilities, and allow you to discover and integrate additional tools that you’re already using with Docker. Let’s take a look at some of the latest ones.
And if you’d like to see everything available, check out our full Extensions Marketplace!
Look inside Kubernetes clusters with Calyptia Core
Do you struggle to understand what’s happening inside your Kubernetes clusters? Do you need help with automating the logging and a simpler way to aggregate your observability data? If the answer is yes, the Calyptia Core extension is definitely worth trying! The extension allows developers to build, configure, and manage high performant Kubernetes-based observability data pipelines with point-and-click ease.
With the extension, you can:
Eliminate the complexity of configuring and maintaining your observability pipeline
Create an integration between Calyptia Core and your local Docker Desktop Kubernetes cluster
Automate logging
Create custom data pipelines with support for user-defined processing rules
Check out this video to watch it in action:
Automate API testing with Postman’s Newman
Testing and debugging is an important part of any developer’s workflow. While working with APIs, you may need to automate API testing to run tests locally, run collections to assess the current status and health of your API, log test results and filter by test failures to debug unexpected API behavior, or run collections to execute an API workflow against different environment configurations.
Collections are a great way to handle these needs. With Postman collections and Postman’s Newman extension, you can run collections during development in both Docker Desktop and the command line.
See the resource usage of your containers
Docker stats is a great command for making it simple to see the amount of resources your containers are using. But what happens if you need to see resource usage over time? How do you see how much CPU and memory a Compose project is using?
That’s where the Resource Usage extension comes in. With this extension, you can:
Analyze the most resource-intensive containers or Docker Compose projects
Observe how resource usage changes over time for containers
View how much CPU, memory, network, and disk space your containers use
Check out the latest Docker Extensions with Docker Desktop
Docker is always looking for ways to improve the developer experience. Check out these resources for more info on extensions:
Install Docker Desktop for Mac, Windows, or Linux to try extensions yourself.
Visit our Extensions Marketplace to see all of our extensions.
Build your own extension with our Extensions SDK.
Quelle: https://blog.docker.com/feed/