Docker State of App Dev: Security

Security is a team sport: why everyone owns it now

Six security takeaways from Docker’s 2025 State of Application Development Report.

In the evolving world of software development, one thing is clear — security is no longer a siloed specialty. It’s a team sport, especially when vulnerabilities strike. That’s one of several key security findings in the 2025 Docker State of Application Development Survey.

Here’s what else we learned about security from our second annual report, which was based on an online survey of over 4,500 industry professionals.

1. Security isn’t someone else’s problem

Forget the myth that only “security people” handle security. Across orgs big and small, roles are blending. If you’re writing code, you’re in the security game. As one respondent put it, “We don’t have dedicated teams — we all do it.” According to the survey, just 1 in 5 organizations outsource security. And it’s top of mind at most others: only 1% of respondents say security is not a concern at their organization.

One exception to this trend: In larger organizations (50 or more employees), software security is more likely to be the exclusive domain of security engineers, with other types of engineers playing less of a role.

2. Everyone thinks they’re in charge of security

Team leads from multiple corners report that they’re the ones focused on security. Seasoned developers are as likely to zero in on it as are mid-career security engineers. And they’re both right. Security has become woven into every function — devs, leads, and ops alike.

3. When vulnerabilities hit, it’s all hands on deck

No turf wars here. When scan alerts go off, everyone pitches in — whether it’s security engineers helping experienced devs to decode scan results, engineering managers overseeing the incident, or DevOps engineers filling in where needed.

Fixing vulnerabilities is also a major time suck. Among security-related tasks that respondents routinely deal with, it was the most selected option across all roles. Worth noting: Last year’s State of Application Development Survey identified security/vulnerability remediation tools as a key area where better tools were needed in the development process.

4. Security isn’t the bottleneck — planning and execution are

Surprisingly, security doesn’t crack the top 10 issues holding teams back. Planning and execution-type activities are bigger sticking points. Translation? Security is better integrated into the workflow than many give it credit for. 

5. Shift-left is yesterday’s news

The once-pervasive mantra of “shift security left” is now only the 9th most important trend. Has the shift left already happened? Is AI and cloud complexity drowning it out? Or is this further evidence that security is, by necessity, shifting everywhere?

Again, perhaps security tools have gotten better, making it easier to shift left. (Our 2024 survey identified the shift-left approach as a possible source of frustration for developers and an area where more effective tools could make a difference.) Or perhaps there’s simply broader acceptance of the shift-left trend.

6. Shifting security left may not be the buzziest trend, but it’s still influential

The impact of shifting security left pales beside more dominant trends such as Generative AI and infrastructure as code. But it’s still a strong influence for developers in leadership roles. 

Bottom line: Security is no longer a roadblock; it’s a reflex. Teams aren’t asking, “Who owns security?” — they’re asking, “How can we all do it better?”

Quelle: https://blog.docker.com/feed/

How to Build, Run, and Package AI Models Locally with Docker Model Runner

Introduction

As a Senior DevOps Engineer and Docker Captain, I’ve helped build AI systems for everything from retail personalization to medical imaging. One truth stands out: AI capabilities are core to modern infrastructure.

This guide will show you how to run and package local AI models with Docker Model Runner — a lightweight, developer-friendly tool for working with AI models pulled from Docker Hub or Hugging Face. You’ll learn how to run models in the CLI or via API, publish your own model artifacts, and do it all without setting up Python environments or web servers.

What is AI in Development?

Artificial Intelligence (AI) refers to systems that mimic human intelligence, including:

Making decisions via machine learning

Understanding language through NLP

Recognizing images with computer vision

Learning from new data automatically

Common Types of AI in Development:

Machine Learning (ML): Learns from structured and unstructured data

Deep Learning: Neural networks for pattern recognition

Natural Language Processing (NLP): Understands/generates human language

Computer Vision: Recognizes and interprets images

Why Package and Run Your Own AI Model?

Local model packaging and execution offer full control over your AI workflows. Instead of relying on external APIs, you can run models directly on your machine — unlocking:

Faster inference with local compute (no latency from API calls)

Greater privacy by keeping data and prompts on your own hardware

Customization through packaging and versioning your own models

Seamless CI/CD integration with tools like Docker and GitHub Actions

Offline capabilities for edge use cases or constrained environments

Platforms like Docker and Hugging Face make cutting-edge AI models instantly accessible without building from scratch. Running them locally means lower latency, better privacy, and faster iteration.

Real-World Use Cases for AI

Chatbots & Virtual Assistants: Automate support (e.g., ChatGPT, Alexa)

Generative AI: Create text, art, music (e.g., Midjourney, Lensa)

Dev Tools: Autocomplete and debug code (e.g., GitHub Copilot)

Retail Intelligence: Recommend products based on behavior

Medical Imaging: Analyze scans for faster diagnosis

How to Package and Run AI Models Locally with Docker Model Runner

Prerequisites:

Docker Desktop 4.40+ installed

Experimental features and Model Runner enabled in Docker Desktop settings

(Recommended) Windows 11 with NVIDIA GPU or Mac with Apple Silicon

Internet access for downloading models from Docker Hub or Hugging Face

Step 0 — Enable Docker Model Runner

Open Docker Desktop

Go to Settings → Features in development

Under the Experimental features tab, enable Access experimental features

Click Apply and restart

Quit and reopen Docker Desktop to ensure changes take effect

Reopen Settings → Features in development

Switch to the Beta tab and check Enable Docker Model Runner

(Optional) Enable host-side TCP support to access the API from localhost

Once enabled, you can use the docker model CLI and manage models in the Models tab.

Screenshot of Docker Desktop’s Features in development tab with Docker Model Runner and Dev Environments enabled.

Step 1: Pull a Model

From Docker Hub:

docker model pull ai/smollm2

Or from Hugging Face (GGUF format):

docker model pull hf.co/bartowski/Llama-3.2-1B-Instruct-GGUF

Note: Only GGUF models are supported. GGUF (GPT-style General Use Format) is a lightweight binary file format designed for efficient local inference, especially with CPU-optimized runtimes like llama.cpp. It includes the model weights, tokenizer, and metadata all in one place, making it ideal for packaging and distributing LLMs in containerized environments.

Step 2: Tag and Push to Local Registry (Optional)

If you want to push models to a private or local registry:

Tag model with your registry’s address:

docker model tag hf.co/bartowski/Llama-3.2-1B-Instruct-GGUF localhost:5000/foobar

Run a local Docker registry:

docker run -d -p 6000:5000 –name registry registry:2

Push the model to the local registry:

docker model push localhost:6000/foobar

Check your local models with:

docker model list

Step 3: Run the Model

Run a prompt (one-shot)

docker model run ai/smollm2 "What is Docker?"

Interactive chat mode

docker model run ai/smollm2

Note: Models are loaded into memory on demand and unloaded after 5 minutes of inactivity.

Step 4: Test via OpenAI-Compatible API

To call the model from the host:

Enable TCP host access for Model Runner (via Docker Desktop GUI or CLI)

Screenshot of Docker Desktop’s Features in development tab showing host-side TCP support enabled for Docker Model Runner.

docker desktop enable model-runner –tcp 12434

Send a prompt using the OpenAI-compatible chat endpoint:

curl http://localhost:12434/engines/llama.cpp/v1/chat/completions
-H "Content-Type: application/json"
-d '{
"model": "ai/smollm2",
"messages": [
{"role": "system", "content": "You are a helpful assistant."},
{"role": "user", "content": "Tell me about the fall of Rome."}
]
}'

Note: No API key required — this runs locally and securely on your machine.

Step 5: Package Your Own Model

You can package your own pre-trained GGUF model as a Docker-compatible artifact if you already have a .gguf file — such as one downloaded from Hugging Face or converted using tools like llama.cpp.

Note: This guide assumes you already have a .gguf model file. It does not cover how to train or convert models to GGUF.

docker model package
–gguf "$(pwd)/model.gguf"
–license "$(pwd)/LICENSE.txt"
–push registry.example.com/ai/custom-llm:v1

This is ideal for custom-trained or private models. You can now pull it like any other model:

docker model pull registry.example.com/ai/custom-llm:v1

Step 6: Optimize & Iterate

Use docker model logs to monitor model usage and debug issues

Set up CI/CD to automate pulls, scans, and packaging

Track model lineage and training versions to ensure consistency

Use semantic versioning (:v1, :2025-05, etc.) instead of latest when packaging custom models

Only one model can be loaded at a time; requesting a new model will unload the previous one.

Compose Integration (Optional)

Docker Compose v2.35+ (included in Docker Desktop 4.41+) introduces support for AI model services using a new provider.type: model. You can define models directly in your compose.yml and reference them in app services using depends_on.

During docker compose up, Docker Model Runner automatically pulls the model and starts it on the host system, then injects connection details into dependent services using environment variables such as MY_MODEL_URL and MY_MODEL_MODEL, where MY_MODEL matches the name of the model service.

This enables seamless multi-container AI applications — with zero extra glue code. Learn more.

Navigating AI Development Challenges

Latency: Use quantized GGUF models

Security: Never run unknown models; validate sources and attach licenses

Compliance: Mask PII, respect data consent

Costs: Run locally to avoid cloud compute bills

Best Practices

Prefer GGUF models for optimal CPU inference

Use the –license flag when packaging custom models to ensure compliance

Use versioned tags (e.g., :v1, :2025-05) instead of latest

Monitor model logs using docker model logs

Validate model sources before pulling or packaging

Only pull models from trusted sources (e.g., Docker Hub’s ai/ namespace or verified Hugging Face repos).

Review the license and usage terms for each model before packaging or deploying.

The Road Ahead

Support for Retrieval-Augmented Generation (RAG)

Expanded multimodal support (text + images, video, audio)

LLMs as services in Docker Compose (Requires Docker Compose v2.35+)

More granular Model Dashboard features in Docker Desktop

Secure packaging and deployment pipelines for private AI models

Docker Model Runner lets DevOps teams treat models like any other artifact — pulled, tagged, versioned, tested, and deployed.

Final Thoughts

You don’t need a GPU cluster or external API to build AI apps. Learn more and explore everything you can do with Docker Model Runner:

Pull prebuilt models from Docker Hub or Hugging Face

Run them locally using the CLI, API, or Docker Desktop’s Model tab

Package and push your own models as OCI artifacts

Integrate with your CI/CD pipelines securely

You can also find other helpful information to get started at: 

Docker Hub – AI Namespace 

Docker Model Runner Docs 

OpenAI-Compatible API Guide

hello-genai Sample App

You’re not just deploying containers — you’re delivering intelligence.

Learn more

Read our quickstart guide to Docker Model Runner.

Find documentation for Model Runner.

Subscribe to the Docker Navigator Newsletter.

New to Docker? Create an account. 

Have questions? The Docker community is here to help.

Quelle: https://blog.docker.com/feed/

Publishing AI models to Docker Hub

When we first released Docker Model Runner, it came with built-in support for running AI models published and maintained by Docker on Docker Hub. This made it simple to pull a model like llama3.2 or gemma3 and start using it locally with familiar Docker-style commands.

Model Runner now supports three new commands: tag, push, and package. These enable you to share models with your team, your organization, or the wider community. Whether you’re managing your own fine-tuned models or curating a set of open-source models, Model Runner now lets you publish them to Docker Hub or any other OCI Artifact compatible Container Registry.  For teams using Docker Hub, enterprise features like Registry Access Management (RAM) provide policy-based controls and guardrails to help enforce secure, consistent access.

Tagging and pushing to Docker Hub

Let’s start by republishing an existing model from Docker Hub under your own namespace.

# Step 1: Pull the model from Docker Hub
$ docker model pull ai/smollm2

# Step 2: Tag it for your own organization
$ docker model tag ai/smollm2 myorg/smollm2

# Step 3: Push it to Docker Hub
$ docker model push myorg/smollm2

That’s it! Your model is now available at myorg/smollm2 and ready to be consumed using Model Runner by anyone with access.

Pushing to other container registries

Model Runner supports other container registries beyond Docker Hub, including GitHub Container Registry (GHCR).

# Step 1: Tag for GHCR
$ docker model tag ai/smollm2 ghcr.io/myorg/smollm2

# Step 2: Push to GHCR
$ docker model push ghcr.io/myorg/smollm2

Authentication and permissions work just like they do with regular Docker images in the context of GHCR, so you can leverage your existing workflow for managing registry credentials.

Packaging a custom GGUF file

Want to publish your own model file? You can use the package command to wrap a .gguf file into a Docker-compatible OCI artifact and directly push it into a Container Registry, such as Docker Hub.

# Step 1: Download a model, e.g. from HuggingFace
$ curl -L -o model.gguf https://huggingface.co/TheBloke/Mistral-7B-v0.1-GGUF/resolve/main/mistral-7b-v0.1.Q4_K_M.gguf

# Step 2: Package and push it
$ docker model package –gguf "$(pwd)/model.gguf" –push myorg/mistral-7b-v0.1:Q4_K_M

You’ve now turned a raw model file in GGUF format into a portable, versioned, and sharable artifact that works seamlessly with docker model run.

Conclusion

We’ve seen how easy it is to publish your own models using Docker Model Runner’s new tag, push, and package commands. These additions bring the familiar Docker developer experience to the world of AI model sharing. Teams and enterprises using Docker Hub can securely manage access and control for their models, just like with container images, making it easier to scale GenAI applications across teams.

Stay tuned for more improvements to Model Runner that will make packaging and running models even more powerful and flexible.

Learn more

Read our quickstart guide to Docker Model Runner.

Find documentation for Model Runner.

Subscribe to the Docker Navigator Newsletter.

New to Docker? Create an account. 

Have questions? The Docker community is here to help.

Quelle: https://blog.docker.com/feed/

Docker Desktop 4.42: Native IPv6, Built-In MCP, and Better Model Packaging

Docker Desktop 4.42 introduces powerful new capabilities that enhance network flexibility, improve security, and deepen AI toolchain integration, all while reducing setup friction. With native IPv6 support, a fully integrated MCP Toolkit, and major upgrades to Docker Model Runner and our AI agent Gordon, this release continues our commitment to helping developers move faster, ship smarter, and build securely across any environment. Whether you’re managing enterprise-grade networks or experimenting with agentic workflows, Docker Desktop 4.42 brings the tools you need right into your development workflows. 

IPv6 support 

Docker Desktop now provides IPv6 networking capabilities with customization options to better support diverse network environments. You can now choose between dual IPv4/IPv6 (default), IPv4-only, or IPv6-only networking modes to align with your organization’s network requirements. The new intelligent DNS resolution behavior automatically detects your host’s network stack and filters unsupported record types, preventing connectivity timeouts in IPv4-only or IPv6-only environments. 

These ipv6 settings are available in Docker Desktop Settings > Resources > Network section and can be enforced across teams using Settings Management, making Docker Desktop more reliable in complex enterprise network configurations including IPv6-only deployments.

Further documentation here.

Figure 1: Docker Desktop IPv6 settings

Docker MCP Toolkit integrated into Docker Desktop

Last month, we launched the Docker MCP Catalog and Toolkit to help developers easily discover MCP servers and securely connect them to their favorite clients and agentic apps. We’re humbled by the incredible support from the community. User growth is up by over 50%, and we’ve crossed 1 million pulls! Now, we’re excited to share that the MCP Toolkit is built right into Docker Desktop, no separate extension required.

You can now access more than 100 MCP servers, including GitHub, MongoDB, Hashicorp, and more, directly from Docker Desktop – just enable the servers you need, configure them, and connect to clients like Claude Desktop, Cursor, Continue.dev, or Docker’s AI agent Gordon.

Unlike typical setups that run MCP servers via npx or uvx processes with broad access to the host system, Docker Desktop runs these servers inside isolated containers with well-defined security boundaries. All container images are cryptographically signed, with proper isolation of secrets and configuration data. 

Figure 2: Docker MCP Toolkit is now integrated natively into Docker Desktop

To meet developers where they are, we’re bringing Docker MCP support to the CLI, using the same command structure you’re already familiar with. With the new docker mcp commands, you can launch, configure, and manage MCP servers directly from the terminal. The CLI plugin offers comprehensive functionality, including catalog management, client connection setup, and secret management.

Figure 3:  Docker MCP CLI commands.

Docker AI Agent Gordon Now Supports MCP Toolkit Integration

In this release, we’ve upgraded Gordon, Docker’s AI agent, with direct integration to the MCP Toolkit in Docker Desktop. To enable it, open Gordon, click the “Tools” button, and toggle on the “MCP” Toolkit option. Once activated, the MCP Toolkit tab will display tools available from any MCP servers you’ve configured.

Figure 4: Docker’s AI Agent Gordon now integrates with Docker’s MCP Toolkit, bringing 100+ MCP servers

This integration gives you immediate access to 100+ MCP servers with no extra setup, letting you experiment with AI capabilities directly in your Docker workflow. Gordon now acts as a bridge between Docker’s native tooling and the broader AI ecosystem, letting you leverage specialized tools for everything from screenshot capture to data analysis and API interactions – all from a consistent, unified interface.

Figure 5: Docker’s AI Agent Gordon uses the GitHub MCP server to pull issues and suggest solutions.

Finally, we’ve also improved the Dockerize feature with expanded support for Java, Kotlin, Gradle, and Maven projects. These improvements make it easier to containerize a wider range of applications with minimal configuration. With expanded containerization capabilities and integrated access to the MCP Toolkit, Gordon is more powerful than ever. It streamlines container workflows, reduces repetitive tasks, and gives you access to specialized tools, so you can stay focused on building, shipping, and running your applications efficiently.

Docker Model Runner adds Qualcomm support, Docker Engine Integration, and UX Upgrades

Staying true to our philosophy of giving developers more flexibility and meeting them where they are, the latest version of Docker Model Runner adds broader OS support, deeper integration with popular Docker tools, and improvements in both performance and usability.

In addition to supporting Apple Silicon and Windows systems with NVIDIA GPUs, Docker Model Runner now works on Windows devices with Qualcomm chipsets. Under the hood, we’ve upgraded our inference engine to use the latest version of llama.cpp, bringing significantly enhanced tool calling capabilities to your AI applications.Docker Model Runner can now be installed directly in Docker Engine Community Edition across multiple Linux distributions supported by Docker Engine. This integration is particularly valuable for developers looking to incorporate AI capabilities into their CI/CD pipelines and automated testing workflows. To get started, check out our documentation for the setup guide.

Get Up and Running with Models Faster

The Docker Model Runner user experience has been upgraded with expanded GUI functionality in Docker Desktop. All of these UI enhancements are designed to help you get started with Model Runner quickly and build applications faster. A dedicated interface now includes three new tabs that simplify model discovery, management, and streamline troubleshooting workflows. Additionally, Docker Desktop’s updated GUI introduces a more intuitive onboarding experience with streamlined “two-click” actions.

After clicking on the Model tab, you’ll see three new sub-tabs. The first, labeled “Local,” displays a set of models in various sizes that you can quickly pull. Once a model is pulled, you can launch a chat interface to test and experiment with it immediately.

Figure 6: Access a set of models of various sizes to get quickly started in Models menu of Docker Desktop

The second tab ”Docker Hub” offers a comprehensive view for browsing and pulling models from Docker Hub’s AI Catalog, making it easy to get started directly within Docker Desktop, without switching contexts.

Figure 7: A shortcut to the Model catalog from Docker Hub in Models menu of Docker Desktop

The third tab “Logs” offers real-time access to the inference engine’s log tail, giving developers immediate visibility into model execution status and debugging information directly within the Docker Desktop interface.

Figure 8: Gain visibility into model execution status and debugging information in Docker Desktop

Model Packaging Made Simple via CLI

As part of the Docker Model CLI, the most significant enhancement is the introduction of the docker model package command. This new command enables developers to package their models from GGUF format into OCI-compliant artifacts, fundamentally transforming how AI models are distributed and shared. It enables seamless publishing to both public and private and OCI-compatible repositories such as Docker Hub and establishes a standardized, secure workflow for model distribution, using the same trusted Docker tools developers already rely on. See our docs for more details. 

Conclusion 

From intelligent networking enhancements to seamless AI integrations, Docker Desktop 4.42 makes it easier than ever to build with confidence. With native support for IPv6, in-app access to 100+ MCP servers, and expanded platform compatibility for Docker Model Runner, this release is all about meeting developers where they are and equipping them with the tools to take their work further. Update to the latest version today and unlock everything Docker Desktop 4.42 has to offer.

Learn more

Authenticate and update today to receive your subscription level’s newest Docker Desktop features.

Subscribe to the Docker Navigator Newsletter.

Learn about our sign-in enforcement options.

New to Docker? Create an account. 

Have questions? The Docker community is here to help.

Quelle: https://blog.docker.com/feed/

Settings Management for Docker Desktop now generally available in the Admin Console

We’re excited to announce that Settings Management for Docker Desktop is now Generally Available!  Settings Management can be configured in the Admin Console for customers with a Docker Business subscription.  After a successful Early Access period, this powerful administrative solution has been enhanced with new compliance reporting capabilities, completing our vision for centralized Docker Desktop configuration management at scale through the Admin Console.To add additional context, Docker provides an enterprise-grade integrated solution suite for container development.  This includes administration and management capabilities that support enterprise needs for security, governance, compliance, scale, ease of use, control, insights, and observability.  These new Settings Management capabilities in the Admin Console for managing Docker Desktop instances are the latest enhancement to this area.  Also, we want to point out that this is part of Centralized Admin Settings in the Docker Admin Console, which provides organization administrators with a single, unified interface to configure and enforce security policies, manage user permissions, and control Docker Desktop settings across all users in their organization.  Overall, Centralized Admin Settings eliminates the need to manually configure each individual Docker machine and ensures consistent compliance and security standards company-wide.

Enterprise-grade management for Docker Desktop

First introduced in Docker Desktop 4.36 as an Early Access feature, Docker Desktop Settings Management enables administrators to centrally deploy and enforce settings policies directly from the Admin Console. From the Docker Admin Console, administrators can configure Docker Desktop settings according to a security policy and select users to whom the policy applies. When users start Docker Desktop, those settings are automatically applied and enforced.

With the addition of Desktop Settings Reporting in Docker Desktop 4.40, the solution offers end-to-end management capabilities from policy creation to compliance verification.

This comprehensive approach to settings management delivers on our promise to simplify Docker Desktop administration while ensuring organizational compliance across diverse enterprise environments.

Complete settings management lifecycle

Desktop Settings Management now offers multiple administration capabilities:

Admin Console policies: Configure and enforce default Docker Desktop settings directly from the cloud-based Admin Console. There’s no need to distribute admin-settings.json files to local machines via MDM.

Quick import: Seamlessly migrate existing configurations from admin-settings.json files

Export and share: Easily share policies as JSON files with security and compliance teams

Targeted testing: Roll out policies to smaller groups before deploying globally

Enhanced security: Benefit from improved signing and reporting methods that reduce the risk of tampering with settings

Settings compliance reporting: Track and verify policy application across all developers in your engineering organization

Figure 1: Admin Console Settings Management

New: Desktop Settings Reporting

The newly added settings reporting dashboard in the Admin Console provides administrators with crucial visibility into the compliance status of all users:

Real-time settings compliance tracking: Easily monitor which users are compliant with their assigned settings policies.

Streamlined troubleshooting: Detailed status information helps administrators diagnose and resolve non-compliance issues.

The settings reporting dashboard is accessible via Admin Console > Docker Desktop > Reporting, offering options to:

Search by username or email address

Filter by assigned policies

Toggle visibility of compliant users to focus on potential issues

View detailed compliance information for specific users

Download comprehensive compliance data as a CSV file

For non-compliant users, the settings reporting dashboard provides targeted resolution steps to help administrators quickly address issues and ensure organizational compliance.

Figure 2: Admin Console Settings Reporting

Figure 3: Locked settings in Docker Desktop

Enhanced security through centralized management

Desktop Settings Management is particularly valuable for engineering organizations with strict security and compliance requirements. This GA release enables administrators to:

Enforce consistent configuration across all Docker Desktop instances, without having to go through complicated and error prone MDM based deployments

Verify policy application and quickly remediate non-compliant systems

Reduce the risk of tampering with local settings

Generate compliance reports for security audits

Getting started

To take advantage of Desktop Settings Management:

Ensure your Docker Desktop users are signed in on version 4.40 or later

Log in to the Docker Admin Console

Navigate to Docker Desktop > Settings Management to create policies

Navigate to Docker Desktop > Reporting to monitor compliance

For more detailed information, visit our documentation on Settings Management.

What’s next?

Included with Docker Business, the GA release of Settings Management for Docker Desktop represents a significant milestone in our commitment to delivering enterprise-grade management, governance, and administration tools. We’ll continue to enhance these capabilities based on customer feedback, enterprise needs, and evolving security requirements.

We encourage you to explore Settings Management and let us know how it’s helping you manage Docker Desktop instances more efficiently across your development teams and engineering organization.We’re thrilled to meet the management and administration needs of our customers with these exciting enhancements and we want you to stay connected with us as we build even more administration and management capabilities for development teams and engineering organizations.

Learn more

Use the Docker Admin Console with your Docker Business subscription

Read documentation on Desktop Settings Management

Configure Settings Management with the Admin Console

Subscribe to the Docker Navigator Newsletter.

New to Docker? Create an account. 

Have questions? The Docker community is here to help.

Thank you!

Quelle: https://blog.docker.com/feed/

How to Make an AI Chatbot from Scratch using Docker Model Runner

Today, we’ll show you how to build a fully functional Generative AI chatbot using Docker Model Runner and powerful observability tools, including Prometheus, Grafana, and Jaeger. We’ll walk you through the common challenges developers face when building AI-powered applications, demonstrate how Docker Model Runner solves these pain points, and then guide you step-by-step through building a production-ready chatbot with comprehensive monitoring and metrics.

By the end of this guide, you’ll know how to make an AI chatbot and run it locally. You’ll also learn how to set up real-time monitoring insights, streaming responses, and a modern React interface — all orchestrated through familiar Docker workflows.

The current challenges with GenAI development

Generative AI (GenAI) is revolutionizing software development, but creating AI-powered applications comes with significant challenges. First, the current AI landscape is fragmented — developers must piece together various libraries, frameworks, and platforms that weren’t designed to work together. Second, running large language models efficiently requires specialized hardware configurations that vary across platforms, while AI model execution remains disconnected from standard container workflows. This forces teams to maintain separate environments for their application code and AI models.

Third, without standardized methods for storing, versioning, and serving models, development teams struggle with inconsistent deployment practices. Meanwhile, relying on cloud-based AI services creates financial strain through unpredictable costs that scale with usage. Additionally, sending data to external AI services introduces privacy and security risks, especially for applications handling sensitive information.

These challenges combine to create a frustrating developer experience that hinders experimentation and slows innovation precisely when businesses need to accelerate their AI adoption. Docker Model Runner addresses these pain points by providing a streamlined solution for running AI models locally, right within your existing Docker workflow.

How Docker is solving these challenges

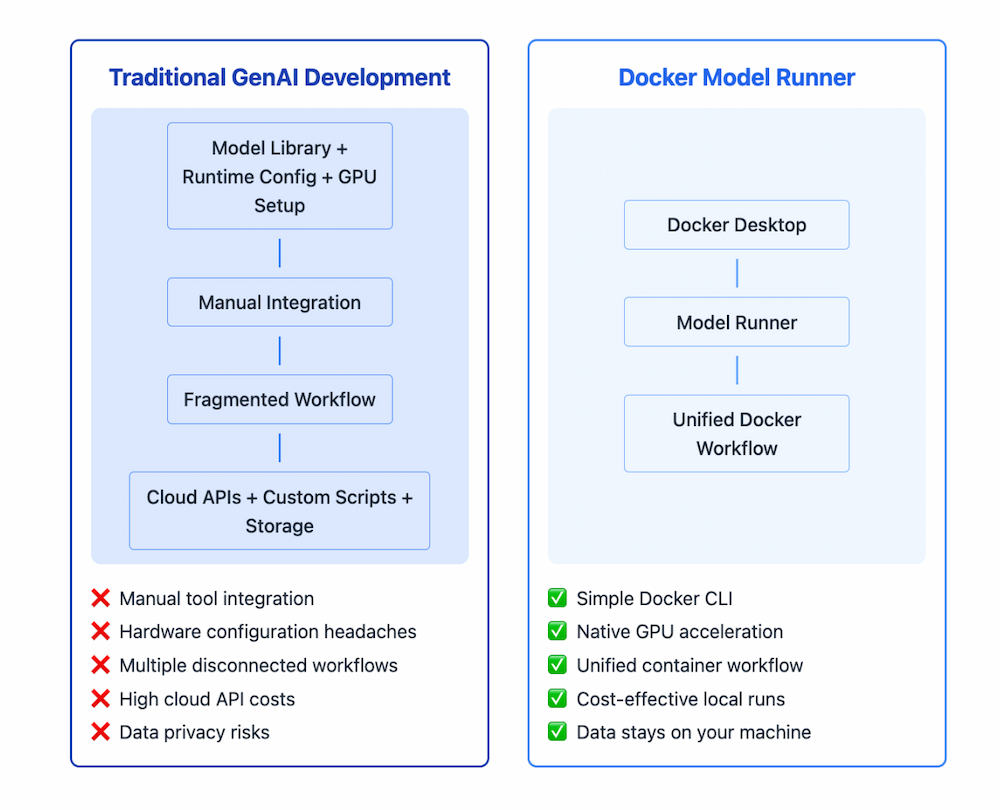
Docker Model Runner offers a revolutionary approach to GenAI development by integrating AI model execution directly into familiar container workflows. 

Figure 1: Comparison diagram showing complex multi-step traditional GenAI setup versus simplified Docker Model Runner single-command workflow

Many developers successfully use containerized AI models, benefiting from integrated workflows, cost control, and data privacy. Docker Model Runner builds on these strengths by making it even easier and more efficient to work with models. By running models natively on your host machine while maintaining the familiar Docker interface, Model Runner delivers.

Simplified Model Execution: Run AI models locally with a simple Docker CLI command, no complex setup required.

Hardware Acceleration: Direct access to GPU resources without containerization overhead

Integrated Workflow: Seamless integration with existing Docker tools and container development practices

Standardized Packaging: Models are distributed as OCI artifacts through the same registries you already use

Cost Control: Eliminate unpredictable API costs by running models locally

Data Privacy: Keep sensitive data within your infrastructure with no external API calls

This approach fundamentally changes how developers can build and test AI-powered applications, making local development faster, more secure, and dramatically more efficient.

How to create an AI chatbot with Docker

In this guide, we’ll build a comprehensive GenAI application that showcases how to create a fully-featured chat interface powered by Docker Model Runner, complete with advanced observability tools to monitor and optimize your AI models.

Project overview

The project is a complete Generative AI interface that demonstrates how to:

Create a responsive React/TypeScript chat UI with streaming responses

Build a Go backend server that integrates with Docker Model Runner

Implement comprehensive observability with metrics, logging, and tracing

Monitor AI model performance with real-time metrics

Architecture

The application consists of these main components:

The frontend sends chat messages to the backend API

The backend formats the messages and sends them to the Model Runner

The LLM processes the input and generates a response

The backend streams the tokens back to the frontend as they’re generated

The frontend displays the incoming tokens in real-time

Observability components collect metrics, logs, and traces throughout the process

Figure 2: Architecture diagram showing data flow between frontend, backend, Model Runner, and observability tools like Prometheus, Grafana, and Jaeger.

Project structure

The project has the following structure:

tree -L 2
.
├── Dockerfile
├── README-model-runner.md
├── README.md
├── backend.env
├── compose.yaml
├── frontend
..
├── go.mod
├── go.sum
├── grafana
│ └── provisioning
├── main.go
├── main_branch_update.md
├── observability
│ └── README.md
├── pkg
│ ├── health
│ ├── logger
│ ├── metrics
│ ├── middleware
│ └── tracing
├── prometheus
│ └── prometheus.yml
├── refs
│ └── heads
..

21 directories, 33 files

We’ll examine the key files and understand how they work together throughout this guide.

Prerequisites

Before we begin, make sure you have:

Docker Desktop (version 4.40 or newer) 

Docker Model Runner enabled

At least 16GB of RAM for running AI models efficiently

Familiarity with Go (for backend development)

Familiarity with React and TypeScript (for frontend development)

Getting started

To run the application:

Clone the repository: 

git clone

https://github.com/dockersamples/genai-model-runner-metrics

cd genai-model-runner-metrics

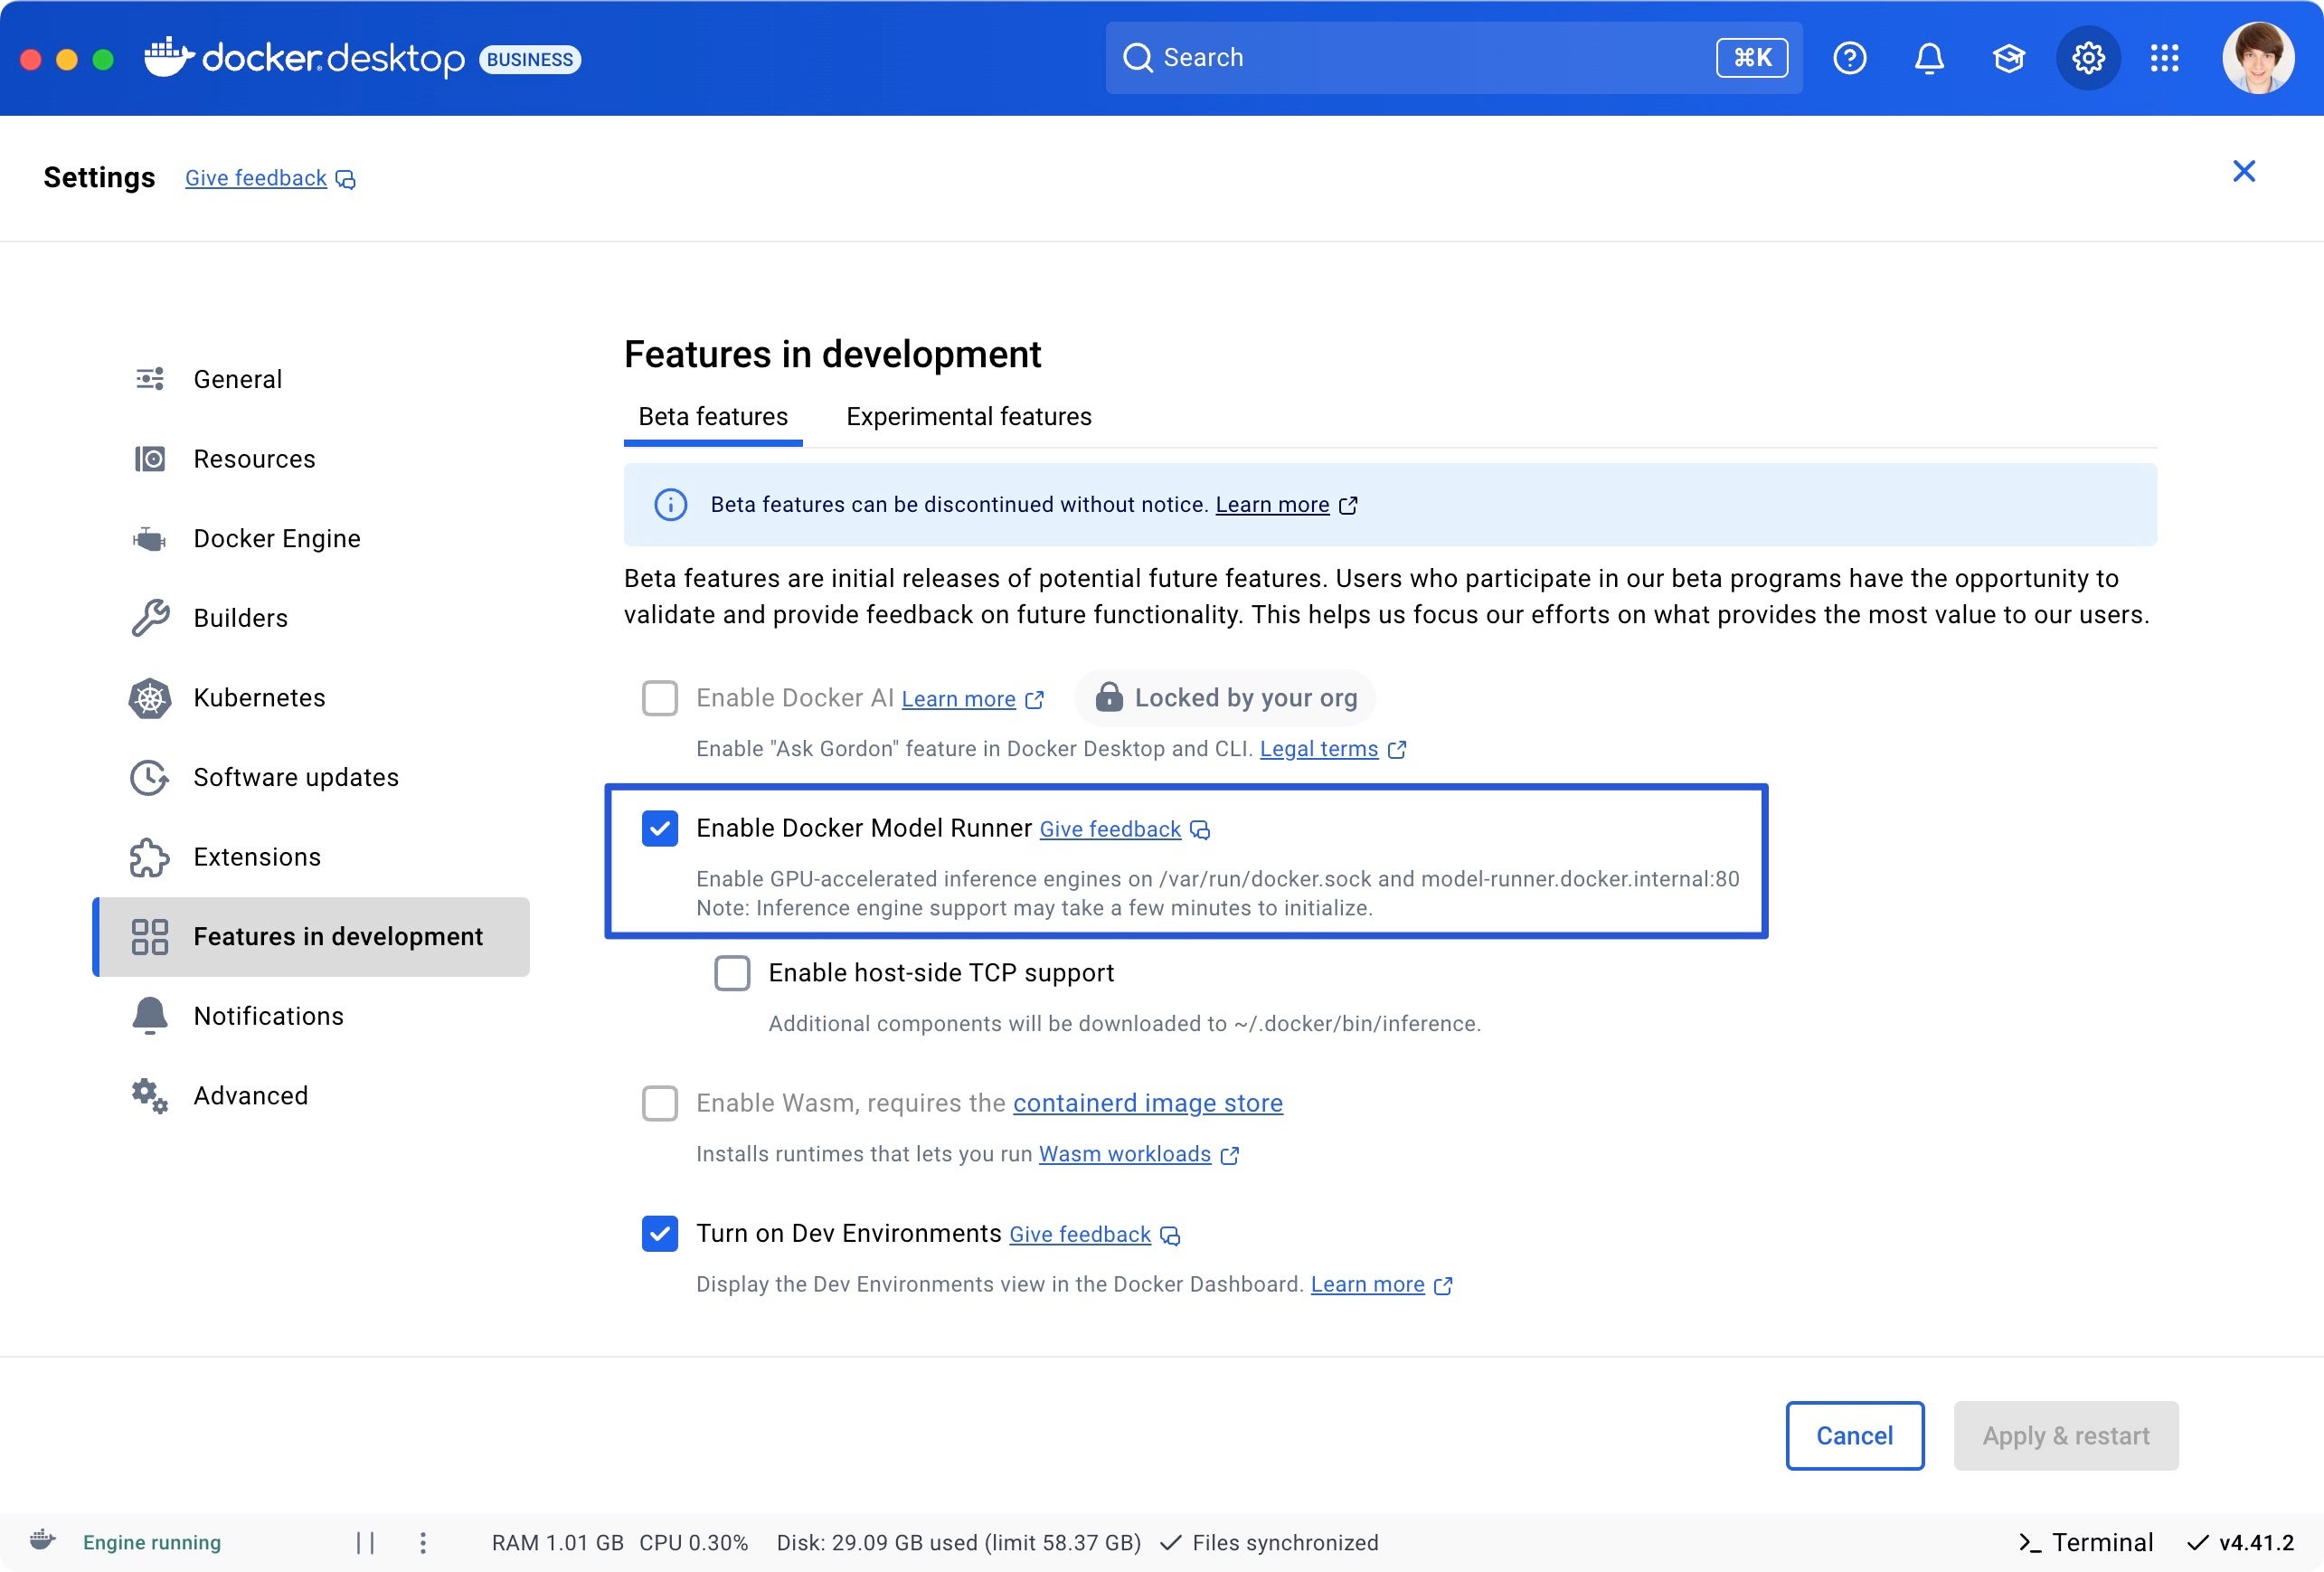
Enable Docker Model Runner in Docker Desktop:

Go to Settings > Features in Development > Beta tab

Enable “Docker Model Runner”

Select “Apply and restart”

Figure 3: Screenshot of Docker Desktop Beta Features settings panel with Docker AI, Docker Model Runner, and TCP support enabled.

Download the model

For this demo, we’ll use Llama 3.2, but you can substitute any model of your choice:

docker model pull ai/llama3.2:1B-Q8_0

Just like viewing containers, you can manage your downloaded AI models directly in Docker Dashboard under the Models section. Here you can see model details, storage usage, and manage your local AI model library.

Figure 4: View of Docker Dashboard showing locally downloaded AI models with details like size, parameters, and quantization.

Start the application: 

docker compose up -d –build

Figure 5: List of active running containers in Docker Dashboard, including Jaeger, Prometheus, backend, frontend, and genai-model-runner-metrics.

Open your browser and navigate to the frontend URL at http://localhost:3000 . You’ll be greeted with a modern chat interface (see screenshot) featuring: 

Clean, responsive design with dark/light mode toggle

Message input area ready for your first prompt

Model information displayed in the footer

Figure 6: GenAI chatbot interface showing live metrics panel with input/output tokens, response time, and error rate.

Click on Expand to view the metrics like:

Input tokens

Output tokens

Total Requests

Average Response Time

Error Rate

Figure 7: Expanded metrics view with input and output tokens, detailed chat prompt, and response generated by Llama 3.2 model.

Grafana allows you to visualize metrics through customizable dashboards. Click on View Detailed Dashboard to open up Grafana dashboard.

Figure 8: Chat interface showing metrics dashboard with prompt and response plus option to view detailed metrics in Grafana.

Log in with the default credentials (enter “admin” as user and password) to explore pre-configured AI performance dashboards (see screenshot below) showing real-time metrics like tokens per second, memory usage, and model performance. 

Select Add your first data source. Choose Prometheus as a data source. Enter “http://prometheus:9090” as Prometheus Server URL. Scroll down to the end of the site and click “Save and test”. By now, you should see “Successfully queried the Prometheus API” as an acknowledgement. Select Dashboard and click Re-import for all these dashboards.

By now, you should have a Prometheus 2.0 Stats dashboard up and running.

Figure 9: Grafana dashboard with multiple graph panels monitoring GenAI chatbot performance, displaying time-series charts for memory consumption, processing speeds, and application health

Prometheus allows you to collect and store time-series metrics data. Open the Prometheus query interface http://localhost:9091 and start typing “genai” in the query box to explore all available AI metrics (as shown in the screenshot below). You’ll see dozens of automatically collected metrics, including tokens per second, latency measurements, and llama.cpp-specific performance data. 

Figure 10: Prometheus web interface showing dropdown of available GenAI metrics including genai_app_active_requests and genai_app_token_latency

Jaeger provides a visual exploration of request flows and performance bottlenecks. You can access it via http://localhost:16686

Implementation details

Let’s explore how the key components of the project work:

Frontend implementation

The React frontend provides a clean, responsive chat interface built with TypeScript and modern React patterns. The core App.tsx component manages two essential pieces of state: dark mode preferences for user experience and model metadata fetched from the backend’s health endpoint. 

When the component mounts, the useEffect hook automatically retrieves information about the currently running AI model. It displays details like the model name directly in the footer to give users transparency about which LLM is powering their conversations.

// Essential App.tsx structure
function App() {
const [darkMode, setDarkMode] = useState(false);
const [modelInfo, setModelInfo] = useState<ModelMetadata | null>(null);

// Fetch model info from backend
useEffect(() => {
fetch('http://localhost:8080/health')
.then(res => res.json())
.then(data => setModelInfo(data.model_info));
}, []);

return (
<div className="min-h-screen bg-white dark:bg-gray-900">
<Header toggleDarkMode={() => setDarkMode(!darkMode)} />
<ChatBox />
<footer>
Powered by Docker Model Runner running {modelInfo?.model}
</footer>
</div>
);
}

The main App component orchestrates the overall layout while delegating specific functionality to specialized components like Header for navigation controls and ChatBox for the actual conversation interface. This separation of concerns makes the codebase maintainable while the automatic model info fetching demonstrates how the frontend seamlessly integrates with the Docker Model Runner through the Go backend’s API, creating a unified user experience that abstracts away the complexity of local AI model execution.

Backend implementation: Integration with Model Runner

The core of this application is a Go backend that communicates with Docker Model Runner. Let’s examine the key parts of our main.go file:

client := openai.NewClient(
option.WithBaseURL(baseURL),
option.WithAPIKey(apiKey),
)

This demonstrates how we leverage Docker Model Runner’s OpenAI-compatible API. The Model Runner exposes endpoints that match OpenAI’s API structure, allowing us to use standard clients. Depending on your connection method, baseURL is set to either:

http://model-runner.docker.internal/engines/llama.cpp/v1/ (for Docker socket)

http://host.docker.internal:12434/engines/llama.cpp/v1/ (for TCP)

How metrics flow from host to containers

One key architectural detail worth understanding: llama.cpp runs natively on your host (via Docker Model Runner), while Prometheus and Grafana run in containers. Here’s how they communicate:

The Backend as Metrics Bridge:

Connects to llama.cpp via Model Runner API (http://localhost:12434)

Collects performance data from each API call (response times, token counts)

Calculates metrics like tokens per second and memory usage

Exposes all metrics in Prometheus format at http://backend:9090/metrics

Enables containerized Prometheus to scrape metrics without host access

This hybrid architecture gives you the performance benefits of native model execution with the convenience of containerized observability.

LLama.cpp metrics integration

The project provides detailed real-time metrics specifically for llama.cpp models:

Metric

Description

Implementation in Code

Tokens per Second

Measure of model generation speed

LlamaCppTokensPerSecond in metrics.go

Context Window Size

Maximum context length in tokens

LlamaCppContextSize in metrics.go

Prompt Evaluation Time

Time spent processing input prompt

LlamaCppPromptEvalTime in metrics.go

Memory per Token

Memory efficiency measurement

LlamaCppMemoryPerToken in metrics.go

Thread Utilization

Number of CPU threads used

LlamaCppThreadsUsed in metrics.go

Batch Size

Token processing batch size

LlamaCppBatchSize in metrics.go

One of the most powerful features is our detailed metrics collection for llama.cpp models. These metrics help optimize model performance and identify bottlenecks in your inference pipeline.

// LlamaCpp metrics
llamacppContextSize = promautoFactory.NewGaugeVec(
prometheus.GaugeOpts{
Name: "genai_app_llamacpp_context_size",
Help: "Context window size in tokens for llama.cpp models",
},
[]string{"model"},
)

llamacppTokensPerSecond = promautoFactory.NewGaugeVec(
prometheus.GaugeOpts{
Name: "genai_app_llamacpp_tokens_per_second",
Help: "Tokens generated per second",
},
[]string{"model"},
)

// More metrics definitions…

These metrics are collected, processed, and exposed both for Prometheus scraping and for real-time display in the front end. This gives us unprecedented visibility into how the llama.cpp inference engine is performing.

Chat implementation with streaming

The chat endpoint implements streaming for real-time token generation:

// Set up streaming with a proper SSE format
w.Header().Set("Content-Type", "text/event-stream")
w.Header().Set("Cache-Control", "no-cache")
w.Header().Set("Connection", "keep-alive")

// Stream each chunk as it arrives
if len(chunk.Choices) > 0 && chunk.Choices[0].Delta.Content != "" {
outputTokens++
_, err := fmt.Fprintf(w, "%s", chunk.Choices[0].Delta.Content)
if err != nil {
log.Printf("Error writing to stream: %v", err)
return
}
w.(http.Flusher).Flush()
}

This streaming implementation ensures that tokens appear in real-time in the user interface, providing a smooth and responsive chat experience. You can also measure key performance metrics like time to first token and tokens per second.

Performance measurement

You can measure various performance aspects of the model:

// Record first token time
if firstTokenTime.IsZero() && len(chunk.Choices) > 0 &&
chunk.Choices[0].Delta.Content != "" {
firstTokenTime = time.Now()

// For llama.cpp, record prompt evaluation time
if strings.Contains(strings.ToLower(model), "llama") ||
strings.Contains(apiBaseURL, "llama.cpp") {
promptEvalTime := firstTokenTime.Sub(promptEvalStartTime)
llamacppPromptEvalTime.WithLabelValues(model).Observe(promptEvalTime.Seconds())
}
}

// Calculate tokens per second for llama.cpp metrics
if strings.Contains(strings.ToLower(model), "llama") ||
strings.Contains(apiBaseURL, "llama.cpp") {
totalTime := time.Since(firstTokenTime).Seconds()
if totalTime > 0 && outputTokens > 0 {
tokensPerSecond := float64(outputTokens) / totalTime
llamacppTokensPerSecond.WithLabelValues(model).Set(tokensPerSecond)
}
}

These measurements help us understand the model’s performance characteristics and optimize the user experience.

Metrics collection

The metrics.go file is a core component of our observability stack for the Docker Model Runner-based chatbot. This file defines a comprehensive set of Prometheus metrics that allow us to monitor both the application performance and the underlying llama.cpp model behavior.

Core metrics architecture

The file establishes a collection of Prometheus metric types:

Counters: For tracking cumulative values (like request counts, token counts)

Gauges: For tracking values that can increase and decrease (like active requests)

Histograms: For measuring distributions of values (like latencies)

Each metric is created using the promauto factory, which automatically registers metrics with Prometheus.

Categories of metrics

The metrics can be divided into three main categories:

1. HTTP and application metrics

// RequestCounter counts total HTTP requests
RequestCounter = promauto.NewCounterVec(
prometheus.CounterOpts{
Name: "genai_app_http_requests_total",
Help: "Total number of HTTP requests",
},
[]string{"method", "endpoint", "status"},
)

// RequestDuration measures HTTP request durations
RequestDuration = promauto.NewHistogramVec(
prometheus.HistogramOpts{
Name: "genai_app_http_request_duration_seconds",
Help: "HTTP request duration in seconds",
Buckets: prometheus.DefBuckets,
},
[]string{"method", "endpoint"},
)

These metrics monitor the HTTP server performance, tracking request counts, durations, and error rates. The metrics are labelled with dimensions like method, endpoint, and status to enable detailed analysis.

2. Model performance metrics

// ChatTokensCounter counts tokens in chat requests and responses
ChatTokensCounter = promauto.NewCounterVec(
prometheus.CounterOpts{
Name: "genai_app_chat_tokens_total",
Help: "Total number of tokens processed in chat",
},
[]string{"direction", "model"},
)

// ModelLatency measures model response time
ModelLatency = promauto.NewHistogramVec(
prometheus.HistogramOpts{
Name: "genai_app_model_latency_seconds",
Help: "Model response time in seconds",
Buckets: []float64{0.1, 0.5, 1, 2, 5, 10, 20, 30, 60},
},
[]string{"model", "operation"},
)

These metrics track the LLM usage patterns and performance, including token counts (both input and output) and overall latency. The FirstTokenLatency metric is particularly important as it measures the time to get the first token from the model, which is a critical user experience factor.

3. llama.cpp specific metrics

// LlamaCppContextSize measures the context window size
LlamaCppContextSize = promauto.NewGaugeVec(
prometheus.GaugeOpts{
Name: "genai_app_llamacpp_context_size",
Help: "Context window size in tokens for llama.cpp models",
},
[]string{"model"},
)

// LlamaCppTokensPerSecond measures generation speed
LlamaCppTokensPerSecond = promauto.NewGaugeVec(
prometheus.GaugeOpts{
Name: "genai_app_llamacpp_tokens_per_second",
Help: "Tokens generated per second",
},
[]string{"model"},
)

These metrics capture detailed performance characteristics specific to the llama.cpp inference engine used by Docker Model Runner. They include:

1. Context Size: 

It represents the token window size used by the model, typically ranging from 2048 to 8192 tokens. The optimization goal is balancing memory usage against conversation quality.  When memory usage becomes problematic, reduce context size to 2048 tokens for faster processing

2. Prompt Evaluation Time

It measures the time spent processing input before generating tokens, essentially your time-to-first-token latency with a target of under 2 seconds. The optimization focus is minimizing user wait time for the initial response. If evaluation time exceeds 3 seconds, reduce context size or implement prompt compression techniques.

3. Tokens Per Second

It measures the time spent processing input before generating tokens, essentially your time-to-first-token latency with a target of under 2 seconds. The optimization focus is minimizing user wait time for the initial response. If evaluation time exceeds 3 seconds, reduce context size or implement prompt compression techniques. 

4. Tokens Per Second

It indicates generation speed, with a target of 8+ TPS for good user experience. This metric requires balancing response speed with model quality. When TPS drops below 5, switch to more aggressive quantization (Q4 instead of Q8) or use a smaller model variant. 

5. Memory Per Token

It tracks RAM consumption per generated token, with optimization aimed at preventing out-of-memory crashes and optimizing resource usage. When memory consumption exceeds 100MB per token, implement aggressive conversation pruning to reduce memory pressure. If memory usage grows over time during extended conversations, add automatic conversation resets after a set number of exchanges. 

6. Threads Used

It monitors the number of CPU cores actively processing model operations, with the goal of maximizing throughput without overwhelming the system. If thread utilization falls below 50% of available cores, increase the thread count for better performance. 

7. Batch Size

It controls how many tokens are processed simultaneously, requiring optimization based on your specific use case balancing latency versus throughput. For real-time chat applications, use smaller batches of 32-64 tokens to minimize latency and provide faster response times.

In nutshell, these metrics are crucial for understanding and optimizing llama.cpp performance characteristics, which directly affect the user experience of the chatbot.

Docker Compose: LLM as a first-class service

With Docker Model Runner integration, Compose makes AI model deployment as simple as any other service. One docker-compose.yml file defines your entire AI application:

Your AI models (via Docker Model Runner)

Application backend and frontend

Observability stack (Prometheus, Grafana, Jaeger)

All networking and dependencies

The most innovative aspect is the llm service using Docker’s model provider, which simplifies model deployment by directly integrating with Docker Model Runner without requiring complex configuration. This composition creates a complete, scalable AI application stack with comprehensive observability.

llm:
provider:
type: model
options:
model: ${LLM_MODEL_NAME:-ai/llama3.2:1B-Q8_0}

​​This configuration tells Docker Compose to treat an AI model as a standard service in your application stack, just like a database or web server. 

The provider syntax is Docker’s new way of handling AI models natively. Instead of building containers or pulling images, Docker automatically manages the entire model-serving infrastructure for you. 

The model: ${LLM_MODEL_NAME:-ai/llama3.2:1B-Q8_0} line uses an environment variable with a fallback, meaning it will use whatever model you specify in LLM_MODEL_NAME, or default to Llama 3.2 1B if nothing is set.

Docker Compose: One command to run your entire stack

Why is this revolutionary? Before this, deploying an LLM required dozens of lines of complex configuration – custom Dockerfiles, GPU device mappings, volume mounts for model files, health checks, and intricate startup commands.

Now, those four lines replace all of that complexity. Docker handles downloading the model, configuring the inference engine, setting up GPU access, and exposing the API endpoints automatically. Your other services can connect to the LLM using simple service names, making AI models as easy to use as any other infrastructure component. This transforms AI from a specialized deployment challenge into standard infrastructure-as-code.

Here’s the full compose.yml file that orchestrates the entire application:

services:
backend:
env_file: 'backend.env'
build:
context: .
target: backend
ports:
– '8080:8080'
– '9090:9090' # Metrics port
volumes:
– /var/run/docker.sock:/var/run/docker.sock # Add Docker socket access
healthcheck:
test: ['CMD', 'wget', '-qO-', 'http://localhost:8080/health']
interval: 3s
timeout: 3s
retries: 3
networks:
– app-network
depends_on:
– llm

frontend:
build:
context: ./frontend
ports:
– '3000:3000'
depends_on:
backend:
condition: service_healthy
networks:
– app-network

prometheus:
image: prom/prometheus:v2.45.0
volumes:
– ./prometheus/prometheus.yml:/etc/prometheus/prometheus.yml
command:
– '–config.file=/etc/prometheus/prometheus.yml'
– '–storage.tsdb.path=/prometheus'
– '–web.console.libraries=/etc/prometheus/console_libraries'
– '–web.console.templates=/etc/prometheus/consoles'
– '–web.enable-lifecycle'
ports:
– '9091:9090'
networks:
– app-network

grafana:
image: grafana/grafana:10.1.0
volumes:
– ./grafana/provisioning:/etc/grafana/provisioning
– grafana-data:/var/lib/grafana
environment:
– GF_SECURITY_ADMIN_PASSWORD=admin
– GF_USERS_ALLOW_SIGN_UP=false
– GF_SERVER_DOMAIN=localhost
ports:
– '3001:3000'
depends_on:
– prometheus
networks:
– app-network

jaeger:
image: jaegertracing/all-in-one:1.46
environment:
– COLLECTOR_ZIPKIN_HOST_PORT=:9411
ports:
– '16686:16686' # UI
– '4317:4317' # OTLP gRPC
– '4318:4318' # OTLP HTTP
networks:
– app-network

# New LLM service using Docker Compose's model provider
llm:
provider:
type: model
options:
model: ${LLM_MODEL_NAME:-ai/llama3.2:1B-Q8_0}

volumes:
grafana-data:

networks:
app-network:
driver: bridge

This compose.yml defines a complete microservices architecture for the application with integrated observability tools and Model Runner support:

backend

Go-based API server with Docker socket access for container management

Implements health checks and exposes both API (8080) and metrics (9090) ports

frontend

React-based user interface for an interactive chat experience

Waits for backend health before starting to ensure system reliability

prometheus

Time-series metrics database for collecting and storing performance data

Configured with custom settings for monitoring application behavior

grafana

Data visualization platform for metrics with persistent dashboard storage

Pre-configured with admin access and connected to the Prometheus data source

jaeger

Distributed tracing system for visualizing request flows across services

Supports multiple protocols (gRPC/HTTP) with UI on port 16686

How Docker Model Runner integration works

The project integrates with Docker Model Runner through the following mechanisms:

Connection Configuration:

Using internal DNS: http://model-runner.docker.internal/engines/llama.cpp/v1/

Using TCP via host-side support: localhost:12434

Docker’s Host Networking:

The extra_hosts configuration maps host.docker.internal to the host’s gateway IP

Environment Variables:

BASE_URL: URL for the model runner

MODEL: Model identifier (e.g., ai/llama3.2:1B-Q8_0)

API Communication:

The backend formats messages and sends them to Docker Model Runner

It then streams tokens back to the frontend in real-time

Why this approach excels

Building GenAI applications with Docker Model Runner and comprehensive observability offers several advantages:

Privacy and Security: All data stays on your local infrastructure

Cost Control: No per-token or per-request API charges

Performance Insights: Deep visibility into model behavior and efficiency

Developer Experience: Familiar Docker-based workflow with powerful monitoring

Flexibility: Easy to experiment with different models and configurations

Conclusion

The genai-model-runner-metrics project demonstrates a powerful approach to building AI-powered applications with Docker Model Runner while maintaining visibility into performance characteristics. By combining local model execution with comprehensive metrics, you get the best of both worlds: the privacy and cost benefits of local execution with the observability needed for production applications.

Whether you’re building a customer support bot, a content generation tool, or a specialized AI assistant, this architecture provides the foundation for reliable, observable, and efficient AI applications. The metrics-driven approach ensures you can continuously monitor and optimize your application, leading to better user experiences and more efficient resource utilization.

Ready to get started? Clone the repository, fire up Docker Desktop, and experience the future of AI development — your own local, metrics-driven GenAI application is just a docker compose up away!

Learn more

Read our quickstart guide to Docker Model Runner.

Find documentation for Model Runner.

Subscribe to the Docker Navigator Newsletter.

New to Docker? Create an account. 

Have questions? The Docker community is here to help.

Quelle: https://blog.docker.com/feed/

Introducing Docker Hardened Images: Secure, Minimal, and Ready for Production

From the start, Docker has focused on enabling developers to build, share, and run software efficiently and securely. Today, Docker Hub powers software delivery at a global scale, with over 14 million images and more than 11 billion pulls each month. That scale gives us a unique vantage point into how modern software is built and the challenges teams face in securing it.

That’s why we’ve made security a cornerstone of our platform. From trusted Docker Official Images to SBOM support for transparency, the launch of Docker Scout for real-time vulnerability insights, and a hardened Docker Desktop to secure local development, every investment reflects our commitment to making software supply chain security more accessible, actionable, and developer-first.

Now, we’re taking that commitment even further.

We’re excited to introduce Docker Hardened Images (DHI) — secure-by-default container images purpose-built for modern production environments.

These images go far beyond being just slim or minimal. Docker Hardened Images start with a dramatically reduced attack surface, up to 95% smaller, to limit exposure from the outset. Each image is curated and maintained by Docker, kept continuously up to date to ensure near-zero known CVEs. They support widely adopted distros like Alpine and Debian, so teams can integrate them without retooling or compromising compatibility.

Plus, they’re designed to work seamlessly with the tools you already depend on. We’ve partnered with a range of leading security and DevOps platforms, including Microsoft, NGINX, Sonatype, GitLab, Wiz, Grype, Neo4j, JFrog, Sysdig and Cloudsmith, to ensure seamless integration with scanning tools, registries, and CI/CD pipelines.

What we’re hearing from customers

We talk to teams every day, from fast-moving startups to global enterprises, and the same themes keep coming up.

Integrity is a growing concern: “How do we know every component in our software is exactly what it claims to be—and hasn’t been tampered with?” With so many dependencies, it’s getting harder to answer that with confidence.

Then there’s the attack surface problem. Most teams start with general-purpose base images like Ubuntu or Alpine. But over time, these containers get bloated with unnecessary packages and outdated software, creating more ways in for attackers.

And of course, operational overhead is through the roof. Security teams are flooded with CVEs. Developers are stuck in a loop of patching and re-patching, instead of shipping new features. We’re hearing about vulnerability scanners lighting up constantly, platform teams stretched thin by centralized dependencies, and developers resorting to manual upgrades just to stay afloat. These challenges aren’t isolated — they’re systemic. And they’re exactly what we designed Docker Hardened Images to address.

Inside Docker Hardened Images

Docker Hardened Images aren’t just trimmed-down versions of existing containers — they’re built from the ground up with security, efficiency, and real-world usability in mind. They’re designed to meet teams where they are. Here’s how they deliver value across three essential areas:

Seamless Migration

First, they integrate seamlessly into existing workflows. Unlike other minimal or “secure” images that force teams to change base OSes, rewrite Dockerfiles, or abandon tooling, DHI supports the distributions developers already use, including familiar Debian and Alpine variants. In fact, upgrading to a DHI can be simple. Switching to a hardened image is as simple as updating one line in your Dockerfile:

Flexible customization

Second, they strike the right balance between security and flexibility. Security shouldn’t mean sacrificing usability. DHI supports the customizations teams rely on, including certificates, packages, scripts, and configuration files, without compromising the hardened foundation. You get the security posture you need with the flexibility to tailor images to your environment.

Under the hood, Docker Hardened Images follow a distroless philosophy, stripping away unnecessary components like shells, package managers, and debugging tools that commonly introduce risk. While these extras might be helpful during development, they significantly expand the attack surface in production, slow down startup times, and complicate security management.

By including only the essential runtime dependencies needed to run your application, DHI delivers leaner, faster containers that are easier to secure and maintain. This focused, minimal design leads to up to a 95% reduction in attack surface, giving teams a dramatically stronger security posture right out of the box.

Automated Patching & Rapid CVE Response

Finally, patching and updates are continuous and automated. Docker monitors upstream sources, OS packages, and CVEs across all dependencies. When updates are released, DHI images are rebuilt, subjected to extensive testing, and published with fresh attestations—ensuring integrity and compliance within our SLSA Build Level 3–compliant build system. The result: you’re always running the most secure, verified version—no manual intervention required.

Most importantly, when essential components are built directly from source, allowing us to deliver critical patches faster and remediate vulnerabilities promptly. We patch Critical and High-severity CVEs within 7 days — faster than typical industry response times —and back it all with an enterprise-grade SLA for added peace of mind.

Internal Adoption: Validating Docker Hardened Images in Production Environments

We’ve been using DHI internally across several key projects — putting them to the test in real-world, production environments. One standout example is our internal use of a hardened Node image. 

By replacing the standard Node base image with a Docker Hardened Image, we saw immediate and measurable results: vulnerabilities dropped to zero, and the package count was reduced by over 98%. 

That reduction in packages isn’t just a matter of image size, it directly translates to a smaller attack surface, fewer moving parts to manage, and significantly less overhead for our security and platform teams. This shift gave us a stronger security posture and simplified operational complexity — exactly the kind of outcome we designed DHI to deliver.

Ready to get started?

Docker Hardened Images are designed to help you ship software with confidence by dramatically reducing your attack surface, automating patching, and integrating seamlessly into your existing workflows. Developers stay focused on building. Security teams get the assurance they need.

Looking to reduce your vulnerability count?

We’re here to help. Get in touch with us and let’s harden your software supply chain, together.

Quelle: https://blog.docker.com/feed/

Docker at Microsoft Build 2025: Where Secure Software Meets Intelligent Innovation

This year at Microsoft Build, Docker will blend developer experience, security, and AI innovation with our latest product announcements. Whether you attend in person at the Seattle Convention Center or tune in online, you’ll see how Docker is redefining the way teams build, secure, and scale modern applications.

Docker’s Vision for Developers

At Microsoft Build 2025, Docker’s EVP of Product and Engineering, Tushar Jain, will present the company’s vision for AI-native software delivery, prioritizing simplicity, security, and developer flow. His session will explore how Docker is helping teams adopt AI without complexity and scale confidently from local development to production using the workflows they already trust.

This vision starts with security. Today’s developers are expected to manage a growing number of vulnerabilities, stay compliant with evolving standards, and still ship software on time. Docker helps teams simplify container security by integrating with tools like Microsoft Defender, Azure Container Registry, and AKS. This makes it easier to build secure, production-ready applications without overhauling existing workflows.

This session explores how Docker is streamlining agentic AI development by bringing models and MCP tools together in one familiar environment. Learn how to build agentic AI with your existing workflows and commands. Explore curated AI tools on Docker Hub to get inspired and jumpstart your projects. No steep learning curve is required! With built-in security, access control, and secret management, Docker handles the heavy lifting so you can focus on building smarter, more capable agents.

Don’t miss our follow-up demo session with Principal Engineer Jim Clark. He’ll show how to build an agentic app that uses Docker’s latest AI tools and familiar workflows.

Visit Docker at Booth #400 to see us in action

Throughout the conference, Docker will be live at Booth #400. Drop by for demos, expert walkthroughs, and to try out Docker Hardened Images, Model Runner, and MCP Catalog and Toolkit. Our product, engineering, and DevRel teams will be on-site to answer questions and help you get hands-on.

Party with your fellow Developers at MOPOP

We’re hosting an evening event at one of Seattle’s most iconic pop culture venues to celebrate the launch of our latest tools.

Docker MCP @ MOPOP Date: Monday, May 19Time: 7:00–10:00 PMLocation: Museum of Pop Culture, Seattle

Enjoy live demos, food and drinks, access to Docker engineers and leaders, and private after-hours access to the museum. Space is limited. RSVP now to reserve your spot!

Quelle: https://blog.docker.com/feed/

Securing Model Context Protocol: Safer Agentic AI with Containers

Model Context Protocol (MCP) tools remain primarily in the hands of early adopters, but broader adoption is accelerating. Alongside this growth, MCP security concerns are becoming more urgent. By increasing agent autonomy, MCP tools introduce new risks related to misalignment between agent behavior and user expectations and uncontrolled execution. These systems also present a novel attack surface, creating new software supply chain threats. As a result, MCP adoption raises critical questions about trust, isolation, and runtime control before these systems are integrated into production environments.

Where MCP tools fall short on security

Most of us first experimented with MCP tools by configuring files like the one shown below. This workflow is fast, flexible, and productive, ideal for early experimentation. But it also comes with trade-offs. MCP servers are pulled directly from the internet, executed on the host machine, and configured with sensitive credentials passed as plaintext environment variables. It has been like setting off fireworks in your living room: it’s thrilling, but it’s not very safe.

{
"mcpServers": {
"command": "npx",
"args": [
"-y",
"@org/mcp-server",
"–user", "me"
],
"env": {
"SECRET_API_KEY": "YOUR_API_KEY_HERE"
}
}
}

As MCP tools move closer to production use, they force us to confront a set of foundational questions:

Can we trust the MCP server?

Can we guarantee the right software is installed on the host? Without that baseline, reproducibility and reliability fall apart. How do we verify the provenance and integrity of the MCP server itself? If we can’t trace where it came from or confirm what it contains, we can’t trust it to run safely. Even if it runs, how do we know it hasn’t been tampered with — either before it reached us or while it’s executing?

Are we managing secrets and access securely?

Secret management also becomes a pressing concern. Environment variables are convenient, but they’re not secure. We need ways to safely inject sensitive data into only the runtimes permitted to read it and nowhere else. The same goes for access control. As teams scale up their use of MCP tools, it becomes essential to define which agents are allowed to talk to which servers and ensure those rules are enforced at runtime.

Figure 1: Discussions on not storing secrets in.env on Reddit. Credit: amirshk

How do we detect threats early? 

And then there’s the question of detection. Are we equipped to recognize the kinds of threats that are emerging around MCP tools? From prompt injection to malicious server responses, new attack vectors are already appearing. Without purpose-built tooling and clear security standards, we risk walking into these threats blind. Some recent threat patterns include:

MCP Rug Pull – A malicious MCP server can perform a “rug pull” by altering a tool’s description after it’s been approved by the user.

MCP Shadowing – A malicious server injects a tool description that alters the agent’s behavior toward a trusted service or tool. 

Tool Poisoning – Malicious instructions in MCP tool descriptions, hidden from users but readable by AI models.

What’s clear is that the practices that worked for early-stage experimentation won’t scale safely. As adoption grows, the need for secure, standardized mechanisms to package, verify, and run MCP servers becomes critical. Without them, the very autonomy that makes MCP tools powerful could also make them dangerous.

Why Containers for MCP servers

Developers quickly realized that the same container technology used to deliver cloud-native applications is also a natural fit for safely powering agentic systems. Containers aren’t just about packaging, they give us a controlled runtime environment where we can add guardrails and build a safer path toward adopting MCP servers.

Making MCP servers portable and secure 

Most of us are familiar with how containers are used to move software around, providing runtime consistency and easy distribution. Containers also provide a strong layer of isolation between workloads, helping prevent one application from interfering with another or with the host system. This isolation limits the blast radius of a compromise and makes it easier to enforce least-privilege access. In addition, containers can provide us with verification of both provenance and integrity. This continues to be one of the important lessons from software supply chain security. Together, these properties help mitigate the risks of running untrusted MCP servers directly on the host.

As a first step, we can use what we already know about cloud native delivery and simply distribute the MCP servers in a container. 

{
"mcpServers": {
"mcpserver": {
"command": "docker",
"args": [
"run", "-i", "–rm",
"org/mcpserver:latest",
"–user", "me"
],
"env": {
"SECRET_API_KEY": "YOUR_API_KEY_HERE"
}
}
}
}

But containerizing the server is only half the story. Developers still would need to specify arguments for the MCP server runtime and secrets. If those arguments are misconfigured, or worse, intentionally altered, they could expose sensitive data or make the server unsafe to run. 

In the next section, we’ll cover key design considerations, guardrails, and best practices for mitigating these risks.

Designing secure containerized architectures for MCP servers and clients

Containers provide a solid foundation for securely running MCP servers, but they’re just the beginning. It’s important to consider additional guardrails and designs, such as how to handle secrets, defend against threats, and manage tool selection and authorization as the number of MCP servers and clients increases. 

Secure secrets handling

When these servers require runtime configuration secrets, container-based solutions must provide a secure interface for users to supply that data. Sensitive information like credentials, API keys, or OAuth access tokens should then be injected into only the authorized container runtimes. As with cloud-native deployments, secrets remain isolated and scoped to the workloads that need them, reducing the risk of accidental exposure or misuse.

Defenses against new MCP threats

Many of the emerging threats in the MCP ecosystem involve malicious servers attempting to trick agents and MCP servers into taking actions that conflict with the user’s intent. These attacks often begin with poisoned data flowing from the server to the client.

To mitigate this, it’s recommended to route all MCP client traffic through a single connection endpoint, a MCP Gateway, or a proxy built on top of containers. Think of MCP servers like passengers at an airport: by establishing one centralized security checkpoint (the Gateway), you ensure that everyone is screened before boarding the plane (the MCP client). This Gateway becomes the critical interface where threats like MCP Rug Pull Attacks, MCP Shadowing, and Tool Poisoning can be detected early and stopped. Mitigations include:

MCP Rug Pull: Prevents a server from changing its tool description after user consent. Clients must re-authorize if a new version is introduced.

MCP Shadowing: Detects agent sessions with access to sets of tools with semantically close descriptions, or outright conflicts.

Tool Poisoning: Uses heuristics or signature-based scanning to detect suspicious patterns in tool metadata, such as manipulative prompts or misleading capabilities, that are common in poisoning attacks.

Managing MCP server selection and authorization

As agentic systems evolve, it’s important to distinguish between two separate decisions: which MCP servers are trusted across an environment, and which are actually needed by a specific agent. The first defines a trusted perimeter, determining which servers can be used. The second is about intent and scope — deciding which servers should be used by a given client.

With the number of available MCP servers expected to grow rapidly, most agents will only require a small, curated subset. Managing this calls for clear policies around trust, selective exposure, and strict runtime controls. Ideally, these decisions should be enforced through platforms that already support container-based distribution, with built-in capabilities for storing, managing, and securely sharing workloads, along with the necessary guardrails to limit unintended access.

MCP security best practices

As the MCP spec evolves, we are already seeing helpful additions such as tool-level annotations like readOnlyHint and destructiveHint.  A readOnlyHint can direct the runtime to mount file systems in read-only mode, minimizing the risk of unintentional changes. Networking hints can isolate an MCP from the internet entirely or restrict outbound connections to a limited set of routes. Declaring these annotations in your tool’s metadata is strongly recommended. They can be enforced at container runtime and help drive adoption — users are more likely to trust and run tools with clearly defined boundaries.

We’re starting by focusing on developer productivity. But making these guardrails easy to adopt and test means they won’t get in the way, and that’s a critical step toward building safer, more resilient agentic systems by default.

How Docker helps  

Containers offer a natural way to package and isolate MCP tools, making them easier and safer to run. Docker extends this further with its latest MCP Catalog and Toolkit, streamlining how trusted tools are discovered, shared, and executed.

While many developers know that Docker provides an API for containerized workloads, the Docker MCP Toolkit builds on that by enabling MCP clients to securely connect to any trusted server listed in your MCP Catalog. This creates a controlled interface between agents and tools, with the familiar benefits of container-based delivery: portability, consistency, and isolation.

Figure 2: Docker MCP Catalog and Toolkit securely connects MCP servers to clients by running them in containers

The MCP Catalog, a part of Docker Hub, helps manage the growing ecosystem of tools by letting you identify trusted MCP servers while still giving you the flexibility to configure your MCP clients. Developers can not only decide which servers to make available to any agent, but also scope specific servers to their agents. The MCP Toolkit simplifies this further by exposing any set of trusted MCP servers through a single, unified connection, the MCP Gateway. 

Developers stay in control, defining how secrets are stored and which MCP servers are authorized to access them. Each server is referenced by a URL that points to a fully configured, ready-to-run Docker container. Since the runtime handles both content and configuration, agents interact only with MCP runtimes that are reproducible, verifiable, and self-contained.   These runtimes are tamper-resistant, isolated, and constrained to access only the resources explicitly granted by the user. Since all MCP messages pass through one gateway, the MCP Toolkit offers a single enforcement point for detecting threats before they become visible to the MCP client. 

Going back to the earlier example, our configuration is now a single connection to the Catalog with an allowed set of configured MCP server containers. MCP client sees a managed view of configured MCP servers over STDIO. The result: MCP clients have a safe connection to the MCP ecosystem!

{
"mcpServers": {
"mcpserver": {
"command": "docker",
"args": [
"run", "-i", "–rm",
"alpine/socat", "STDIO", "TCP:host.docker.internal:8811"
],
}
}
}

Summary

We’re at a pivotal point in the evolution of MCP tool adoption. The ecosystem is expanding rapidly, and while it remains developer-led, more users are exploring ways to safely extend their agentic systems. Containers are proving to be the ideal delivery model for MCP tools — providing isolation, reproducibility, and security with minimal friction.

Docker’s MCP Catalog and Toolkit build on this foundation, offering a lightweight way to share and run trusted MCP servers. By packaging tools as containers, we can introduce guardrails without disrupting how users already consume MCP from their existing clients. The Catalog is compatible with any MCP client today, making it easy to get started without vendor lock-in.

Our goal is to support this fast-moving space by making MCP adoption as safe and seamless as possible, without getting in the way of innovation. We’re excited to keep working with the community to make MCP adoption not just easy and productive, but secure by default.

Learn more

Check out the MCP Catalog and Toolkit product launch blog 

Get started with Docker MCP Catalog and Toolkit

Join the webinar for a live technical walkthrough.

Visit our MCP webpage 

Subscribe to the Docker Navigator Newsletter.

New to Docker? Create an account. 

Have questions? The Docker community is here to help.

Quelle: https://blog.docker.com/feed/

Simplifying Enterprise Management with Docker Desktop on the Microsoft Store

We’re excited to announce that Docker Desktop is now available on the Microsoft Store! This new distribution channel enhances both the installation and update experience for individual developers while significantly simplifying management for enterprise IT teams.

This milestone reinforces our commitment to Windows, our most widely used platform among Docker Desktop users. By partnering with the Microsoft Store, we’re ensuring seamless compatibility with enterprise management tools while delivering a more consistent experience to our shared customers.

[Figure 1]: MS Store listing: https://apps.microsoft.com/detail/xp8cbj40xlbwkx?hl=en-GB&gl=GB

Seamless deployment and control for enterprises

For developers:

Automatic Updates: The Microsoft Store handles all update processes automatically, ensuring you’re always running the latest version without manual intervention.

Streamlined Installation: Experience a more reliable setup process with fewer startup errors..

Unified Management: Manage Docker Desktop alongside your other applications in one familiar interface.

For IT administrators:

Native Intune MDM Integration: Deploy Docker Desktop across your organization using Microsoft’s enterprise management tools — Learn how to add Microsoft Store apps via Intune.

Centralized Control: Easily roll out Docker Desktop through the Microsoft Store’s enterprise distribution channels.

Security-Compatible Updates: Updates are handled automatically by the Microsoft Store infrastructure, even in organizations where users don’t have direct store access.

Updates Without Direct Store Access: The native integration with Intune allows automatic updates to function even when users don’t have Microsoft Store access — a significant advantage for security-conscious organizations with restricted environments.

Familiar Workflow: The update mechanism works similarly to winget commands (winget install –id=XP8CBJ40XLBWKX –source=msstore), providing consistency with other enterprise software management.

Why it matters for businesses and developers 

With 99% of enterprise users not running the latest version of Docker Desktop, the Microsoft Store’s automatic update capabilities directly address compliance and security concerns while minimizing downtime. IT administrators can now:

Increase Productivity: Developers can focus on innovation instead of managing installations.

Improve Operational Efficiency: Better control over Docker Desktop deployments reduces IT bottlenecks.

Enhance Compliance: Automatic updates and secure installations support enterprise security protocols.

Conclusion

Docker Desktop’s availability on the Microsoft Store represents a significant step forward in simplifying how organizations deploy and maintain development environments. By focusing on seamless updates, reliability, and enterprise-grade management, Docker and Microsoft are empowering teams to innovate with greater confidence.

Ready to try it out? Download Docker Desktop from the Microsoft Store today!

Learn more

Docker Desktop on Microsoft Store

Learn how to add Microsoft Store apps via Intune

Configure Microsoft Store access

Authenticate and update to receive your subscription level’s newest Docker Desktop features

New to Docker? Create an account 

Subscribe to the Docker Newsletter

Quelle: https://blog.docker.com/feed/