Building AI agents made easy with Goose and Docker
Building AI agents can be a complex task. But it also can be a fairly simple combination of answers to the following questions:
What is the AI backend that powers my intelligent fuzzy computation?
What tools do you need to give to the AI to access external systems or execute predefined software commands?
What is the application that wraps these together and provides the business logic for the agent (like when you’re building a marketing agent, what makes it know more about marketing or your particular use-cases than a generic chat-GPT model)?
A very popular way to build agents currently is to extend AI assistants or chatbots with the business logic as “system prompts” or configurable profile instructions (which we’ll show later), and tools via the MCP protocol.
In this article, we will look at an example of how you can build an agent like this (with a toy functionality of summarizing YouTube videos) with open source tools. We’re going to run everything in containers for isolation and repeatability. We’re going to use Docker Model Runner for running LLMs locally, so your agent processes stuff privately.
You can find the project in the repository on GitHub: https://github.com/shelajev/hani.
We’re going to use Goose as our agent and Docker MCP gateway for accessing the MCP tools.
In general, hani (goose in Estonian, today you learned!) is a multi-component system defined and orchestrated by Docker Compose.
Here is a brief description of the components used. All in all, this is a bit of a hack, but I feel it’s a very interesting setup, and even if you don’t use it for building agents, learning about the technologies used might come useful one day.
Component
Function
Goose
The AI agent responsible for task execution. It is configured to use the local LLM for reasoning and the MCP Gateway for tool access.
Docker Model Runner
Runs a local LLM inference engine on the host. It exposes an OpenAI-compatible API endpoint (e.g., http://localhost:12434) that the Goose agent connects to.
MCP Gateway
A proxy that aggregates and isolates external MCP tools in their own containers. It provides a single, authenticated endpoint for the agent, mitigating security risks like command injection.
ttyd
A command-line utility that serves the container’s terminal, running the Goose CLI, as a web application accessible via a browser.
Cloudflare Quick Tunnel
(Optional) Creates a secure public URL for the local ttyd service, enabling remote access or collaboration without firewall configuration.
Implementation Details
The environment is defined by two primary configuration files: a Dockerfile to build the agent’s image and a compose.yml to orchestrate the services.
Let’s look at the Dockerfile first; it creates a container image for the hani service with all necessary dependencies and configures Goose for us.
After installing the dependencies, there are a few lines that I want to emphasize:
RUN wget -O /tmp/ttyd.x86_64 https://github.com/tsl0922/ttyd/releases/download/1.7.7/ttyd.x86_64 &&
chmod +x /tmp/ttyd.x86_64 &&
mv /tmp/ttyd.x86_64 /usr/local/bin/ttyd
Installs ttyd. It’s super convenient if you need a Docker image with a CLI application, but want a browser based experience.
RUN wget -qO- https://github.com/block/goose/releases/download/stable/download_cli.sh | CONFIGURE=false bash &&
ls -la /root/.local/bin/goose &&
/root/.local/bin/goose –version
This snippet installs Goose. If you like to live on the edge, you can add CANARY=true and get the unstable but latest and greatest version.
Note that we are also disabling CONFIGURE, because we’ll configure Goose by supplying a pre-made configuration file with the next two lines in the Dockerfile:
COPY config.yaml /root/.config/goose/config.yaml
RUN chmod u-w /root/.config/goose/config.yaml
We do the same with .goosehints, which is the file goose will read and take into account the instructions in it (with the developer extension enabled). We use this to supply business logic to our agent.
COPY .goosehints /app/.goosehints
The rest is pretty straightforward, the only thing we need to remember is that we’re running ttyd running goose and not the latter directly.
ENTRYPOINT ["ttyd", "-W"]
CMD ["goose"]
Now would be a great time to look at the config for Goose, but in order to glue the pieces together, we need to define the pieces, so first we need to explore the compose file.
The compose.yml file defines and connects the stack’s services using Docker Compose.
Let’s look at the compose.yml file starting with the models section:
models:
qwen3:
# pre-pull the model when starting Docker Model Runner
model: hf.co/unsloth/qwen3-30b-a3b-instruct-2507-gguf:q5_k_m
context_size: 16355
First of all, we define the model we’ll use as the brain of the operations. If it’s available in the Docker Model Runner locally, it’ll load it on demand for serving requests. If it’s not a model you used before, it will be automatically pulled from Docker Hub, HuggingFace, or your OCI artifact registry. This can take a bit of time, as even the small models are considerably large downloads, so you can prepare beforehand by running:
docker model pull $MODEL_NAME
Now the tools part. MCP gateway is a “normal” application running in a container, so we pull it in by defining a “service” and specifying the correct Docker Image:
mcp-gateway:
image: docker/mcp-gateway:latest
use_api_socket: true
command:
– –transport=sse
– –servers=youtube_transcript
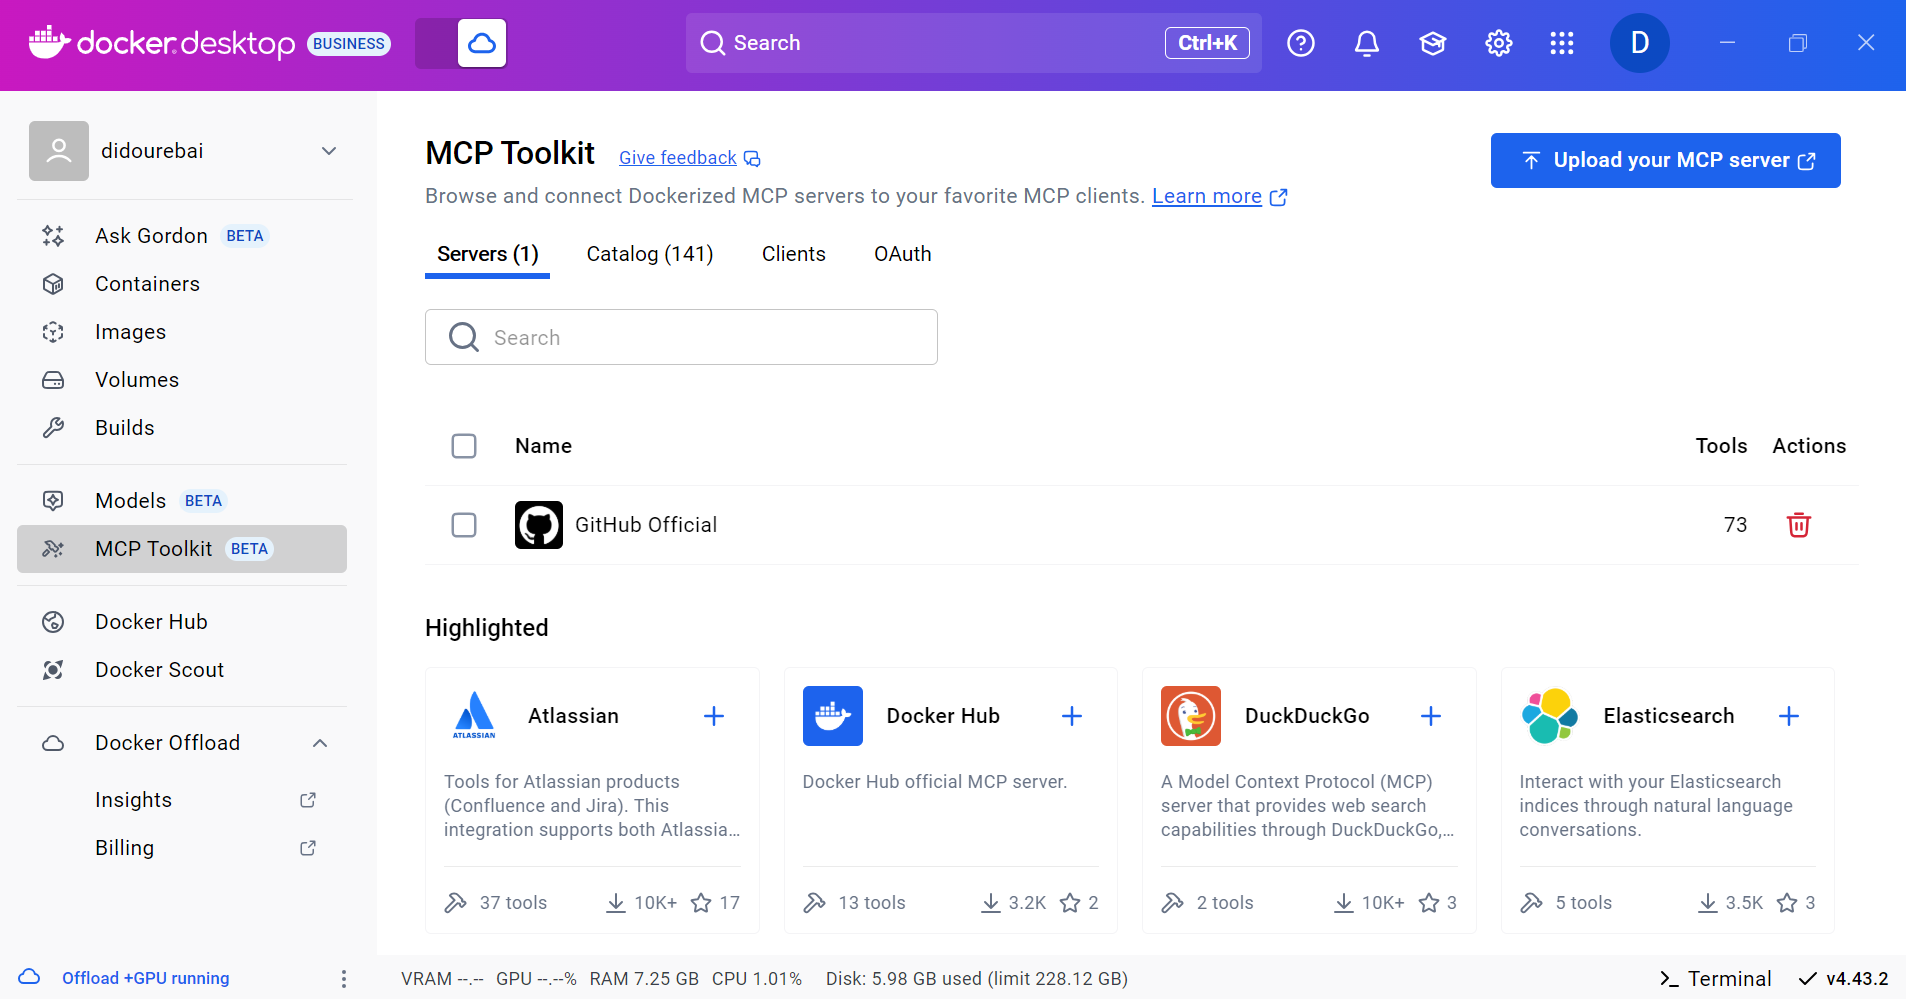
We instruct it to be available as an SSE MCP server itself, and tell it which MCP servers to enable for the current deployment. The MCP toolkit catalog contains more than a hundred useful MCP servers. This is a toy example, so we enable a toy MCP server for pulling YouTube video transcripts.
Now with the dependencies figured out, our main application is built from the local project context and specifies the GOOSE_MODEL env variable to be the actual model we load in the Docker Model Runner:
hani:
build:
context: .
ports:
– "7681:7681"
depends_on:
– mcp-gateway
env_file:
– .env
models:
qwen3:
model_var: GOOSE_MODEL
Simple enough, right? Now the trick is to also configure Goose in the container to use all these services. Remember we copied the config.yaml into the container? That’s the job of that file.
First, we configure the extensions:
extensions:
developer:
display_name: null
enabled: true
name: developer
timeout: null
type: builtin
mcpgateway:
bundled: false
description: 'Docker MCP gateway'
enabled: true
name: mcpgateway
timeout: 300
type: sse
uri: http://mcp-gateway:8811/sse
MCP gateway one will connect to the mcp-gateway:8811/sse url, which is where according to the compose file, the MCP gateway will be running. The developer extension is built in with some useful tools, but it also enables .goosehints support for us.
The only thing left is to connect the brains:
GOOSE_PROVIDER: openai
OPENAI_BASE_PATH: engines/llama.cpp/v1/chat/completions
OPENAI_HOST: http://model-runner.docker.internal
We configure Goose to connect to the OpenAI API compatible endpoint that Docker Model Runner exposes. Note that since we’re running Goose in a container, we don’t go via the host TCP connection (localhost:12434 you could have seen in other tutorials), but via the Docker VM internal url: model-runner.docker.internal
That’s it!
Well if you want to show off the cool agent you built to a friend, you can also include the compose-cloudflare.yml into the setup, which will create a web tunnel from a random URL at cloudflare to your local hani container port 7681 where ttyd is running:
cloudflared:
image: cloudflare/cloudflared
command: tunnel –url hani:7681
depends_on:
– hani
If you have a Docker Desktop with a Docker Model Runner enabled, you can now run the whole setup with a single compose command.
docker compose up –build
or if you want to include the tunnel and expose your Goose to the internet:
docker compose -f compose.yml -f compose-cloudflare.yml up –build
Now opening http://localhost:7681 (or the Cloudflare url the container prints int the logs) will give you the Goose session in the browser:
And it can use tools, for example if you ask it something like:
what is this video about: https://youtu.be/X0PaVrpFD14? answer in 5 sentences
You can see a tool call, and a sensible answer based on the transcript of the video:
One of the best things about this setup is that the architecture is modular and designed for extension:
Model Swapping: The LLM can be changed by modifying the model definition in the compose.yml to any other GGUF model available on Docker Hub or Hugging Face.
Adding Tools: New capabilities can be added by defining additional servers for the MCP gateway or wiring up standalone MCP servers and editing the Goose config.
Adding business logic is just editing the goosehints file and rerunning the setup. Everything is in containers, so everything is contained and ephemeral.
Agent framework: The similar setup can be reconfigured to run other agentic frameworks (e.g., LangGraph, CrewAI) that are compatible with an OpenAI-compatible API, as the underlying platform (DMR, MCP Gateway, compose) is framework-agnostic.
Conclusion
In this article we looked at how you can build a private AI agent running locally in Docker containers in the most straightforward way, integrating Goose AI assistant, Docker MCP Gateway, and running local AI models with Docker Model Runner.
All these technologies are open source, so the recipe can be used for creating your workflow agents easily. While the sample agent doesn’t do anything particularly useful, and its functionality is limited to being a chat and transcribing videos from YouTube, it’s a minimal enough starting point that you can take it into any direction.
Clone the repo, edit the goosehints file, add your favorite MCP servers to the config, run docker compose up and you’re good to go.
Which tasks are you building agents for? Tell me, I’d love to know: https://www.linkedin.com/in/shelajev/.
Quelle: https://blog.docker.com/feed/