Run code samples directly in the Google Cloud documentation

We’re excited to announce a new documentation feature that lets you run code samples in Cloud Shell, without leaving the page. Sign in to your Google account, open Cloud Shell’s online terminal in the documentation, and run code as you’re reading about it:This new feature makes it easier to explore Google Cloud by putting Cloud Shell at your fingertips. Now you don’t need to switch between the documentation and a terminal window to run the commands in a tutorial. The documentation has everything you need to try new products and services.Cloud Shell even has common command-line tools and programming languages already installed, so you don’t need to track down libraries or deal with dependencies. Your development environment is always ready to use and up to date—just activate Cloud Shell and get started.Activate Cloud ShellCloud Shell is available throughout our documentation set on Chrome desktop browsers (Version 74 or higher). To use Cloud Shell in the documentation, sign in and click the Activate Cloud Shell button at the top of the page.When Cloud Shell is activated, you see a terminal at the bottom of the page. Select a Google Cloud project to use Cloud APIs and access your resources:Get started fastCloud Shell has the Cloud SDK already installed, so you can get started right away—no setup required. After you activate Cloud Shell and set a Cloud project, you can use tools like gcloud to try new services as you read about them.For example, you can use the terminal in the documentation to complete a Pub/Sub quickstart in seconds:The terminal stays open when you go to a new page, so it’s easy to learn more and build solutions. When you’re done with the Pub/Sub quickstart, use your resources to create an app that authenticates mobile clients:Manage resourcesLet’s say that you deployed a web app and now you’re onboarding a team member to manage it. You want to grant access to your resources, so you’re looking for commands that update the project’s permissions.The terminal in the documentation makes this easy. List your Pub/Sub topics as you search for commands in the gcloud reference, and then set an IAM policy on a Pub/Sub topic as you read a guide about granting access to resources.Keep developingIf you’re using Cloud Client Libraries, you can customize and run sample code in the Cloud Shell Editor. To use it, activate Cloud Shell and click Open Editor:The button opens the Cloud Shell Editor in a new tab. The online code editor has rich language support, local emulators, and more features that make it easy to build solutions with your favorite client library.Try it outWe hope that the terminal in the documentation makes it easier to learn about Google Cloud and manage your resources. Not sure where to start? Activate Cloud Shell on these pages:Getting started with Cloud StorageGetting started with our BigQueryDeploying a containerized web applicationRelated ArticleTry a tutorial in the Google Cloud ConsoleYou can follow tutorials and walkthroughs in the Google Cloud Console, allowing you to view the instructions and the console at the same …Read Article
Quelle: Google Cloud Platform

Just released: The Google Cloud Next session catalog is live. Build your custom playlists.

There’s less than one month to go until Google Cloud Next, October 12–14, 2021, and we can’t wait for you to join our free flagship event. The full event catalog is now live, so you can discover the content that’s best for you. Explore live, expert-led Q&As, join breakout sessions, immersive demos, and hear real-world use cases for Google Cloud. This year, you can also personalize your experience by building custom playlists, and set reminders and calendar notifications to make sure you don’t miss out.Join us at Next ’21 to hear about the present – and future – of the cloud. From industry-leading data and analytics to optimization and modernization to security and sustainability, learn how we’re expanding the world’s largest private network to make Google Cloud even more open, fast, flexible, and reliable. You can choose from more than 130 sessions across 11 tracks and filter it all by track, session category, and more – and bookmark your favorites for future viewing. Each day, you can watch a live broadcast and keynote with industry leaders like Google Cloud CEO Thomas Kurian and Google Cloud SVP of Technical Infrastructure Urs Hölzle. Speaking of sessions, check out a sneak preview of what’s in store:Data cloud: Simply transform with a universal data platformIs your enterprise data spread across databases, data lakes, data warehouses, or multiple clouds? Bring it all together to innovate faster and improve the customer experience. Explore best practices for unifying your company’s data with help from BigQuery, Cloud Spanner, Looker, and Vertex AI.Developer platform state of the union: Google WorkspaceJoin the developers behind Google Workspace as they reveal the latest technical features available in our suite of productivity and collaboration tools, including add-ons, Google Chat apps, APIs, and Google Meet integration.Data analytics strategy and roadmap: Turn data into differentiating featuresLooking to use data to offer more value to your customers? Learn how to apply decision intelligence to your business processes, and hear how other organizations transform data into action with Google Cloud data analytics solutions.What’s new and what’s next with infrastructure for AI and MLDiscover this year’s developments in artificial intelligence (AI) and machine learning (ML), and explore how to supercharge your workloads using the latest innovations in hardware accelerators like Cloud GPUs and our purpose-built Cloud TPUs.Transform your business operations with no-code appsAnyone can build an app. Don’t believe us? Learn how Product Manager Paula Bell, self-described as someone with “absolutely zero coding experience,” used AppSheet to build mission-critical apps that revolutionized how electric utility company Kentucky Power runs their field operations – and how you can use it to add AI and ML to your apps.Be sure to monitor our Twitter feed for personal playlists from cloud experts and executives, and build and share your own with friends and colleagues with the playlist builder.Get informed, be inspired, and expand your expertise. Register today and build your personal Next ’21 experience.Related ArticleNext OnAir as it happens: All the announcements in one placeWe’ll be sharing lots of news, updates, and learning opportunities throughout Next OnAir. Check back here to see a running list of what’s…Read Article
Quelle: Google Cloud Platform

Provisioning Cloud Spanner using Terraform

OverviewCloud Spanner is a fully managed relational database built for scale with strong consistency and up to 99.999% availability. Key features include the following: ACID transactions, SQL queries (ANSI 2011 with extensions) and global scale.Automatic sharding – optimizes performance by automatically sharding the data based on request load and size of the data.Fully managed – Synchronous replication and maintenance are handled automatically.Flexible configurations- Depending on the workload, Cloud Spanner instances can be provisioned as either regional or multi-regional (spanning one continent or three continents).Online schema Changes – Cloud Spanner users can make a schema change, whether it’s adding a column or adding an index, while serving traffic with zero downtime.In this blog post, we will talk about how to deploy a sample application on Cloud Run with a Cloud Spanner backend using Terraform templates. We will also learn how to manage a production-grade Cloud Spanner instance using Terraform, by starting with a small instance and scaling up by adding more nodes or processing units.Terraform for Cloud Spanner What is Terraform?Terraform is a popular open-source infrastructure-as-code tool developed by HashiCorp, that provides a consistent CLI to manage hundreds of cloud services. It codifies cloud APIs into declarative configuration files. Terraform allows you to declare an entire GCP environment as code, which can then be version-controlled.Benefits of using Terraform with Cloud SpannerTerraform is very useful for provisioning scalable Cloud Spanner instances and databases in real-world, production environments. It allows for easier configuration management and version control and enables repeatability across regions and projects.Organizations using Terraform to manage their cloud infrastructure today can easily include Cloud Spanner into their existing infrastructure-as-code framework. The Cloud Spanner with Terraform codelab offers an excellent introduction to the provisioning of instances, creating and modifying databases, and scaling a Cloud Spanner instance with more nodes. The codelab is a great way to get started. In the next few paragraphs, we discuss a few details that go beyond what we cover in the codelab.Specifying a regional configurationCloud Spanner instances can be launched either regionally or in a multi-region. Take a look at Instances in the official documentation (under “regional configurations” and “multi-region configurations”) for a list of the configuration options available.For regional instances, add the “regional-” prefix to the instance names in the list below. Example: to provision an instance in Montreal, your Terraform  template will have  config = “regional-northamerica-northeast1″screenshot from: Google Cloud DocumentationFor multi-region instances, you can use the region name as-is from the documentation. Example – asia1 for a one-continent instance in Asia or nam-eur-asia1 for a three-continent instance.  Modifying Cloud Spanner instance propertiesNote that properties such as the amount of compute capacity (via num_nodes or processing_units), display name, and labels can be modified when making changes to an existing Cloud Spanner instance via Terraform. However, changing the instance name (the instance identifier on the GCP console) will result in the cluster being destroyed and recreated.As mentioned above, compute capacity (a.k.a. the instance size) can also be defined in terms of processing_units. For example, the compute capacity defined below would be 1/10th of a node, while a value of 1000 would be one full node.Creating databases and executing DDL commandsFinally, Cloud Spanner Terraform resources also support creating databases and executing DDL as part of the template. The DDL support in the Terraform resource is a useful feature for initializing a database schema for smaller applications. Limitations of Terraform with Cloud SpannerManaging database schemasDatabase schemas tend to change periodically. Terraform has very limited support database schema updates – changes to the DDL, particularly those that are not append-only, will require dropping and re-creating the database. Therefore, we don’t recommend using Terraform to manage the schemas of Cloud Spanner databases. Instead, we recommend using a schema versioning tool like Liquibase.  A Liquibase extension with Cloud Spanner support was released recently under the Cloud Spanner Ecosystem. Here is the official documentation. Deploying a sample appFor demonstration purposes, we’re going to use a sample stock price visualization app called OmegaTrade. This application stores the stock prices in Cloud Spanner and renders visualizations using Google Charts. To learn more about the app and its integration with Cloud Spanner, see this blog post. Now, to the fun part! We will deploy this application to Cloud Run using Terraform templates. We chose Cloud Run because it abstracts away infrastructure management and scales up or down automatically almost instantaneously depending on traffic. Let’s get started!As prerequisites, please ensure that you have:Access to a new or existing GCP project with one of the sets of roles listed below:OwnerEditor + Cloud Run Admin + Storage Admin Cloud Run Admin + Service Usage Admin + Cloud Spanner Admin + Storage AdminEnabled billing on the above GCP project.Installed and initialized the Google Cloud SDK.Installed and configured Docker on your machine.Installed and configured Git on your machine.NOTE – Please ensure that your permissions are not restricted by any organizational policies.We are deploying this application using Cloud Shell. If you are going through these steps on your local machine, and assuming you have already installed the Cloud SDK, you can execute the following command to authenticate.gcloud auth application-default loginChoose your Google account with access to the required GCP project and enter the Project ID when prompted. Next, we need to ensure the gcloud configuration is set up correctly. You may want to start with a new configuration by using the create command. Below, we are enabling authentication, unsetting any API endpoint URL set previously, and setting the GCP project we intend to use in the default gcloud configuration. Replace [Your-Project-ID] below with the ID of your GCP project.Before continuing further, let’s make sure our Terraform version is up to date (we need Terraform version 0.13.1 and above).If needed, you can go to the official Terraform download pageto download and install the latest version.Next, let’s enable Google Cloud APIs for Cloud Spanner, Container Registry, and Cloud Run. Note: you could also use Terraform to accomplish this, instead of running the commands manually.Now, let’s clone the repository that contains Terraform modules for Cloud Run, Cloud Spanner and GCE (for a Cloud Spanner emulator instance, which will be discussed in a future blog post). Take a look at the directory structure below. The examples folder has Cloud Spanner and Cloud Run Terraform examples, with their corresponding Terraform modules located in the modules folder.  Note: By default we have defined the compute capacity in terms of number of nodes in these templates. In case you want to define your compute capacity using processing units instead of nodes, you will need to uncomment the lines of code for processing_units in each of the examples and modules, and comment out the corresponding lines for num_nodes. The two options are mutually exclusive. To find all the relevant files to modify, you can executeNote that as of the time of this writing, the smallest compute capacity available is 100 processing units (or 1/10th of a node).Launch Cloud Spanner We will now launch a single-node Cloud Spanner instance in the us-west1 region. The template also creates a database and the necessary tables for the OmegaTrade application using the DDL specified in the template.Take a look at the terraform.tfvars file to customize the compute capacity, region, and number of nodes or processing units. Enter your GCP project ID (without the square brackets), make any other changes you’d like, and save.In case you want to define your compute capacity using processing units instead of nodes, you can specify a value for spanner_processing_units instead of spanner_nodes and follow the instructions at the end of the previous section. Next, let’s initialize Terraform, and make sure that we have the correct versions of the providers installedAnalyze the execution plan,And apply the changes.Terraform will ask for your confirmation before applying.You should see the Cloud Spanner instance successfully provisioned .Click into the hamburger menu at the top left and select Spanner to verify the outcome on the GCP console. You can find the instance and database created, along with the necessary tables for the OmegaTrade application. The above example provisioned a single node instance in the us-west1 region. If you would like to launch in a different region (different instance configuration) with multiple nodes, simply edit the terraform.tfvars file and set a different instance configuration instead of  spanner_config = “regional-us-west1″.  Deploying the backend to Cloud RunWe are going to be deploying two different services to Cloud Run: omegatrade/frontendand omegatrade/backend.NOTE – Please ensure that your permissions are not restricted by any organizational policies, or you may run into an IAM-related issue at the apply stage later on.Now that the Cloud Spanner instance, database, and tables are in place, let’s build and deploy the backend service to Cloud Run. The frontend has a dependency on the backend URL, so we will start with the backend.In the backend folder, we will create a .env file and insert some seed data into the database we created in the previous section. We begin by setting the gcp-project-id, spanner-instance-id, and spanner-database-id to the appropriate values that we got from the GCP console (omitting the square brackets).Then, we run the following command to populate the seed data.Next, we build the image from the dockerfile and push it to GCR. We will change the commands below to reflect our GCP project ID and run them.We will now go back to the Terraform examples directory and provision the backend service of the OmegaTrade application.Like the Cloud Spanner example you have seen in the previous section, you can quickly edit the terraform.tfvars file to make changes according to your environment and deploy.  Since the Terraform template adds a suffix to the instance name and DB name, you might want to get the exact instance name and database name from the GCP console. The  backend_container_image_path is the same path that you used in the docker push command above.NOTE: In these templates, we follow the standard practice of using variables.tf or tfvars files to define variables and values. This is particularly useful when we have multiple resources with similar configuration, as while upgrading them the values need to be changed in only one place.Here is how my file looks with all the details except the project ID filled in.Next, let’s initialize Terraform and validate the plan.Now, we’re ready to deploy backend service. If you get an IAM-related error at this stage, it is likely because of an organizational policy of the organization that the project is hosted in. You may need to contact your organization admin or start over with a project in a different organization that does not have this restriction.Terraform will ask for your confirmation before applying. You should now see the backend service up and running.Check Cloud Run in the GCP console and locate the new service. Write down its URL. We will use it in the frontend configuration in the next section. Deploying the frontend to Cloud RunBefore we build the frontend service, we need to update the following file from the repo with the backend URL we got from the above step. Change the base URL to the backend URL noted down in the previous section.In the frontend folder, build the frontend service and push the image to GCR.Go to the Terraform example for CloudRun (frontend service).We will now provision the frontend service using the image we pushed to GCR above. Open the terraform.tfvars file and add the GCP project ID and frontend image path.Here is what the file should look like after filling in most of the details.Now, let’s deploy the frontend service.Once again, Terraform will ask for your confirmation before applying. You should now see the frontend service up and running.Check the services on the GCP console.You will now be able to go to the frontend URL and interact with the application! You can interact with existing visualizations or simulate write activity on Cloud Spanner by visiting the Manage Simulations view in the application. Choose an existing company or add a new company, and choose an interval and number of records. Scaling Cloud Spanner using TerraformTo scale the Cloud Spanner instance up or down, go back to the Cloud Spanner Terraform examples folder.We currently have a single node Cloud Spanner instance in the us-west1 region. For production environments, this configuration may not be sufficient. Scaling Cloud Spanner can be achieved using our Terraform template.Take a look at the terraform.tfvars file. We chose a regional instance with 1 node during the initial provisioning, running in the us-west1 region. We can now scale Cloud Spanner to the compute capacity necessary by running a terraform apply once again with an updated node count.  An example .tfvars file to scale the instance is available as terraform.scale.tfvars as shown below. Specify the same instance ID and database name as initially used. Note that the Terraform template randomizes the names of the instance and database by adding a random suffix, but while scaling you just need to use the original names. Edit the terraform.scale.tfvars file with your project IDIn case you defined your compute capacity using processing units instead of nodes, you can follow the same steps to resize it, by specifying an updated value for spanner_processing_units instead of spanner_nodes and commenting/uncommenting the appropriate lines in the script as noted just above the Launch Cloud Spanner section earlier in this post.Apply changes to scale the instance from 1 node to 2 nodes.It may take a few seconds for the changes to take effect. Verify the changes on the GCP consoleConclusionWe have seen how easy it is to provision Cloud Spanner instances and create databases and tables using Terraform using a sample application deployment. We have also seen how to scale Cloud Spanner using Terraform after the initial deployment. Armed with this knowledge, you are ready to try out the code modules in this repository and set up your own Cloud Spanner instances with Terraform.To learn more about using Terraform with Cloud Spanner, visitThe Cloud Spanner documentationThe Terraform documentationThe Terraform with Cloud Spanner CodelabThe Google Cloud Platform Terraform repository on GitHubRelated ArticleMeasuring Cloud Spanner performance for your workloadIn this post, we will explore a middle ground to performance testing using JMeter. Performance test Cloud Spanner for a custom workload b…Read Article
Quelle: Google Cloud Platform

Why representation matters: 6 tips on how to build DEI into your business

Diversity, equity, and inclusion (DEI) are more than buzzwords, they are critical components of workplace culture that have real, tangible impacts on your entire organization. Well-executed and robust DEI initiatives ensure that every single employee feels welcomed and valued when they are at work. And that’s not all—done right, DEI will create a thriving environment that fosters increased engagement, productivity, and ultimately, new innovation.Now, more than ever there is more urgency to incorporate diversity and inclusion into every aspect of your business. Not only because it enhances your ability to be responsive to users and customers, but because it builds trust and a sense of belonging for your employees.So, how do you build a representative workforce and inclusive teams? Read our short eBook to learn steps you can take to build DEI into your business along with insights from our own journey at Google Cloud.Related ArticleRead Article
Quelle: Google Cloud Platform

Chefkoch whips up handwritten recipes in the cloud with text detector

Editor’s note: When German cooking platform Chefkoch was looking to bring treasured hand-me-down recipes into the 21st century it found a scaleable, well-supported solution with Google’s data cloud. Here’s how it was cooked up. Whether it’s salad dressing or chicken soup, most households have a favorite dish passed down across the generations. These recipes are often scribbled on scraps of paper and this personal culinary heritage is heavily guarded. Recognizing the significance of handwritten or printed recipes, German cooking platform Chefkoch wanted to make it possible to quickly and easily parse, extract and digitalize these time-honored tasty morsels using Google Cloud augmented analytics and machine learning (ML) capabilities, to make it easy for users to share and access these recipes in a digital form.When considering the best way to develop the technology, Chefkoch undertook extensive market research of the global food market. It identified best practices within the industry, looked at working business models and upcoming food-tech trends, and applied this to an in-depth study of its own users’ motivations for using its platform. Finally, Chefkoch created a Kano Model that prioritized different features based on how likely they would be to satisfy its users.Chefkoch users each have their own Kochbuch (cookbook) on the platform where they can save, sort, and manage their Chefkoch recipes. On the back of its research, Chefkoch decided that this was the best place for its new proposition. It opted to develop the Kochbuch to make it possible to store any recipe within it, including offline ones. “To do this we needed to extract the text, be it handwritten or printed, and then separate the recipe title, the ingredients and the instructions,” explains Tim Adler, CTO of Chefkoch.APIs get reading recipesTo enable this, Chefkoch began assessing various text importing tools. In May 2021, it settled on Google Cloud’s ML services and  Google Cloud Functions, because it offers scalable functions as a service (FaaS) with a number of APIs that enable code to be run without server management. “We screened the market for solutions in order to recognize text in scanned handwritten recipes,” says Adler. “Google’s solution convinced us, not only because we could work with the APIs and documentation easily, but also because Google’s team presented us with an impressive proof of concept with our own test-data.”Chefkoch chose to build this recipe-reading tool using the Vision and Natural Language services offered by Google Cloud  because it can run across devices and be scaled cost-effectively.  As seen in the diagram above, it uses the Cloud Vision API optical character recognition (OCR) tool, which is optimized for German and English text detection, to extract the text from a written or printed page. It then applies AutoML Natural Language Entity Extraction  Models 1 and 2  and the Cloud Natural Language API to identify and segregate the different sections of the recipes to perfect the resulting on screen recipe, as shown below.Chefkoch worked closely with Google to perfect the solution. Our Google team initially made a demo for Chefkoch to help the team understand how everything works together, demonstrating, for example, how a dataset has to be structured to optimize the desired results after the model training. They presented a working end-to-end demo of a functioning API which takes in the image of a handwritten or printed recipe, and outputs the desired results: with the various components of the recipes cleanly extracted and separated. This offline-to-online recipe upload service is now being trialed on Chefkoch’s Kochbuch. “We are working on testing, improving, extending and producing the solution,” reveals Adler.Tweaking the recipe Results from early-stage testing are encouraging, with users rating the OCR feature with an A or B grade. In response to this feedback, small adjustments have already been made to the training of the model to get it to align with audience needs. The tool, which has been unofficially named the Handwritten Recipe Parser, can now pick up contextual spelling mistakes, for example, where a word is spelled incorrectly for the context, such as “meet” instead of meat.Cooking up users with analog to digital offeringThere are plans to expand the menu of features on Handwritten Recipe Parser too. Chefkoch is now developing a manual recipe extraction solution, where users can upload their own recipe images and add the title, ingredients and method and there are plans to enable users to amend existing Chefkoch recipes by adding their own text and written annotations. To learn more about Cloud AutoML and Vision API, visit our site.Related ArticleBusinesses realize the full value of visual data using Plainsight Vision AI on Google CloudAI startup Plainsight built its Vision AI offering on Google Cloud, enabling companies to extract accurate, actionable insights from vide…Read Article
Quelle: Google Cloud Platform

Run more workloads on Cloud Run with new CPU allocation controls

Cloud Run, Google Cloud’s serverless container platform, offers a very granular pay-per-use pricing, charging you only for CPU and memory when your app processes requests or events. By default, Cloud Run does not allocate CPU outside of request processing. For a class of workloads that expect to do background processing, this can be problematic. So today, we are excited to introduce the ability to allocate CPU for Cloud Run container instances even outside of request processing.This feature unlocks many use cases that weren’t previously compatible with Cloud Run:Executing background tasks and other asynchronous processing work after returning responsesLeveraging monitoring agents like OpenTelemetry that may assume access to CPU in background threadsUsing Go’s Goroutines or Node.js async, Java threads, and Kotlin coroutinesMoving Spring Boot apps that use built-in scheduling/background functionalityListening for Firestore changes to keep an in-memory cache up to dateEven if CPU is always allocated, Cloud Run autoscaling is still in effect, and may terminate container instances if they aren’t needed to handle incoming traffic. An instance will never stay idle for more than 15 minutes after processing a request (unless it is kept active using min instances).Combined with Cloud Run minimum instances, you can even keep a certain number of container instances up and running with full access to CPU resources. Together, these functionalities now enable new background processing use cases like using streaming pull with Cloud Pub/Sub or running a serverless Kafka consumer group.When you opt in to “CPU always allocated”, you are billed for the entire lifetimeof container instances—from when a container is started to when it is terminated. Cloud Run’s pricing is now different when CPU is always allocated: There are no per-request feesCPU is priced 25% lower and memory 20% lower Of course, the Cloud Run free tier still applies, and Committed Use Discounts can give you up to 17% discount for a one-year commitment.How to allocate always-on CPUYou can change your existing Cloud Run service to always have CPU allocated from the Google Cloud Console:or from the command line:gcloud beta run services update SERVICE-NAME –no-cpu-throttlingWe hope this change will allow you to run more workloads on Cloud Run successfully while still benefiting from its low-ops characteristics.To learn more about Cloud Run, check out our getting started guides.Related ArticleMaximize your Cloud Run investments with new committed use discountsCommitted use discounts in Cloud Run enable predictable costs—and a substantial discount!Read Article
Quelle: Google Cloud Platform

Push your code and see your builds happening in your terminal with "git deploy"

If you have used hosting services like Heroku before, you might be familiar with the user workflow where you run “git push heroku main”, and you see your code being pushed, built, and deployed. When your code is received by the remote git server, your build is started. With source-based build triggers in Cloud Build, the same effect happens: you “git push” your code, and this triggers a build. However, you don’t see this happen in the same place you ran your git push command. Could you have just one command that you run to give you that Heroku-like experience? Yes, you can. Introducing git deploy: a small Python script that lets you push your code and see it build in one command. You can get the code here: https://github.com/glasnt/git-deployThis code doesn’t actually do anything; it just shows you what’s already going on in Cloud Build.  Explaining what this code doesn’t do requires some background knowledge about how git works, and how Cloud Build triggers work.git hooksHooks are custom scripts that are launched when various actions occur in git, and come in two categories: client-side, and server-side. You could set up client-side hooks to do, for example lint checks before you write your commit message, by creating a .git/hooks/pre-commit file that runs your linter of choice. For server-side hooks, however, those need to be stored on the server. You can see server-side hooks running when git returns logs with the “remote: ” prefix. Heroku uses server-side hooks to start deployments. GitHub also uses server-side hooks when you push a branch to a repo, returning the link you can use to create a pull request on your branch (for example: remote: Create a pull request for ‘mytopic’ on GitHub by visiting). However, since you as a developer do not have control over GitHub’s git server, you cannot create server-side hooks, so that solution isn’t possible in this instance. Instead, you can extend git on your machine.git extensionsWriting extensions for git is remarkably simple: you don’t actually change git at all, git just finds your script. When you run a command in git, it will first check if the command is one of it’s internal built-in functions. If the command is not built-in, it will check if there is an external command in its ‘namespace’ and run that. Specifically, if there is an executable on your system PATH that starts with “git-” (e.g. git-deploy), it will run that script when you call “git deploy”. This elegance means that you can extend git’s workflow to do anything you want while still ‘feeling’ like you’re in git (because you are. Kinda.)Inspecting Cloud Build in the command lineCloud Build has a rich user interface of its own in the Cloud console, and native integration into services like Cloud Run. But it also has a rich interface in gcloud, the Google Cloud command line. One of those functions is gcloud builds logs –stream, which allows you to view the progress of your build as it happens, much the same as if you were to view the build in the Google Cloud console. You can also use gcloud to list Cloud Build triggers, filtering by it’s GitHub owner, name, and branch. With that unique trigger ID, you can view what builds are currently running, and stream them. You can get the GitHub identifying information by inspecting git’s configured remote origin and branch.Putting it all togetherGiven all the background, we can now explain what the git deploy script does. Based on what folder you are currently in, it detects what branch and remote origin you have configured. It then runs the code push for you. It then checks to see what Cloud Build triggers are connected to that remote origin, and then waits until a build for that trigger has been started. Once it has, it just streams the logs to the terminal. Suffice to say that this script doesn’t actually do anything that’s not already being done, but it just shows you it all happening in the terminal. ✨(The choice to use Python for this script was mostly due to the fact I did not want to have to write regex parsers in bash. And even if I did, it wouldn’t work for users who use other shells. Git extensions can be written in any language, though!)Related ArticleIntegrating Google Cloud Build with JFrog Artifactory[Editor’s note: Today we hear from software artifact management provider JFrog about how and why to use Google Cloud Build in conjunction…Read Article
Quelle: Google Cloud Platform

Why higher ed needs to go all-in on digital: Research from BCG and Google

Why Higher Ed Needs to Go All-in on DigitalIn the wake of the COVID-19 pandemic, the majority of students within the 18-24-year-old demographic now expect hybrid learning environments–even once we are beyond the pandemic. And a vast number of adult learners are seeking options that accommodate their work and family lives now that it’s clear that effective learning can indeed occur virtually. Implementing cloud technologies and achieving digital maturity within higher education will enable institutions to be innovative and responsive to evolving student preferences, while being prepared for future disruptions.The state of digital maturityIn February and March 2021, Boston Consulting Group (BCG), in partnership with Google, surveyed U.S. higher education leaders on their views of the state of digital maturity in the higher education sector. This survey found that institutional and technology leaders strongly agreed that moving legacy IT systems to the cloud, centralizing and integrating data, and increasing the use of advanced analytics is necessary to make a successful digital transformation, and ultimately achieve digital maturity.But what is digital maturity? Digital maturity—a measure of an organization’s ability to create value through digital delivery—focuses on three areas of technological advancement that drive large-scale innovation:Using cloud infrastructureExpanding access to dataUsing that data to improve processes through advanced analytics, such as Artificial Intelligence and Machine Learning (AI/ML)Although university leaders agree on prioritizing digital maturity, more than 55% said they considered their schools to be “digital performers” or “digital leaders.” However, only 25% of tech leaders at these universities stated that their schools regularly use data analytics. As with corporations and governments, higher education institutions face barriers to technological innovation, such as:Competing priorities to meet step-change goals and decentralized decision makingBudget constraintsCultural resistance to changeTech staff skillset gapsStill, leaders understand that the way to overcome institutional inertia is with a strong, goal-oriented vision of what is best for the institution overall. Although only a handful of schools have reached digital maturity as we define it, others can learn a great deal from their examples. Here are the top takeaways from higher education leaders who successfully transformed their institutions:Digital solutions can improve the student journey in many waysAs digital capabilities hold the key to dealing effectively with declining enrollment and rising costs, higher ed leaders identified four goals that are critical to improving performance:Improve the student journeyIncrease operational efficiencyScale computing power in advanced researchInnovate education deliveryThe research found that technology investments can help enhance the student journey in the recruiting and retention of students, improving digital education delivery, government funding, and donations from alumni. Digital maturity can make institutions more agile and efficient in delivering education that aligns with the changing societal norms, evolving student preferences, and future disruptions. Survey participants shared that they plan to increase the use of the cloud by more than 50% over the next three years. By shifting legacy IT systems to the cloud, institutions can increase scalability, lower the cost of ownership, and improve operational agility, while offering a more secure, long-term data storage solution.Cloud-native software-as-a-service (SaaS) solutions provide an excellent platform for centralizing data. However, institutions that attempt to “lift and shift” their legacy systems to the cloud may encounter challenges to achieving measurable improvements in data integration and cost reduction. Higher ed leaders must realize that centralizing data and transitioning to the cloud do not happen simultaneously.Leaders who are able to articulate a strong vision and commitment will experience a more successful technology transformation. By linking their vision to specific needs, such as more effective recruiting, leaders will find their technology investments will have a more substantial return. University presidents should base their decisions about which systems to move, when, and how on desired performance outcomes.Big visions become a reality with small steps. Small pilot projects are an excellent way to start the journey toward digital maturity. Small steps toward a significant transformation can reduce resistance to change, build positive momentum, and produce better student outcomes. Read the full reporthere. If you’d like to talk to a Google Cloud expert, get in touch. 
Quelle: Google Cloud Platform

Scalable ML Workflows using PyTorch on Kubeflow Pipelines and Vertex Pipelines

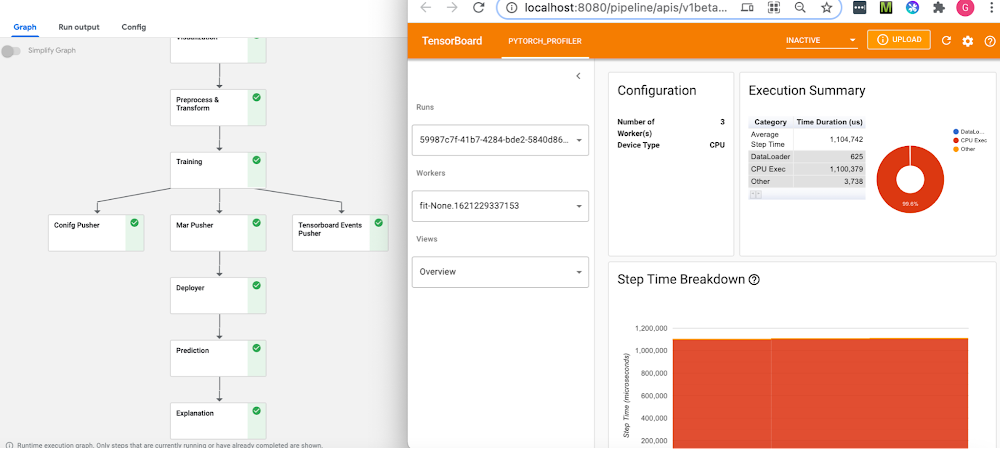
IntroductionML Ops is an ML engineering culture and practice that aims at unifying ML system development and ML system operation. An important ML Ops design pattern is the ability to formalize ML workflows. This allows them to be reproduced, tracked and analyzed, shared, and more.Pipelines frameworks support this pattern, and are the backbone of an ML Ops story. These frameworks help you to automate, monitor, and govern your ML systems by orchestrating your ML workflows. In this post, we’ll show examples of PyTorch-based ML workflows on two pipelines frameworks: OSS Kubeflow Pipelines, part of the Kubeflow project; and Vertex Pipelines. We are also excited to share some new PyTorch components that have been added to the Kubeflow Pipelines repo. In addition, we’ll show how the Vertex Pipelines examples, which require v2 of the KFP SDK, can now also be run on an OSS Kubeflow Pipelines installation using the KFP v2 ‘compatibility mode’.PyTorch on Google Cloud PlatformPyTorch continues to evolve rapidly, with more complex ML workflows being deployed at scale. Companies are using PyTorch in innovative ways for AI-powered solutions ranging from autonomous driving to drug discovery, surgical Intelligence, and even agriculture. MLOps and managing the end-to-end lifecycle for these real world solutions, running at large scale, continues to be a challenge. The recently-launched Vertex AI is a unified ML Ops platform to help data scientists and ML engineers increase their rate of experimentation, deploy models faster, and manage models more effectively. It brings AutoML and AI Platform together, with some new ML Ops-focused products, into a unified API, client library, and user interface.Google Cloud Platform and Vertex AI are a great fit for PyTorch, with PyTorch support for Vertex AI training and serving, and PyTorch-based Deep Learning VM images and containers, including PyTorch XLA support.The rest of this post will show examples of PyTorch-based ML workflows on two pipelines frameworks: OSS Kubeflow Pipelines, part of the Kubeflow project; and Vertex Pipelines. All the examples use the open-source Python KFP (Kubeflow Pipelines) SDK, which makes it straightforward to define and use PyTorch components.Both pipelines frameworks provide sets of prebuilt components for ML-related tasks; support easy component (pipeline step) authoring and provide pipeline control flow like loops and conditionals; automatically log metadata during pipeline execution; support step execution caching; and more.Both of these frameworks make it straightforward to build and use PyTorch-based pipeline components, and to create and run PyTorch-based workflows. Kubeflow PipelinesThe Kubeflow open-source project includes Kubeflow Pipelines (KFP), a platform for building and deploying portable, scalable machine learning (ML) workflows based on Docker containers. The open-source Kubeflow Pipelines backend runs on a Kubernetes cluster, such as GKE, Google’s hosted Kubernetes. You can install the KFP backend ‘standalone’ — via CLI or via the GCP Marketplace— if you don’t need the other parts of Kubeflow. The OSS KFP examples highlighted in this post show several different workflows and include some newly contributed components now in the Kubeflow Pipelines GitHub repo. These examples show how to leverage the underlying Kubernetes cluster for distributed training; use a TensorBoard server for monitoring and profiling; and more. Vertex PipelinesVertex Pipelines is part of Vertex AI, and uses a different backend from open-source KFP. It is automated, scalable, serverless, and cost-effective: you pay only for what you use. Vertex Pipelines is the backbone of the Vertex AI ML Ops story, and makes it easy to build and run ML workflows using any ML framework. Because it is serverless, and has seamless integration with GCP and Vertex AI tools and services, you can focus on building and running your pipelines without dealing with infrastructure or cluster maintenance.Vertex Pipelines automatically logs metadata to track artifacts, lineage, metrics, and execution across your ML workflows, and provides support for enterprise security controls like Cloud IAM, VPC-SC, and CMEK.The example Vertex pipelines highlighted in this post share some underlying PyTorch modules with the OSS KFP example, and include use of the prebuilt Google Cloud Pipeline Components, which make it easy to access Vertex AI services. Vertex Pipelines requires v2 of the KFP SDK. It is now possible to use the KFP v2 ‘compatibility mode’ to run KFP V2 examples on an OSS KFP installation, and we’ll show how to do that as well.PyTorch on Kubeflow Pipelines: PyTorch KFP Components SDKIn collaboration across Google and Facebook, we are announcing a number of technical contributions to enable large- scale ML workflows on Kubeflow Pipelines with PyTorch. This includes the PyTorch Kubeflow Pipelines components SDK with features for:  Data loading and preprocessing Model Training using PyTorch Lightning as training loop Model profiling and visualizations using the new PyTorch Tensorboard Profiler Model deployment & Serving using TorchServe + KFServing with canary rollouts, autoscaling, and Prometheus monitoring Model Interpretability using CaptumDistributed training using the PyTorch job operator for KFPHyperparameter tuning using Ax/BoTorchML Metadata for Artifact Lineage Tracking Cloud agnostic artifacts storage component using Minio Computer Vision and NLP workflows are available for:Open Source Kubeflow Pipelines deployed on any cloud or on-prem Google Cloud Vertex AI Pipelines for Serverless pipelines solutionFigure 1: NLP BERT Workflow on Open Source KFP with PyTorch profiler and Captum insights, (top left) Pipeline View (top right) PyTorch Tensorboard Profiler for the training node, (bottom) Captum model insights for the model prediction Start by setting up a KFP cluster with all the prerequisites, and then follow one of the examples under the pytorch-samples here. Sample notebooks and full pipelines examples are available for the following: Computer Vision CIFAR10 pipeline, basic notebook, and notebook with Captum InsightsNLP BERT pipeline, and notebook with Captum for model interpretability.Distributed training  sample using the PyTorch job operatorHyperparameter optimization sample using Ax/BotorchNote: All the samples are expected to run both on-prem and on any cloud, using CPU or GPUs for training and inference. Minio is used as the cloud-agnostic storage solution. A custom TensorBoard image is used for viewing the PyTorch Profiler.PyTorch on Kubeflow Pipelines : BERT NLP exampleLet’s do a walkthrough of the BERT example notebook. Training the PyTorch NLP modelOne starts by defining the KFP pipeline with all the tasks to execute. The tasks are defined using the component yamls with configurable parameters. All templates are available here. The training component takes as input a PyTorch Lightning script, along with the input data and parameters and returns the model checkpoint, tensorboard profiler traces and the metadata for metrics like confusion matrix and artifacts tracking.If you are using GPUs for training, set the gpus to value > 0 and use ‘ddp’ as the default accelerator type. You will also need to specify the gpu limit and node selector constraint for the cluster: For generating traces for the PyTorch Tensorboard profiler, “profiler=pytorch” is set in script_args. The confusion matrix gets logged as part of the ML metadata in the KFP artifacts store, along with all the inputs and outputs and the detailed logs for pipeline run. You can view these from the pipeline graph and the lineage explorer (as shown in Figure 2 below). Caching is enabled by default, so if you run the same pipeline again with the same inputs, the results will be picked up from the KFP cache.Figure 2: Pipeline graph view, Visualization for Confusion Matrix and ML Metadata in the Lineage ExplorerThe template_mapping.json config file is used for generating the component yaml files from the templates and setting the script names and docker container with all the code. You can create a similar Docker container for your own pipeline. Debugging using PyTorch Tensorboard ProfilerThe PyTorch Tensorboard Profiler provides insights into the performance bottlenecks like inefficiency for loading data, underutilization of the GPUs, SM efficiency, and CPU-GPU thrashing, and is very helpful for debugging performance issues. Check out the Profiler 1.9 blog for the latest updates. In the KFP pipeline, the Tensorboard Visualization component handles all the magic of making the traces available to the PyTorch Tensorboard profiler; therefore it is created before starting the training run.  The profiler traces are saved in the tensorboard/logs bucket under the pipeline run ID and are available for viewing after the training step completes. You can access TensorBoard from the Visualization component of the pipeline after clicking the “Start Tensorboard” button. Full traces are available from the PyTorch Profiler view in the Tensboard as shown below:Figure 3: PyTorch Profiler Trace viewA custom docker container is used for the PyTorch profiler plugin, and you can specify the image name by setting the TENSORBOARD_IMAGE parameter. Model Serving using KFServing with TorchServePyTorch model serving for running the predictions is done via the KFServing + TorchServe integration. It supports prediction and explanation APIs, canary rollouts with autoscaling, and monitoring using Prometheus and Grafana. For the NLP BERT model, the bert_handler.py defines the TorchServe custom handler with logic for loading the model, running predictions, and doing the pre-processing and post processing.  The training component generates the model files as a model-archiver package, and this gets deployed onto TorchServe. The minio op is used for making the model-archiver and the TorchServe config properties available to the deployment op. For deploying the model, you simply need to set the KFServing Inference yaml with the relevant values, e.g. for the GPU inference you will pass the model storage location, and the number of GPUs:Using Captum for Model InterpretabilityCaptum.ai is the Model Interpretability library for PyTorch. In the NLP example we use the explanation API of KFserving and TorchServe to get the model insights for interpretability. The explain handler defines the IntegratedGradient computation logic which gets called via the explain endpoint and returns a json response with the interpretability output. The results are rendered in the notebook using Captum Insights.This renders the color-coded visualization for the word importance.Distributed training using PyTorch job operatorThe Kubeflow PyTorch job operator is used for distributed training and it takes as inputs the job spec for the master and worker nodes along with the option to customize other parameters via the pytorch-launcher component.PyTorch on Kubeflow Pipelines : CIFAR10 HPO exampleHyperparameter optimization using Ax/BoTorchAx is the adaptive experimentation platform for PyTorch, and BoTorch is the Bayesian Optimization library. They are used together for Hyperparameter optimization. The CIFAR10-HPO notebook describes the usage for this. We start off by generating the experiment trials with the parameters that we want to optimize using the ax_generate_trials component.Next, the trials are run in parallel using the ax_train_component.And finally, the ax_complete_trials componentis used for processing the results for the best parameters from the Hyperparameter search.The best parameters can be viewed under Input/Output section of ax_complete trials (as shown in the figure below):PyTorch on Vertex Pipelines: CIFAR10 image classification exampleThe Vertex Pipelines examples in this post also use the KFP SDK, and include use of the Google Cloud Pipeline Components, which support easy access to Vertex AI services. Vertex Pipelines requires v2 of the KFP SDK. So, these examples diverge from the OSS KFP v1-based examples above, though the components share some of the same data processing and training base classes. It is now possible to use the KFP v2 ‘compatibility mode’ to run KFP V2 examples on an OSS KFP installation, and we’ll show how to do that as well.An example PyTorch Vertex Pipelines notebook shows two variants of a pipeline that: do data preprocessing, train a PyTorch CIFAR10 resnet model, convert the model to archive format, build a torchserve serving container, upload the model container configured for Vertex AI custom prediction, and deploy the model serving container to an endpoint so that it can serve prediction requests on Vertex AI.  In the example, the torchserve serving container is configured to use the kfserving service envelope, which is compatible with the Vertex AI prediction service.Training the PyTorch image classification modelThe difference between the two pipeline variants in the notebook is in the training step. One variant does on-step-node single-GPU training— that is, it runs the training job directly on the Vertex pipeline step node. We can specify how the pipeline step instance is configured, to give the node instance the necessary resources. This fragment from the KFP pipeline definition shows that configuration, which specifies to use one Nvidia V100 for the training step in the pipeline:The other example variant in the notebook shows multi-GPU, single-node training via Vertex AI’s support for custom training, using the Vertex AI SDK. From the ‘custom training’ pipeline step, a custom job is defined, passing the URI of the container image for the PyTorch training code:Then the custom training job is run, specifying machine and accelerator types, and number of accelerators:PyTorch prebuilt training containers are available as well, though for this example we used PyTorch v1.8, which at time of writing  is not yet available in the prebuilt set.Defining KFP PipelinesSome steps in the example KFP v2 pipelines are built from Python function-based custom components— these make it easy to develop pipelines interactively, and are defined right in the example notebook— and other steps are defined using a set of prebuilt components that make it easy to interact with Vertex AI and other services— the steps that upload the model, create an endpoint, and deploy the model to the endpoint.The custom components include pipeline steps to create a model archive from the trained PyTorch model and the model file, and to build a torchserve container image using the model archive file and the serving config.properties. The torchserve build step uses Cloud Build to create the container image.These pipeline component definitions can be compiled to .yaml files, as shown in the example notebook. The .yaml component definitions are portable: they can be placed under version control and shared, and used to create pipeline steps for use in other pipeline definitions.The KFP pipeline definition looks like the following, with some detail removed. (See the notebook for the full definition). Some pipeline steps consume as inputs the outputs of other steps. The prebuilt google_cloud_pipeline_components make it straightforward to access Vertex AI services. Note that the ModelDeployOp step is configured to serve the trained model on a GPU instance.Here’s the pipeline graph for one of the Vertex Pipelines examples:The pipeline graph for one of the KFP v2 example pipelines, running on Vertex PipelinesAs a pipeline runs, metadata about the run, including its Artifacts, executions, and events, is automatically logged to the Vertex ML Metadata server. The Pipelines Lineage Tracker, part of the UI, uses the logged metadata to render an Artifact-centric view of pipeline runs, showing how Artifacts are connected by step executions. In this view, it’s easy to track where multiple pipeline runs have used the same artifact. (Where a pipeline is able to leverage caching, you will often notice that multiple pipeline runs are able to use the same cached step outputs.)Vertex Pipeline artifact lineage tracking.Using KFP ‘v2 compatibility mode’ to run the pipelines on an OSS KFP installationIt is now possible to run the same KFP v2 pipelines in the Vertex example above on an OSS KFP installation.  Kubeflow Pipelines SDK v2 compatibility mode lets you use the new pipeline semantics in v2 and gain the benefits of logging your metadata to ML Metadata. Compatibility mode means that you can develop a pipeline on one platform, and run it on the other.Here is the pipeline graph for the same pipeline shown above running on Vertex Pipelines, but running on an OSS KFP installation.  If you compare it to the Vertex Pipelines graph in the figure above, you can see that they have the same structure.The example’s README gives more information about how to do the installation, and the example PyTorch Vertex Pipelines notebook includes sections that show how to launch an OSS KFP pipeline run once you’ve done the setup.The pipeline graph for one of the KFP v2 example pipelines, running on an OSS KFP installation.Next stepsThis post showed some examples of how to build scalable ML workflows using PyTorch, running on both OSS Kubeflow Pipelines and Vertex Pipelines.  Kubeflow and Vertex AI make it easy to use PyTorch on GCP, and we have announced some new PyTorch KFP components that make creating PyTorch-based ML workflows even easier. We also showed how the Vertex Pipelines examples, which require v2 of the KFP SDK, can now also be run on an OSS Kubeflow Pipelines installation using the KFP v2 ‘compatibility mode’.Please check out the samples here and here, and let us know what you think! You can provide feedback on the PyTorch Forums or file issues on the Kubeflow Pipelines Github repository.AcknowledgementsThe authors would like to thank the contributions from the following people for making this work possible: Pavel Dournov, Henry Tappen, Yuan Gong, Jagadeesh Jaganathan, Srinath Suresh, Alexey Volkov, Karl Weinmeister, Vaibhav Singh, and the Vertex Pipelines team.Related ArticlePyTorch on Google Cloud: How To train and tune PyTorch models on Vertex AIWith the PyTorch on Google Cloud blog series, we will share how to build, train and deploy PyTorch models at scale, how to create reprodu…Read Article
Quelle: Google Cloud Platform

Sqlcommenter now extending the vision of OpenTelemetry to databases

Database observability is important to every DevOps team. In order to troubleshoot a slow running application, developers, DBAs, data engineers or SREs use a variety of tools for Application Performance Monitoring (APM) that need access to database activity. This makes it imperative for database telemetry to be easily accessible and integrated seamlessly with your choice of tooling to get end-to-end observability. And that’s why today, we’re announcing that we are merging Sqlcommenter, an open source object-relational mapping (ORM) auto-instrumentation library, with OpenTelemetry, an open source observability framework. This merge will enable application-focused database observability with open standards. To easily correlate application and database telemetry, we open-sourced Sqlcommenter earlier this year, which was followed by great adoption from the developer community. Sqlcommenter enables object–relational mappings (ORMs) to augment SQL statements before execution, with comments containing information about the application code that caused its execution. This simplifies the process of correlating slow queries with source code, and provides insights into backend database performance. Sqlcommenter also allows OpenTelemetry trace context information to be propagated to the database, enabling correlation between application traces and database query plans.The following example shows a query log with SQL comments added by Sqlcommenter for the Sequelize ORM.Application developers can use observability information from Sqlcommenter to analyze slow query logs; or that observability information can be integrated into other products such as Cloud SQL Insights or APM tools from Datadog, Dynatrace, and Splunk to provide application-centric monitoring.Extending the vision of OpenTelemetry to DatabasesOpenTelemetry, which is now the second most active Cloud Native Computing Foundation (CNCF)  open-source project behind Kubernetes, makes it easy to create and collect telemetry data from your services and software, then forward that data to a variety of Application Performance Monitoring tools. But before today, OpenTelemetry lacked a common standard by which application tags and traces can be sent to databases and correlated with an application stack. To extend the vision of OpenTelemetry to databases, we merged Sqlcommenter with OpenTelemetry to unlock a rich choice of tools for database observability for developers. Bogdan Drutu, Co-founder of OpenCensus & OpenTelemetry and Senior Principal Software Engineer, Splunk, offered his perspective;“With Google Cloud’s Sqlcommenter contribution to OpenTelemetry, a vendor-neutral open standard and library will enable a rich ecosystem of Application Performance Monitoring tools to easily integrate with databases, unlocking a rich choice of tools for database observability for the developers.”OpenTelemetry, Google Cloud and our partnersWe believe that a healthy observability ecosystem is necessary for end-to-end application stack visibility and this is reflected in our continued commitment to open-source initiatives. This belief is shared by other key contributors to the ecosystem including Datadog, Dynatrace and Splunk:Datadog “Visibility into database performance and its impact on applications is critical to engineering.  A poorly performing query can impact every other layer of the stack making troubleshooting difficult.   Sqlcommenter bridges the gap between application requests and database queries, allowing APM users to troubleshoot requests in their entirety at all levels, from frontend to data tiers. As early contributors to OpenTelemetry, we are extremely pleased to see this contribution from Google Cloud as it brings us closer to the vision of open standards based observability.” – Ilan Rabinovitch, SVP Product, DatadogDynatrace“Observing datasets across thousands of companies, we’ve identified database access patterns and performance as among the top reasons for poor performing applications. Dynatrace, a core contributor to OpenTelemetry, natively supports telemetry data generated by Sqlcommenter in problem analysis, change detection, and real-time optimization analytics. We see the combination of Sqlcommenter and OpenTelemetry helping developers understand the impact of their database queries and make it easier to collaborate to optimize application performance.”—Alois Reitbauer, VP, Chief Technology Strategist, DynatraceSplunk”Splunk and Google have been behind OpenTelemetry since day one, and the merging of Sqlcommenter to OpenTelemetry means Splunk Observability Cloud customers can further empower developers with application centric database monitoring, accelerating their DevOps journeys for databases.”—Morgan McLean, Co-founder of OpenCensus & OpenTelemetry and Director of Product Management, SplunkAn example of how Cloud SQL Insights uses Sqlcommenter to simplify observability for developersTroubleshooting databases is hard in modern application architecturesToday’s microservice-based architectures redefine an application as an interconnected mesh of services as seen in the picture below, many of which are third-party and/or open-source. This can make it challenging to understand the source of system performance issues. When a database is involved, it becomes even harder to correlate application code with database performance. Cloud SQL Insights leverages Sqlcommenter to simplify database troubleshooting in distributed architectures.Application-centric database monitoring If you are an on-call engineer and an alert goes off indicating a database problem, it can be hard to identify which microservices may be impacting your databases. Existing database monitoring tools only provide a query-centric view, leaving a disconnect between application and queries. To empower developers to monitor their databases through the lens of an application, Cloud SQL Insights uses the  information sent by Sqlcommenter to identify the top application tags (model, view, controller, route, user, host etc.) that are sent by the application. As seen in the following Insights dashboard example, users can get a holistic view of performance organized by business function rather than by query, making it easy to identify which service is causing the database to be slow.End-to-end tracingKnowing which microservice and query is causing the problem is not enough; you also need to quickly detect which part of the application code is causing the problem. To get an end-to-end application trace, Sqlcommenter allows OpenTelemetry trace context information to be propagated to the database. With Cloud SQL Insights, query plans are generated as traces with the traceparent context information from the SQL comments. Since the trace id is created by the application, and the parent span id and trace id is sent to the database as SQL comments, end-to-end tracing from application to database is now possible. The example below shows application trace spans from OpenTelemetry along with query plan trace spans from the NodeJS Express Sqlcommenter library.Contributing to SqlcommenterToday Sqlcommenter is available for Python, Java, Node.js and Ruby languages and supports Django, Sqlalchemy, Hibernate, Knex, Sequelize and Rails ORMs. All these Sqlcommenter libraries will be available as part of the CNCF project. With OpenTelemetry community support there is an opportunity to extend it to many more languages and ORMs. You can join the OpenTelemetry Slack channel here, or check out the Special Interest Groups (SIGs) community here.Related ArticleIntroducing Sqlcommenter: An open source ORM auto-instrumentation librarySqlcommenter is an open source library that enables ORMs to augment SQL statements with comments before execution.Read Article
Quelle: Google Cloud Platform