Dual deployments on Vertex AI

In this post, we will cover an end-to-end workflow enabling dual model deployment scenarios using Kubeflow, TensorFlow Extended (TFX), and Vertex AI. We will start with the motivation behind the project and then we will move over to the approaches we realized as a part of this project. We will conclude the post by going over the cost breakdown for each of the approaches. While this post will not include exhaustive code snippets and reviews you can always find the entire code in this GitHub repository. To fully follow through this post, we assume that you are already familiar with the basics of TFX, Vertex AI, and Kubeflow. It’d be also helpful if you have some familiarity with TensorFlow and Keras since we will be using them as our primary deep learning framework. MotivationScenario #1 (Online / offline prediction)Let’s say you want to allow your users to run an application both in online and offline mode. Your mobile application would use a TensorFlow Lite (TFLite) model depending on the network bandwidth/battery etc., and if sufficient network coverage/internet bandwidth is available your application would instead use the online cloud one. This way your application stays resilient and can ensure high availability.Scenario #2 (Layered predictions) Sometimes we also do layered predictions where we first divide a problem into smaller tasks:1) predict if it’s a yes/no, 2) depending on the output of 1) we run the final model.In these cases, 1) takes place on-device and 2) takes place on the cloud to ensure a smooth user experience. Furthermore, it’s a good practice to use a mobile-friendly network architecture (such as MobileNetV3) when considering mobile deployments. A detailed analysis of this situation is discussed in the book ML Design Patterns.The discussions above lead us to the following question:Can we train two different models within the same deployment pipeline and manage them seamlessly?This project is motivated by this question. The rest of this post will walk you over the different components that were pulled in to make such a pipeline operate in a self-contained and seamless manner. Dataset and modelsWe use the Flowers dataset in this project which consists of 3670 examples of flowers categorized into five classes – daisy, dandelion, roses, sunflowers, and tulips. So, our task is to build flower classification models which are essentially multi-class classifiers in this case. Recall that we will be using two different models. One, that will be deployed on the cloud and will be consumed via REST API calls. The other model will sit inside mobile phones and will be consumed by mobile applications. For the first model, we will use a DenseNet121 and for the mobile-friendly model, we will use a MobileNetV3. We will make use of transfer learning to speed up the model training process. You can study the entire training pipeline from this notebook.On the other hand, we also make use of AutoML-based training pipelines for the same workflow where the tooling automatically discovers the best models for the given task within a preconfigured compute budget. Note that the dataset remains the same in this case. You can find the AutoML-based training pipeline in this notebook.ApproachesDifferent organizations have people with varied technical backgrounds. We wanted to provide the easiest solution first and then move on to something that is more customizable.AutoMLFigure 1: Schematic representation of the overall workflow with AutoML components (high-quality).To this end, we leverage standard components from the Google Cloud Pipeline Components library to build, train, and deploy models with different production use-cases. With AutoML, the developers can delegate a large part of their workflows to the SDKs and the codebase also stays comparatively smaller. Figure 1 depicts a sample system architecture for this scenario.For reference, there are a number of tasks supported ranging from image classification to object tracking in Vertex AI. TFX But the story does not end here. What if we wanted to have better control over the models to be built, trained, and deployed? Enter TFX! TFX provides the flexibility of writing custom components and including them inside a pipeline. This way Machine Learning Engineers can focus on building and training their favorite models and delegate a part of the heavy lifting to TFX and Vertex AI. On Vertex AI (acting as an orchestrator) this pipeline will look like so:Figure 2: Computation graph of the TFX components required for our workflow (high-quality).You are probably wondering why there is Firebase in both of the approaches we just discussed. For the model that would be used by mobile applications, that needs to be a TFLite model because of tremendous interoperability with mobile platforms. Firebase provides excellent tooling and integration for TFLite models such as canary rollouts, A/B testing, etc. You can learn more about how Firebase can enhance your TFLite deployments from this blog post.So far we have developed a brief idea about the approaches followed in this project. In the next section, we will dive a bit more into the code and various nuts and bolts that had to be adjusted to make things work. You can find all the code shown in the coming section here.  Implementation detailsSince this project uses two distinguished setups i.e. AutoML based minimal code and TFX-based custom code we will divide this section into two. First, we will introduce the AutoML side of things and then we will head over to TFX. Both these setups will provide similar outputs and will implement identical functionalities. Vertex AI Pipelines with Kubeflow’s AutoML ComponentsThe Google Cloud Pipeline Components library comes with a variety of predefined components supporting services built-in Vertex AI. For instance, you can directly import dataset from Vertex AI’s managed dataset feature into the pipeline, or you can create a model training job to be delegated to Vertex AI’s training feature. You can follow along with the rest of this section with the entire notebook. This project uses the following components:ImageDatasetCreateOpAutoMLImageTrainingJobRunOpModelDeployOpModelExportOpWe use ImageDatasetCreateOp to create a dataset to be injected to the next component, AutoMLImageTrainingJobRunOp. It supports all kinds of datasets from Vertex AI. The import_schema_uri argument determines the type of the target dataset. For instance, it is set to multi_label_classification for this project.The AutoMLImageTrainingJobRunOp delegates model training jobs to Vertex AI training with specified configurations. Since the AutoML model can grow very large, we can set some constraints with budget_milli_node_hours and model_type arguments. The budget_milli_node_hours how many hours are allowed for training. The model_type tells the training job what the target environment is, and which format a trained model should have. We created two instances of AutoMLImageTrainingJobRunOp, and model_type is set to “CLOUD” and “MOBILE_TF_VERSATILE_1″ respectively. As you can see, the string parameter itself describes what it is. There are more options, so please take a look at the official API document. The ModelDeployOp does three jobs in one place. It uploads a trained model to Vertex AI model, creates an endpoint, and deploys the trained model to the endpoint. With ModelDeployOp, you can deploy your model in the cloud easily and fast. On the other hand, the ModelExportOp only exports a trained model to a designated location like GCS bucket. Because the mobile model is not going to be deployed in the cloud, we explicitly need to get the saved model so that we can directly embed it on a device or publish it to Firebase ML. In order to make a trained model as an on-device model, export_format_id should be set appropriately in ModelExportOp. The possible values are “tflite”, “edgetpu-tflite”, “tf-saved-model”, “tf-js”, “core-ml”, and “custom-trained”, and it is set to “tflite” for this project. With these four components, you can create a dataset, train cloud and mobile models with AutoML, deploy the trained model to cloud, and export the trained model to a file whose format is .tflite. The last step would be to embed the exported model into the mobile application project. However, it is not flexible since you have to compile the application and upload it to the marketplace every time. FirebaseInstead, we can publish a trained model to Firebase ML. We are not going to explain what Firebase ML is in-depth, but it basically lets the application download and update the machine learning model on the fly. This ensures that the user experience becomes much smoother. In order to integrate publishing capability into the pipeline, we have created custom components, one for KFP native and the other one for TFX. Let’s explore what it looks like in KFP native now, then the one for TFX will be discussed in the next section. Please make sure you read the general instructions under the “Before you begin” section on the official Firebase document as a prerequisite.In this project, we have written python function-based custom components for the KFP native environment. The first step is to mark a function with @component decorator by specifying which packages to be installed. When compiling the pipeline, KFP will wrap this function as a Docker image which means everything inside the function is completely isolated, so we have to say what dependencies this function needs via packages_to_install.The beginning part is omitted, but what it does is to download the firebase credential file and the saved model from firebase_credential_uri and model_bucket respectively. You can assume that the downloaded files are named as credential.json and model.tflite. Also, we have found that the files can not be directly referenced if they are stored in GCS, so this is why we have downloaded them locally. firebase_admin.initialize_app method initializes the authorization to the Firebase with the given credential and the GCS bucket which is used to store the model file temporarily. The GCS bucket is required by Firebase, and you can simply create one within the storage menu in the Firebase dashboard.ml.list_models method returns a list of models deployed in the Firebase ML, and you can filter the items with display_name or tags. The purpose of this line is to check if the model with the same name has already been deployed because we have to update the model instead of creating one if the one exists.The update and create routine has one thing in common. That is the loading process for the local model file to be uploaded into the temporary GCS bucket by calling ml.TFLiteGCSModelSource.from_tflite_model_file method. After the loading process, you can choose either of ml.create_model or ml.update_model method. Then you are good to publish the model with the ml.publish_model method.Putting things togetherWe have explored five components including the custom one, push_to_firebase. It is time to jump into the pipeline to see how these components are connected together. First of all, we need two different sets of configurations for each deployment. We can hard-code them, but it would be much better to have a list of dictionaries like below.You should be able to recognize each individual component and what it does. What you need to focus on this time is how the components are connected, how to make parallel jobs for each deployment, and how to make a conditional branch to handle each deployment-specific job. As you can see, each component except for push_to_firebase has an argument to get input from the output of the previous component. For instance, the AutoMLImageTrainingJobRunOp launches a model training process based on the dataset parameter, and its value is injected from the output of ImageDatasetCreateOp. You might wonder why there is no dependency between ModelExportOp and push_to_firebase components. That is because the GCS location for the exported model is defined manually with artifact_destination parameter in ModelExportOp. Because of this, the same GCS location can be passed down to the push_to_firebase component manually.With the pipeline function defined with @kfp.dsl.pipeline decorator, we can compile the pipeline via the kfp.v2.compiler.compile method. The compiler converts all the details about how the pipeline is constructed into a JSON format file. You can safely store the JSON file in a GCS bucket if you want to control different versions. Why not version control the actual pipelining code? That is because the pipeline can be run by just referring to the JSON file with create_run_from_job_spec method under kfp.v2.google.client.AIPlatformClient.Vertex AI Pipelines with TFX’s pre-built and custom componentsTFX provides a number of useful pre-built components that are crucial to orchestrate a machine learning project end-to-end. Here you can find a list of the standard components offered by TFX. This project leverages the following stock TFX components:ImportExampleGenTrainerPusherWe use ImportExampleGen to read TFRecords from a Google Cloud Storage (GCS) bucket. The Trainer component trains models and Pusher exports the trained model to a pre-specified location (which is a GCS bucket in this case). For the purpose of this project, the data preprocessing steps are performed within the training component but TFX provides first-class support for data preprocessing.Note: Since we will be using Vertex AI to orchestrate the entire pipeline, the Trainer component here is tfx.extensions.google_cloud_ai_platform.Trainer which lets us take advantage of Vertex AI’s serverless infrastructure to train models. Recall from Figures 1 and 2 that once the models have been trained they will need to go down two different paths – 1) Endpoint (more on this in a moment), 2) Firebase. So, after training and pushing the models we would need to:1. Deploy one of the models to Vertex AI as an Endpoint so that it can be consumed via REST API calls.To deploy your model using Vertex AI one first needs to import their model if it’s not already there. Once the right model is imported (or identified) it needs to be deployed to an Endpoint. Endpoints provide a flexible way to version control different models that one may deploy during the entire production life-cycle. 2. Push the other model to Firebase so that mobile developers can use it to build their applications. As per these requirements, we need to develop three custom components at the very least:One that would take input as a pre-trained model and import that in Vertex AI (VertexUploader). Another component will be responsible for deploying it to an Endpoint (if it’s not present it will be created automatically) (VertexDeployer). The final component will push the mobile-friendly model to Firebase (FirebasePublisher). Let’s now go through the main components of each of these one by one. Model uploadWe will be using Vertex AI’s Python SDK to import a model of choice in Vertex AI. The code to accomplish this is fairly straightforward:Learn more about the different arguments of vertex_ai.Model.upload() from here. Now, in order to turn this into a custom TFX component (so that it runs as a part of the pipeline), we need to put this code inside a Python function and decorate that with the component decorator:And that is it! The full snippet is available here for reference. One important detail to note here is that serving_image_uri should be one of the pre-built containers as listed here. Model deployNow that our model is imported in  Vertex AI we can proceed with its deployment. First, we will create an Endpoint and then we will deploy the imported model to that Endpoint. With some utilities discarded the code for doing this looks like so (full snippet can be found here):Explore the different arguments used inside endpoint.deploy() from here. You might actually enjoy them because they provide many production-friendly features like autoscaling, hardware configurations, traffic splitting, etc. right off the bat. Thanks to this repository that was used as references for implementing these two components. FirebaseThis part shows how to create a custom python function based on the TFX component. However, the underlying logic is pretty much the same to the one introduced in the AutoML section. We omit the internal details on this post, but you can find the complete source code here.We just want to point out the usage of the type checker,  tfx.dsl.components.InputArtifact[tfx.types.standard_artifacts.PushedModel]. The tfx.dsl.components.InputArtifact means the parameter is a type of TFX artifact, and it is used as an input to the component. Likewise, there is tfx.dsl.components.OutputArtifact, and you can specify what kind of output the component should produce.Then, we have to tell where the input artifact comes from within the square brackets. In this case, we want to publish the pushed model to the Firebase ML, so the tfx.types.standard_artifacts.PushedModel is used. You can hard code the URI, but it is not flexible, and it is recommended to refer to the information from the PushedModel component.Custom Docker imageTFX provides pre-built Docker images where the pipelines can be run. But to execute a pipeline that contains custom components leveraging various external libraries we need to build a custom Docker image. Surprisingly, the changes are minor to accommodate this. Below is the Dockerfile configuration to build a custom Docker image that would support the above-discussed custom TFX components:Here, custom_components contains the .py files of our custom components. Now, we just need to build the image and push it to Google Container Registry (one can use Docker Hub as well).  For building and pushing the image, we can either use docker build and docker push commands or we can use Cloud Build which is a serverless CI/CD platform from Google Cloud.  To trigger the build using Cloud Build we can just use the following command:Do note that TFX_IMAGE_URI which, as the name suggests, is the URI of our custom Docker image that will be used to execute the final pipeline. The builds are available in the form of a nice dashboard along with all the build logs. Figure 3: Docker image build output from Cloud Build (high-quality).Putting things togetherNow that we have all the important pieces together we need to make them a part of a TFX pipeline so that it can be executed end-to-end. The entire code can be found in this notebook. Before putting things together into the pipeline, it is better to define some constant variables separately for readability. The name of model_display_name,   pushed_model_location, and pushed_location_mobilenet variable itself explains pretty much what they are. On the other hand, the TRAINING_JOB_SPEC is somewhat verbose, so let’s go through it.TRAINING_JOB_SPEC basically sets up the hardware and the software infrastructures for model training. The worker_pool_specs lets you have different types of clusters if you want to leverage distributed training features on Vertex AI. For instance, the first entry is reserved for the primary cluster, and the fourth entry is reserved for evaluators. In this project, we have set only the primary cluster. For each worker_pool_specs, the machine_spec and the container_spec define hardware and software infrastructures respectively. As you can see, we have used only one NVIDIA_TESLA_K80 GPU within n1-standard-4 instance, and we have set the base Docker image to an official TFX image. You can learn more about these specifications here.We will use these configurations in the pipeline below. Note that the model training infrastructure is completely different from the GKE cluster where the Vertex AI internally runs each component’s job. That is why we need to set base Docker images in multiple places rather than via a unified API. The code below shows how everything is organized in the entire pipeline. Please follow the code by focusing on how components are connected and what special parameters are necessary to leverage Vertex AI.As you can see, each standard component has at least one special parameter to get input from the output of different components. For instance, the Trainer has the examples parameter, and its value comes from the ImportExampleGen. Likewise, Pusher has the model parameter, and its value comes from the Trainer. On the other hand, if a component doesn’t define a special parameter, you can set the dependencies explicitly via add_upstream_node method. You can find the example usages of add_upstream_node with VertexUploader and VertexDeployer.After defining and connecting TFX components, the next step is to put those components in a list. A pipeline function should return tfx.dsl.Pipeline type of object, and it can be instantiated with that list. With tfx.dsl.Pipeline, we can finally create a pipeline specification with KubeflowV2DagRunnerunder the tfx.orchestration.experimental module. When you call the run method of the KubeflowV2DagRunnerwith the tfx.dsl.Pipeline object, it will create a pipeline specification file in JSON format. The JSON file can be passed to the kfp.v2.google.AIPlatformClient’s create_run_from_job_spec method, then it will create a pipeline run on Vertex AI Pipeline. All of these in code looks like so:Once the above steps are executed you should be able to see a pipeline on the Vertex AI Pipelines dashboard. One very important detail to note here is that the pipeline needs to be compiled such that it runs on the custom TFX Docker image we built in one of the earlier steps. CostVertex AI Training is a separate service from Pipeline. We need to pay for the Vertex AI Pipeline individually, and it costs about $0.03 per pipeline run. The type of compute instance for each component was e2-standard-4, and it costs about $0.134 per hour. Since the whole pipeline took less than an hour to be finished, we can estimate that the total cost was about $0.164 for a Vertex AI Pipeline run.The cost for the AutoML training depends on the type of task and the target environment. For instance, the AutoML training job for the cloud model costs about $3.15 per hour whereas the AutoML training job for the on-device mobile model costs about $4.95 per hour. The training jobs were done in less than an hour for this project, so it cost about $10 for the two models fully trained. On the other hand, the cost of custom model training depends on the type of machine and the number of hours. Also, you have to consider that you pay for the server and the accelerator separately. For this project, we chose n1-standard-4 machine type whose price is $0.19 per hour and NVIDIA_TESLA_K80 accelerator type whose price is $0.45 per hour. The training for each model was done in less than an hour, so it cost about $1.28 in total.The cost of the model prediction is defined separately for AutoML and custom-trained models. The online and batch predictions for AutoML model cost about $1.25 and $2.02 per hour respectively. On the other hand, the prediction cost of a custom-trained model is roughly determined by the machine type. In this project, we specified it as n1-standard-4 whose price is $0.1901 per hour without an accelerator in the us-central-1 region. If we sum up the cost spent on this project, it is about $12.13 for the two pipeline runs to be completed. Please refer to the official document for further information.Firebase ML doesn’t cost anything. You can use it for free for Custom Model Deployment. Please find out more information about the price for Firebase service here.ConclusionIn this post, we covered why having two different types of models may be necessary to serve users. We realized a simple but scalable automated pipeline for the same using two different approaches using Vertex AI on GCP. One, where we used Kubeflow’s AutoML SDK delegating much of the heavy lifting to the frameworks. In the other approach, we leveraged TFX’s custom components to customize various parts of the pipeline as per our requirements. Hopefully, this post provided you with a few important recipes that are important to have in your Machine Learning Engineering toolbox. Feel free to try out our code here and let us know what you think.AcknowledgementsWe are grateful to the ML-GDE program that provided GCP credits for supporting our experiments. We sincerely thank Karl Weinmeister and Robert Crowe of Google for their help with the review.Related ArticleNew to ML: Learning path on Vertex AIIf you’re new to ML, or new to Vertex AI, this post will walk through a few example ML scenarios to help you understand when to use which…Read Article
Quelle: Google Cloud Platform

What’s your org’s reliability mindset? Insights from Google SREs

Editor’s note: There’s more to ensuring a product’s reliability than following a bunch of prescriptive rules. Today, we hear from some Google SREs—Vartika Agarwal, Senior Technical Program Manager, Development; Tracy Ferrell, Senior SRE Manager; Mahesh Palekar, Director SRE; and Magi Agrama, Senior Technical Program Manager, SRE—about how to evaluate your team’s current reliability mindset, and what you want it to be.Having a reliable software product can improve users’ trust in your organization, the effectiveness of your development processes, and the quality of your products overall. More than ever, product reliability is front and center, as outages negatively impact customers and their businesses. But in an effort to develop new features, many organizations limit their reliability efforts to what happens after an outage, and tactically solve for the immediate problems that sparked it. They often fail to realize that they can move quickly while still improving their product’s reliability.At Google, we’ve given a lot of thought to product reliability—and several of its aspects are well understood, for example product or system design. What people think about less is the culture and the mindset of the organization that creates a reliable product in the first place. We believe that the reliability of a product is a property of the architecture of its system, processes, culture, as well as the mindset of the product team or organization that built it. In other words, reliability should be woven into the fabric of an organization, not just the result of a strong design ethos. In this blog post, we discuss the lessons we’ve learned relevant to organizational or product leads who have the ability to influence the culture of the entire product team, from (but not limited to) engineering, product management, marketing, reliability engineering, and support organizations.GoalsReliability should be woven into the fabric of how an organization executes. At Google, we’ve developed a terminology to categorize and describe your organization’s reliability mindset, to help you understand how intentional your organization is in this respect. Our ultimate goal is to help you improve and adopt product reliability practices that will permeate the ethos of the organization.By identifying these reliability phases, we do not mean to offer a prescriptive list of things to do that will improve your product’s reliability. Nor should they be read as a set of mandated principles that everyone should apply, or be used to publicly label a team, spurring competition between teams. Rather, leaders should consider these phases as a way to help them develop their team’s culture, on the road to sustainably building reliable products.  The organizational reliability continuumBased on our observations here at Google, there are five basic stages of organizational reliability, and they are based on the classic organizational model of absent, reactive, proactive, strategic and visionary. These phases describe the mindset of an organization at a point in time, and each one of them is characterized by a series of attributes, and is appropriate for different classes of workloads.Absent: Reliability is a secondary consideration for the organization. A feature launch is the key organizational metric and is the focus for incentivesThe majority of issues are found by users or testers. This organization is not aware of their long-term reliability risks. Developer velocity is rarely exchanged for reliability.This reliability phase maybe appropriate for products and projects that are still under development.Reactive:Responses to reliability issues/risks are tied to recent outages with sporadic follow-through and rarely are there longer-term investments in fixing system issues.Teams have some reliability metrics defined and react when required.They write postmortems for outages and create action items for tactical fixes.Reasonable availability is maintained through heroic efforts by a few individuals or teams Developer productivity is throttled due to a temporary shift in priority on reliability work due to outages. Feature development may be frozen for a short period of time.This level is appropriate for products/projects in pre-launch or in a stable long-term maintenance phase.Proactive:Potential reliability risks are identified and addressed through regular organizational processes.Risks are regularly reviewed and prioritized.Teams proactively manage dependencies and review their reliability metrics (SLOs)New designs are assessed for known risks and failure modes early on. Graceful degradation is a basic requirement.The business understands the need to continuously invest in reliability and maintain its balance with developer velocity. Most services/products should be at this level; particularly if they have a large blast radius or are critical to the business.Strategic:Organizations at this level manage classes of risk via systemic changes to  architectures, products and processes.Reliability is inherent and ingrained in how the organization designs, operates and develops software. Reliability is systemic.Complexity is addressed holistically through product architecture. Dependencies are constantly reduced or improved.The cross-functional organization can sustain reliability and developer velocity simultaneously.Organizations widely celebrate quality and stability milestones.This level is appropriate for services and products that need very high availability to meet business-critical needs.Visionary:The organization has reached the highest order of reliability and is able to drive broader reliability efforts within and outside the company (e.g., writing papers, sharing knowledge), based on their best practices and experiences. Reliability knowledge exists broadly across all engineers and teams at a fairly advanced level and is carried forward as they move across organizations.Systems are self-healing.Architectural improvements for reliability positively impact productivity (release velocity) due to reduction of maintenance work/toil.Very few services or products are at this level, and when they are, are industry leading.Where should you be on the reliability spectrum?It is very important to understand your organization does not necessarily need to be at the strategic or visionary phase. There is a significant cost associated with moving from one phase to another and a cost to remain very high on this curve. In our experience, being proactive is a healthy level to target and is ideal for most products. To illustrate this point, here is a simple graph of where various Google product teams are on the organizational reliability spectrum; as you can see, it produces a standard bell-curve distribution. While many Google’s product teams have a reactive or proactive reliability culture, most can be described as proactive. You, as an organizational leader, must consciously decide to be at a level based on the product requirements and client expectations.Further, it’s common to have attributes across several phases, for example, an organization may be largely reactive with a few proactive attributes. Team culture will wax and wane between phases, as it takes effort to maintain a strategic reliability culture. However, as more of the organization embraces and celebrates reliability as a key feature, the cost of maintenance decreases. The key to success is making an honest assessment of what phase you’re in, and then doing concerted work to move to the phase that makes sense for your product. If your organization is in the absent or reactive phase, remember that many products in nascent stages of their life cycle may be comfortable there (in both the startup and long term maintenance of a stable product).Reliability phases in actionTo illustrate the reliability phases in practice, it is interesting to look at examples of organizations and how they have progressed or regressed through them.  It should be noted that all companies and teams are different and the progress through these phases can take varying amounts of time. It is not uncommon to take two to three years to move into a truly proactive state. In a proactive state all parts of the organization contribute to reliability without worrying that it will negatively impact feature velocity. Staying in the proactive phase also takes time and effort.Nobody can be a hero foreverOne infrastructure services team started small with a few well understood APIs. One key member of the team, a product architect, understood the system well and ensured that things ran smoothly by ensuring design decisions were sound and being at each major incident to rapidly mitigate the issue. This was the one person who understood the entire system and was able to predict what can and cannot impact its stability. But when they left the team, the system complexity grew by leaps and bounds. Suddenly there were many critical user-facing and internal outages. Organizational leaders initiated both short and long-term reliability programs to restore stability. They focused on reducing the blast radius and the impact of global outages. Leadership recognized that to sustain this trajectory, they recognized that they had to go beyond engineering solutions and implement cultural changes such as recognizing reliability as their number-one feature. This led to broad training around reliability best practices, incorporating reliability in architectural/design reviews and recognizing and rewarding reliability beyond hero moments. As a result, the organization evolved from a reactive to a strategic reliability mindset, aided by setting reliability as their number-one feature, recognizing and rewarding long-term reliability improvements, and adopting the systemic belief that reliability is everyone’s responsibility—not just that of a few heroes.If you think you are done, think againEnd users are highly dependent on the reliability of this product and it ties directly to user trust. For this reason, reliability was top of mind for one Google organization for years, and the product was held as the gold standard of reliability by other Google teams. The org was deemed visionary in its reliability processes and work. However, over the years, new products were added to the base service. The high level of reliability did not come as freely and easily as it did with the simpler product. Reliability was impacted at the cost of developer velocity and the organization moved to a more reactive reliability mindset.To turn the ship around, the organization’s leaders had to be intentional about their reliability posture and overall practices, for example, how much they thought about and prioritized reliability. It took several years to move the team back to a strategic mindset. Embrace reliability principles from the startAnother team with a new user-facing product was focused on adding features and growing their user base. Before they knew it, the product took off and saw exponential growth.Unfortunately, their laser-focus on managing user requirements and growing user adoption led to high technical debt and reliability issues. Since the service didn’t start off with reliability as a primary focus, it was very hard to incorporate it after the fact. Much of the code had to be re-written and re-architected to reach a sustainable state. The team’s leaders incentivized attention to reliability throughout the organization, from product management through to development and UX domains, constantly reminding the organization about the importance of reliability to the long-term success of the product. This mindshift took years to set in.ConclusionIt is important that cross-functional organizations be honest about their reliability journeys and determine what is appropriate for their business and product. It is not uncommon for organizations to move from one level to another and then back again as the product matures, stabilizes and then is sunset for the next generation. Getting to a strategic level can be 4+ years in the making and require very high levels of investment from all aspects of the business.  Leaders should ensure their product requires this level of continued investment.We encourage you to study your culture of reliability, assess what phase you are in, determine where you should be on the continuum and carefully and thoughtfully move there. Changing culture is hard and can not be done by edicts or penalties. Most of all, remember that this is a journey and the business is ever-evolving; you cannot set reliability on the shelf and expect it to maintain itself in perpetuity.Related ArticleAre we there yet? Thoughts on assessing an SRE team’s maturityExamining the key indicators that signal a mature SRE team.Read Article
Quelle: Google Cloud Platform
Understanding Cloud SQL maintenance: how do you manage it?

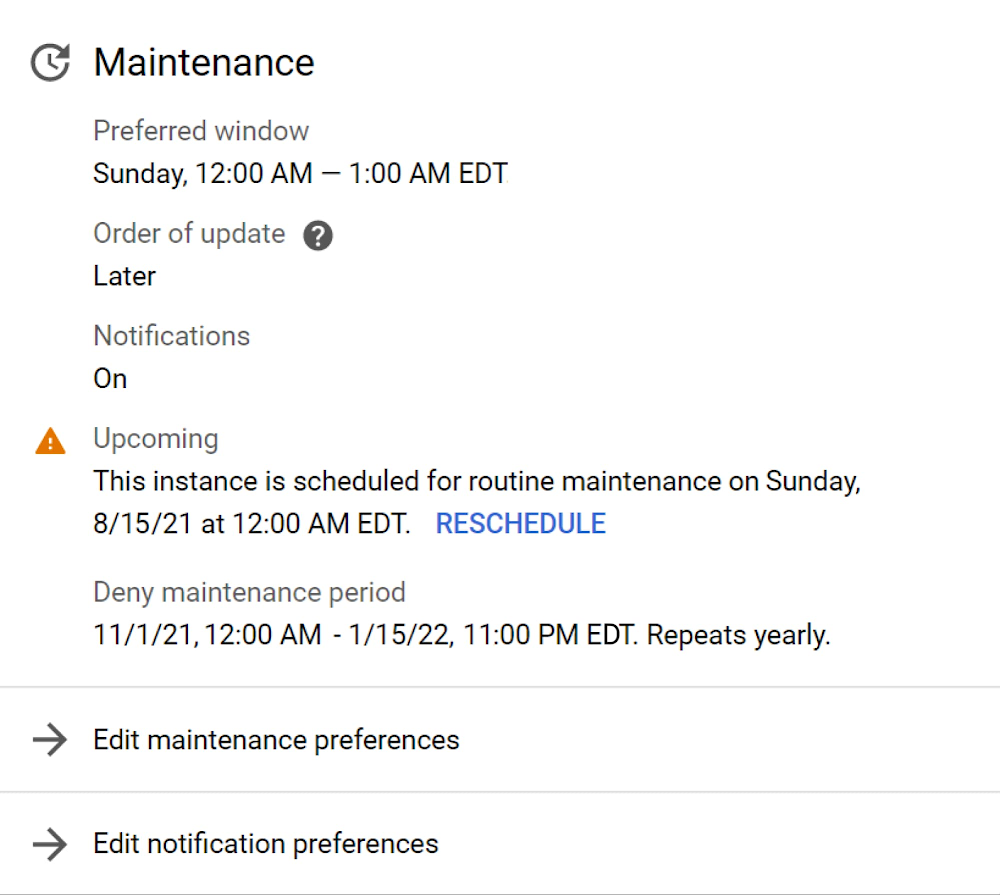
Picture this: you’ve just set up a mission-critical database on Cloud SQL and you’re excitedly preparing to turn on live traffic. As you go through your final launch checklist, you recall that Cloud SQL schedules routine maintenance. You pause to consider whether your system is set up properly to account for these maintenance updates.In Part 2 of this blog series, I walked step-by-step through the Cloud SQL maintenance process and explained how we designed our maintenance workflow to keep maintenance downtime as brief as possible. In Part 3 of this series, I’ll explain the settings you have to manage when maintenance is scheduled and how you can design your system to minimize application impact due to maintenance.What are the settings to manage maintenance?Some mission-critical services are especially sensitive to disruption–especially during peak times–no matter how short the interruption. You can configure maintenance to be scheduled at times when brief downtime will cause the lowest impact to your applications. For each instance, you can configure a maintenance window, an order of update, and a deny maintenance period.A maintenance window is a day of the week and the hour in which Cloud SQL will schedule maintenance during a rollout. Note that while maintenance can be scheduled to occur any time during the one-hour window, the maintenance update itself usually lasts less than a minute.Order of updatesets the order in which the Cloud SQL instance will get updated relative to other instances in the same region. Order of update can be set to Any, Earlier, or Later. Later instances are updated one week after Earlier instances in the same region.A deny maintenance period is a block of days in which Cloud SQL will not schedule maintenance. Deny maintenance periods can be up to 90 days long.I find that the usefulness of these settings is best illustrated with an example. Say you are a developer at an ecommerce store called BuyLots. You have one Cloud SQL instance for your production environment and a second for your development environment. You want maintenance to occur at the hour of lowest traffic, which occurs at midnight on Sundays. You also want to skip maintenance during BuyLots’ busy end-of-year holiday shopping season. On your production instance, you should set your instance’s maintenance window to Sundays between 12:00 AM and 1:00 AM ET, order of update to Later, and deny maintenance period to November 1 through January 15. See what this would look like on the maintenance card in the Instance Overview page in the Console in the example below:Maintenance settings exampleThe maintenance settings for your development environment instance would be identical, except for the order of update, which would be set to Earlier. This ensures that you can run operational acceptance tests of new maintenance releases on your development instance for 7 days before maintenance rolls out to the production instance. In the event something goes awry on your development environment instance, you have time to diagnose and fix the issue so that your production environment is unaffected. If necessary, you also have time to contact Cloud SQL support to get help handling the matter.How do maintenance notifications work?If you’re developing mission-critical services, you may need to plan for service interruption in advance. Perhaps you need to prepare customer support or communicate the maintenance window to your end users. You can opt to receive upcoming maintenance email notifications from the Communication page under User Preferences in the Console.Opting in to upcoming maintenance notificationsUpcoming maintenance email notifications are delivered to your Cloud Identity email address at least one week in advance of maintenance. These email addresses contain the name of the instance being maintained and the time of maintenance. Upcoming maintenance information is also posted in a banner at the top of the Instances List page and the instance’s Overview page in the Console.Viewing upcoming maintenance informationYou may occasionally have a conflict with the original maintenance time, or need more time to test a maintenance update in your development environment. In these cases, you can reschedule maintenance to occur immediately, at the next maintenance window one week after the originally scheduled time, or at any point in between. In the Console, you reschedule from the Instances List page or from the instance’s Overview page.escheduling maintenanceHow can an application be set up to minimize impact due to Cloud SQL maintenance?In general, we recommend that when you’re  running applications in the cloud, you build your systems to be resilient to transient errors, which are momentary inter-service communication issues caused by temporary unavailability. In Part 2, I highlighted some of the transient errors that occur during maintenance, such as dropped connections and failed in-flight transactions. As it turns out, users who have designed their systems and tuned their applications to be resilient to transient errors are also positioned to minimize impacts due to database maintenance.To minimize the impact of dropped connections, you can institute a connection pooler like pgbouncer or ProxySQL in between your application and the database. While the connections between the pooler and the database will be dropped during maintenance, the connections between the application and the pooler are preserved. That way, the work of reestablishing the connections is transparent to the application, offloaded to the connection pooler instead.To reduce the transaction failures, limit the number of long-running transactions. Use Query Insights to identify slow queries. Rewriting queries to be smaller and more efficient not only reduces maintenance downtime, but also improves database performance and reliability.To recover efficiently from connection drops and transaction failures, you can build connection and query retry logic with exponential back-off into your applications and connection poolers. In the event that a query fails or a connection is dropped, the system institutes a wait period before retrying, the duration of which increases for each subsequent retry. For example, the system may wait just a few seconds for the first retry, but up to a minute for the fourth retry. Following this pattern ensures that these failures are corrected, without overloading your service.There are many other creative solutions to minimize maintenance impacts as well, from using scripts to warm the database cache after maintenance to streamlining the number of tables in MySQL databases. We recommend following database management best practices to ensure that maintenance goes smoothly.—That’s a wrap for our Cloud SQL maintenance blog series! I hope you were able to learn more about what maintenance is, how we perform maintenance, and how to minimize maintenance impacts. If there’s something you didn’t see here, you’ll find the answer in our maintenance documentation. We are constantly investing in new improvements and settings for maintenance, so stay tuned to our release notes for the latest news. And if you’re new to Cloud SQL, get started with a new instance here.Related ArticleUnderstanding Cloud SQL Maintenance: how long does it take?A technical breakdown of the Cloud SQL maintenance workflow helps illuminate instance updates and downtime periodsRead Article
Quelle: Google Cloud Platform

2021 Accelerate State of DevOps report addresses burnout, team performance

Over the past seven years, more than 32,000 professionals worldwide have taken part in the Accelerate State of DevOps reports, making it the largest and longest-running research of its kind. Year over year, the Accelerate State of DevOps reports provide data-driven industry insights that examine the capabilities and practices that drive software delivery as well as operational and organizational performance. That is why Google Cloud’s DevOps Research and Assessment (DORA) team is very excited to announce our 2021 Accelerate State of DevOps Report. Our research continues to illustrate that excellence in software delivery and operational performance drives organizational performance in technology transformations. This year we also investigated the effects of SRE best practices, a secure software supply chain, quality documentation, and multicloud—all while gaining a deeper understanding of how this past year affected team’s culture and burnout.  Read below to find some of the new findings from this year’s report:Software delivery performance metricsBased on key findings from previous Accelerate State of DevOps reports, we again used four metrics to classify teams as elite, high, medium or low performers based on their software delivery: deployment frequency, lead time for changes, mean-time-to-restore, and change fail rate. This year we saw that elite performers continue to accelerate their pace of software delivery, increasing their lead time for changes from less than one day to less than one hour. Not only that, but elite performers deploy 973x more frequently than low performers, have a 6570x faster lead time to deploy, a 3x lower change failure rate, and an impressive 6570x faster time-to-recover from incidents when failure does happen. You read that right: compared to low performers, elite performers are continually able to empirically demonstrate organizational success with DevOps.The fifth metric: from availability to reliabilityHistorically we have measured availability rather than reliability, but because availability is a specific focus of reliability engineering, we’ve expanded our measure to reliability so that availability, latency, performance, and scalability are more broadly represented. Specifically, we asked respondents to rate their ability to meet or exceed their reliability targets. We found that teams with varying degrees of delivery performance see better outcomes when they also prioritize operational performance. 2021 insights: the impact of reliability, COVID and secure software supply chainsIn addition to measuring the impact of DevOps adoption on software delivery performance, this year’s DORA report also revealed many other new trends. Here’s a sampling. 1) A healthy team culture mitigates burnout during challenging timesRespondents who worked from home because of the pandemic experienced more burnout than those who stayed in the office (a small portion of our sample). Inclusive teams with a generative culture were half as likely to experience burnout during the COVID-19 pandemic. 2) The highest performers continue to raise the barFor the first time, high and elite performers make up two-thirds of respondents—compared to the 2019 report where low and medium performers made up 56% of respondents. We can confidently say that as the industry continues to accelerate its adoption of DevOps principles teams see meaningful benefits as a result.3) SRE and DevOps are complementary philosophies Extending from its core principles, Site Reliability Engineering (SRE) provides practical techniques, including the service level indicator/service level objective (SLI/SLO) metrics framework. The SRE framework offers definitions on practices and tooling that can enhance a team’s ability to consistently keep promises to their users. Teams that prioritize both delivery and operational excellence report the highest organizational performance. To investigate this, we included operations questions in the survey for the first time this year. The evidence from the survey indicated teams who excel at modern operational practices are 1.4 times more likely to report greater software delivery and operational (SDO) performance, and 1.8 times more likely to report better business outcomes.4) Cloud adoption continues to drive performanceTeams continue to move workloads to the cloud and those that leverage all five capabilities of cloud see increases in SDO performance, as well as in organizational performance. Multicloud adoption is also on the rise so that teams can leverage the unique capabilities of each provider. In fact, respondents who use hybrid or multicloud were 1.6 times more likely to exceed their organizational performance targets. 5) A secure software supply chain is both essential and drives performance Security can no longer be an afterthought—it must be integrated throughout every stage of the software development lifecycle to build a secure software supply chain. Elite performers who met or exceeded their reliability targets were twice as likely to have shifted their security practices left, i.e., implemented security practices earlier on in the software development lifecycle, and deliver reliable software quickly, and safely. 6) Good documentation is foundational for successfully implementing DevOps capabilitiesFor the first time, we measured the quality of internal documentation and its effect on other capabilities and practices. We found documentation is foundational for successfully implementing DevOps capabilities. Teams with high-quality documentation are 3.8x more likely to implement security best practices and 2.5x more likely to fully leverage the cloud to its fullest potential.Introducing the DevOps AwardsNow that we have shared some of our DevOps best practices with you, we would love to hear about how you are transforming your organization with DevOps. In our first annual DevOps Awards, we’ll recognize Google Cloud customers that have improved their deployment frequency, successfully shifted left on security, or improved their change fail rate percentage, etc. Tell us about the positive impact that DevOps has had on your teams, customers, and organization. Enter your submission here today!Thanks to everyone who took our 2021 survey. We hope this Accelerate State of DevOps report helps organizations of all sizes, industries, and regions improve their DevOps capabilities, and we look forward to hearing your thoughts and feedback. To learn more  about the report and implementing DevOps with Google cloud, check out the following resources:Download the reportTo find out more about how your organization stacks up against others in your industry, take theDevOps Quick CheckFor customized DevOps solutions for your organization, check out our newly launchedCAMP websiteLearn more about DevOps capabilities for elite performance
Quelle: Google Cloud Platform

What is Cloud Composer?

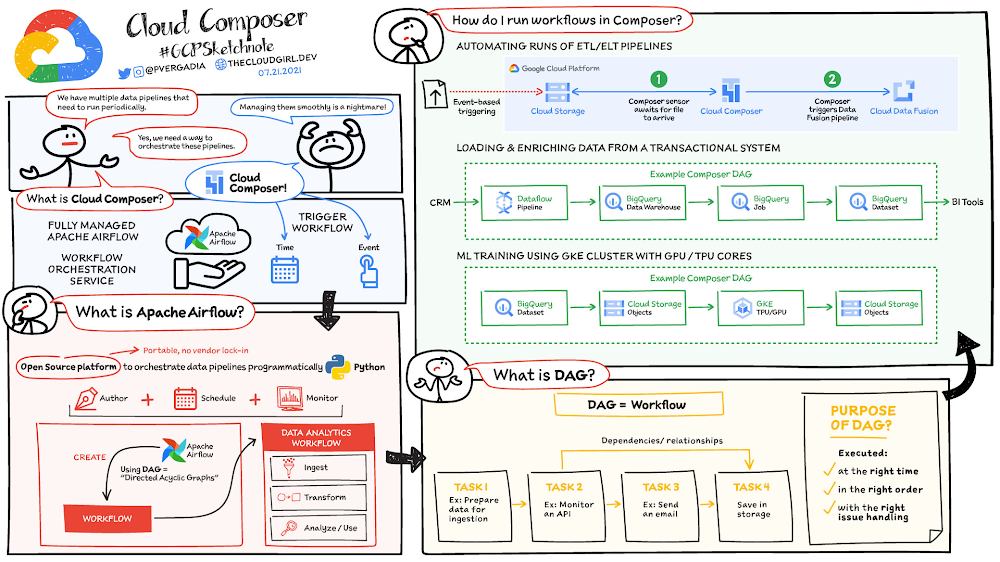
When you are building data pipelines, you need to manage and monitor the workflows in the pipeline and often automate them to run periodically. Cloud Composer is a fully managed workflow orchestration service built on Apache Airflow that helps you author, schedule, and monitor pipelines spanning hybrid and multi-cloud environments. By using Cloud Composer instead of managing a local instance of Apache Airflow, you can benefit from the best of Airflow with no installation, management, patching, and backup overhead because Google Cloud takes care of that technical complexity. Cloud Composer is also enterprise-ready and offers a ton of security features so you don’t have to worry about it yourself. Last but not least, the latest version of Cloud Composer supports autoscaling, which provides cost efficiency and additional reliability for workflows that have bursty execution patterns. How does Cloud Composer work? In data analytics, a workflow represents a series of tasks for ingesting, transforming, analyzing, or utilizing data. In Airflow, workflows are created using directed acyclic graphs (DAGs).A DAG is a collection of tasks that you want to schedule and run, organized in a way that reflects their relationships and dependencies. DAGs are created in Python scripts, which define the DAG structure (tasks and their dependencies) using code. The purpose of a DAG is to ensure that each task is executed at the right time, in the right order, and with the right issue handling.Each task in a DAG can represent almost anything—for example, one task might perform data ingestion, another sends an email, and yet another runs a pipeline.Click to enlargeHow to run workflows in Cloud Composer? After you create a Cloud Composer environment, you can run any workflows your business case requires.  The Composer service is based on a distributed architecture running in GKE and other Google Cloud services. You can schedule a workload at a specific time or you can start a workflow when a specific condition is met, for example when an object is saved to a storage bucket. Cloud Composer comes with built-in integrations to almost all Google Cloud products including BigQuery and Dataproc; it also supports integrations (enabled by provider packages from vendors) with applications running on-prem or on another cloud. Here is a list of built-in integrations and provider packages.   Cloud Composer security featuresPrivate IP: Using private IP means that the compute node in Cloud Composer is not publicly accessible and therefore is protected from the public internet. Developer can access the internet but cannot be accessed from outside. Private IP + Web Server ACLs: The user interface for Airflow is protected by authentication. Only authenticated customers can access the specific Airflow user interface. For additional network level security you can use web server access controls along with Private IP which helps limit access from the outside world by whitelisting a set of IP addresses. VPC Native Mode: In conjunction with other features VPC native mode helps limit access to Composer components in the same VPC network, keeping it protected.VPC Service Controls: Provides increased security by enabling you to configure a network service perimeter that prevents access from the outside world and also prevents access to the outside world.Customer Managed Encryption Keys (CMEK): Enabling CMEK lets you provide your own encryption keys to encrypt/decrypt environment data.Restricting Identities By Domain: This features enables you to restrict the set of identities that can access Cloud Composer environments to specific domain names, e.g.  @yourcompany.com.Integration with Secrets Manager: You can use a built-in integration with Secrets Manager to protect keys and passwords used by your DAGs for authentication to external systems.If you are building data pipelines, then you need to check out Cloud Composer for easy and fully managed workflow orchestration. For a more in-depth look into Cloud Composer check out the documentation.For more #GCPSketchnote, follow the GitHub repo. For similar cloud content follow me on Twitter @pvergadia and keep an eye out on thecloudgirl.dev.Related ArticleOrchestrating your data workloads in Google CloudThe Data Orchestration is becoming more important as workflows expand and become more complex on the Cloud. This blog touches on how to t…Read Article
Quelle: Google Cloud Platform
Introducing the new Cloud Storage trigger in Eventarc

Eventarc now supports a new Cloud Storage trigger to receive events from Cloud Storage buckets! Wait a minute. Didn’t Eventarc already support receiving Cloud Storage events? You’re absolutely right! Eventarc has long supported Cloud Storage events via the Cloud Audit Logs trigger. However, the new Cloud Storage trigger has a number of advantages and it’s now the preferred way of receiving Cloud Storage events. Let’s take a look at the details.As a recap, Eventarc has three types of triggers:Pub/Sub trigger to receive messages from new or existing Pub/Sub topics.Cloud Audit Logs trigger to receive Audit Logs from 100+ event sources. Cloud Storage trigger (new) to receive events from Cloud Storage buckets.Previously, the Audit Logs trigger was the only way to receive Cloud Storage events. Receiving Cloud Storage events with the Audit Logs triggerLet’s look at an example that uses the old Audit Logs trigger approach. Here’s an Audit Logs trigger that gets created in the europe-west1 region. It triggers when a new object is created in a Cloud Storage bucket in europe-west1 and the event is routed to a Cloud Run service in us-central1:This works but it has the following problems:Audit Logs enablement: For the Audit Logs trigger to work, you need to enable Audit Logs for Cloud Storage. Many users forget to do this.Latency: There’s a delay between when you save a file, when the Audit Logs event gets generated, and when the Cloud Run service receives the event. No filter by bucket in Audit Logs: You need to filter by bucket in your code instead.No dual-region or multi-region support: An Eventarc location can only be a single region or a special global region for all regions, whereas Cloud Storage supports bucket locations in single, dual, and multi regions. If you want to receive events from a multi-region bucket in the EU, you need to set the Eventarc location to global (since it’s not a single region). You will receive events from all regions and you’ll then need to filter by region in your code. Receiving Cloud Storage events with a Cloud Storage triggerHere’s how you can receive object creation events from a Cloud Storage bucket in  europe-west1 with the new Cloud Storage trigger:It is not only simpler than the Audit Logs trigger but better in the following ways:No Audit Logs means there’s no need to enable them and therefore there is no latency due to Audit Logs. When you create a file in the bucket, you see that event in the Cloud Run service almost immediately.Filter by bucket is supported. You don’t need to filter by bucket in your code, and Eventarc can perform sanity checks on your bucket’s location against the Eventarc trigger location.Dual-region and multi-region locations are supported. When working with more than one region, you no longer need to specify a  global location and then filter by region in your code.The new Cloud Storage trigger may be just what you’re looking for right now, or it might fill a need down the road. If you want to try it out, here are some resources:Quickstart: Receive events from Cloud StorageCreate a Cloud Storage trigger Codelab: Trigger Cloud Run with events from Eventarc Please reach out to me on Twitter @meteatamel for any questions or feedback.Related ArticleEventarc: A unified eventing experience in Google CloudEventarc provides a unified eventing experience in Google Cloud so you can send events to Cloud Run from more than 60 Google Cloud sources.Read Article
Quelle: Google Cloud Platform
Automate Application Migration with GKE Autopilot and Migrate for GKE

Many developers today are choosing to develop and deploy new greenfield applications on Google Kubernetes Engine (GKE). And it’s easy to understand why—GKE offers a great combination of scalability, security, and ease of use. However, what might surprise a lot of people is thatGKE is also often chosen to run existing brownfield workloads. For instance, applications that were previously deployed on virtual machines. Companies choose to migrate their workloads from VMs to containers for any number of reasons:Allow for greater agilityReduce licensing costs as well as operational costsMove off of end of life operating systemsAnd many moreIn this blog we want to talk about what might be the absolute easiest way to take workloads running on virtual machines and migrate them to Kubernetes. By leveraging the latest version of Migrate for GKE, customers can move an application from any one of several different VM platforms to GKE Autopilot. In this scenario customers benefit from both an automated migration process and a managed Kubernetes cluster. The combination of these two technologies drastically reduce manual processes associated with modernizing and hosting your legacy applications. What is GKE AutopilotGKE Autopilot is a mode of operation for GKE clusters that drastically reduces the amount of management overhead associated with running a Kubernetes cluster. Creating a GKE Autopilot cluster requires just a few clicks. The resulting cluster is pre-configured with an optimized configuration that is ready for production workloads. This streamlined configuration follows GKE best practices and recommendations for cluster and workload setup and securityOnce the cluster is deployed, much of the ongoing management is offloaded to Google Cloud. For instance, you no longer have to worry about scaling your worker nodes to handle increased demand. GKE Autopilot will automatically scale as needed, but you only pay for the actual resources, memory and CPU, you consume. In contrast, under a standard mode GKE Cluster you pay for the nodes you’ve provisioned, regardless of actual utilization. To learn more about GKE Autopilot check out the documentation or watch this video.What is Migrate for Anthos and GKEMigrate for Anthos and GKE is a free tool from Google Cloud that automates the migration of workloads from virtual machines to Kubernetes. The source VMs can be running on-prem on VMWare, or on AWS, Azure or Google Cloud. In order to ensure that you’re targeting the right workloads, Migrate for GKE includes a fit assessment tool that will examine a given VM and produce a report on whether or not the application is a good candidate for migration. You can read more about planning best practices in our documentation. Migrate for GKE will automatically examine your VMs and extract the core components necessary to run the application. After examining the VM, Migrate will produce a Dockerfile, Docker image, and a Kubernetes deployment YAML so you can seamlessly deploy your application. For more information on the core capabilities of Migrate for Anthos and GKE check out this overview video.Using GKE Autopilot and Migrate for GKE togetherWith the release of Migrate for Anthos and GKE 1.8 a new feature was released via public preview to produce containers that don’t require elevated privileges, allowing those containers to be deployed on GKE Autopilot clusters. And, best of all, it only requires a single line in the migration YAML file to enable this new feature. Once you’ve created your migration plan, all you need to do is set  v2kServiceManager to true under the spec section.For example:By setting the v2kServiceManager variable, your resulting container can be deployed without further modification to GKE Autopilot. Not only that, but that same container could be deployed to Cloud Run as well. And, of course, it would also work on standard mode GKE clusters. If you’d like to see a demo of Migrate for Anthos and GKE working with GKE Autopilot, check out the following video.Related ArticleClosing the gap: Migration completeness when using Database Migration ServiceLearn what is and isn’t included when migrating a MySQL database to Cloud SQL using Database Migration Service (DMS).Read Article
Quelle: Google Cloud Platform
Optimizing Waze ad delivery using TensorFlow over Vertex AI

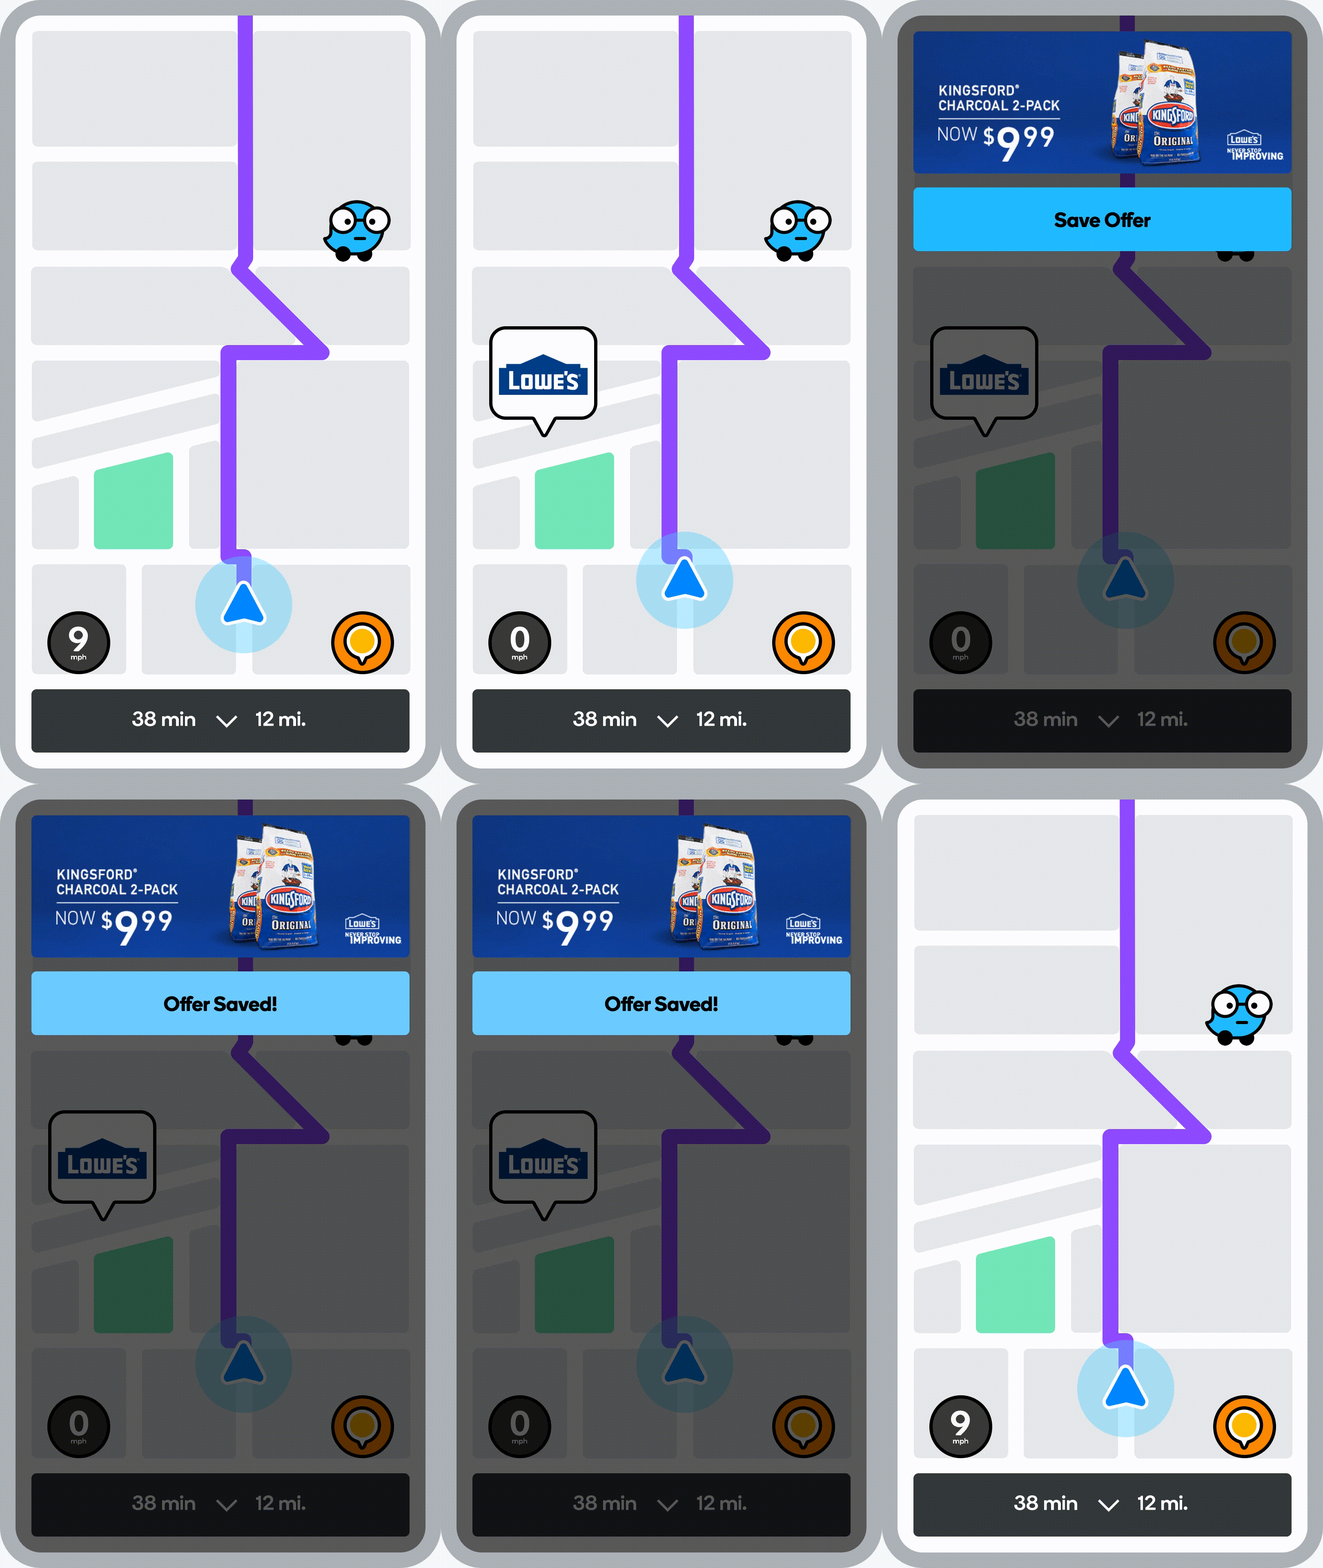
Waze AdsWaze is the world’s largest community-based traffic and navigation app. As part of its offering, it lets advertisers put their businesses on the Waze map. By doing so, ads on Waze will reach consumers at key moments of their journey. Goals for advertising on Waze include getting customers to business locations, building brand awareness, and connecting with nearby customers at the right moments.Waze uses several ad formats, the most prominent of which is called a “Pin”. Like a store sign, Pins inform and remind customers that a business is on or near their route.Ad Serving @WazeWaze Ads is a reservation platform, which means we commit to a fixed number of ad impressions in advance and then attempt to meet expected delivery based on the actual drives that occur. It is important to note that Waze only shows ads to users in a certain proximity to the advertised business location. Our ads inventory is thus highly correlated with traffic patterns – i.e. where and when people drive with Waze. After we set up an ads campaign, we choose the right time and place so we deliver on our commitment to the advertisers. We also have a planning tool to predict the quantity of sellable ads inventory based on traffic patterns and campaign setup, but that’s something for a different blog post :)Following a locked and launched advertising campaign, “the life of a Waze ad” looks something like this:Mobile client connects to server and “asks for pins to show” [Every few minutes for saving battery – this is important for what comes next]Ad server gets request and scans for a list of candidate pins which advertise businesses in a certain proximity to the user’s locationAd server ranks (and logs) all candidates according to internal logic (e.g. distance)Mobile client gets a ranked list and saves it for later use[Over the next few minutes] – map is shown on screen and client logic has the opportunity to show a pin adMobile client scans the ranked list and displays a suitable number of pins that can fit the map on the user’s screen and are appropriate for its zoom levelMobile client logs successfully displayed adsDid you catch the issue in step 6?Waze is a navigation app, meaning the user is driving!The user’s visible map on screen constantly changes based on their destination, speed, traffic pattern, etc. These screen changes and alignments are important for providing the best user experience while navigating.Upon performing a funnel-like drop analysis, we’ve noticed that step 6, although optimized for distance from the user (step 2) is a place where we lose ads in the funnel. Moreover, the effectiveness of the mobile client to find pins to display (step 6) is a direct result of the ads we choose to send to it (step 3). By making ad ranking (step 3) smarter, we can seamlessly unlock additional pin ads inventory, which would ensure Waze could better uphold its delivery commitments.What would that include though? Predicting where the user is going? Predicting where they’ll be in the next few minutes?Unlocking lost inventory using MLGoogle’s CEO (Sundar Pichai) once said: “Machine learning is a core, transformative way by which we’re rethinking how we’re doing everything”As you can imagine, we’ve naturally approached solving this problem with ML.The problem can easily be formulated as a learning to rank ML problem where we rank candidate ads to maximize the likelihood of ads to be displayed in the mobile client.We can debate the exact optimization goal, but ultimately when we create a list that should serve the mobile client for the next few minutes, we want to meet expected ad delivery (given an even sized candidate list) in that time window.Maximizing Display ProbabilityBy matching the ad server’s logged candidates with the mobile client’s successfully displayed ads, we can create a labeled dataset to be used for supervised learning.As mentioned before, a successful display is based on whether the user’s screen in the next few minutes (after getting the candidate list) will include candidate locations. To optimize that, we need to know the user’s current location, destination, current route (suggested by Waze to follow) and the locations of all candidate pins. We translate the above information to several features to be used in a supervised model.The trained model assigns probabilities for pins to be displayed in real time, which are taken into account in ranking. Note that they are not the sole contributor for ad ranking, as we still have multiple goals in choosing the right ad to show – (e.g. user relevance).We chose to use TensorFlow to power this model. We were motivated by our requirement to perform complex feature engineering on numeric (mostly distance-based) features and our extreme scale requirements to power a real time ad serving use case with millions of predictions per second and a strict requirement on < 70ms end to end latency. As avid GCP users, we’ve used the Vertex AI suite to train and deploy this TF model and easily integrate with the rest of our data stack. The resulting architecture looks something like this:It is worth saying that the above diagram including the clean separation of concerns (based on FCDS philosophy) took a few iterations for us to achieve. We first started with an offline model deployed to Vertex AI models and rigorous A/B testing to demonstrate value before going for full productionization and automation (using TensorFlow Extended (TFX) over Vertex Pipelines) of this flow.ResultsWe launched our integration with Vertex AI to power our display probability model in late 2020. With the display probability score incorporated into ad ranking we observed a lift of up to 19% in pins displayed per session in large markets including the US, Brazil, and France! Vertex AI delivered low latency predictions within our performance parameters and CPU based autoscaling ensured smooth scaling of additional resources as ads traffic changed throughout the day. SummaryBy using ML to rank the display probability of candidate ads we were able to increase the number of reserved impressions delivered per session, helping us keep our delivery commitments to advertisers.  There were many complexities involved in running ML at this scale in Waze. But luckily, thanks to Vertex AI we didn’t have to worry much about scale, latency, or devops and could focus on the ranking side. This was the first integration of such scale at Waze, and it paved the way for many more use cases in Ads, ETA modeling, drive suggestions and more. It allowed Waze to justify going all in on using TFX in Vertex AI.
Quelle: Google Cloud Platform

What type of data processing organization are you?

Every organization has its own unique data culture and capabilities. Yet each is expected to use technology trends and solutions in the same way as everyone else. Your organization may be built on years of legacy applications, you may have developed a considerable amount of expertise and knowledge, yet you may be asked to adopt a new approach based on a technology trend. On the other hand, you may be on the other side of the spectrum, a digitally native organization built with engineering principles from scratch without legacy systems but expected to follow the same principles as process driven, established organizations. The question is, should we treat these organizations in the same way when it comes to data processing? In this series of blogs and papers this is what we are exploring: how to set up an organization from the first principles from data analyst, data engineering and data science point of view. In reality, there is no such organization that is solely driven by one of these but it is likely to be a combination of multiple types. What type of organization you become is then driven by how much you are influenced by each of these principles. When you are considering what data processing technology encompasses, take a step back and make a strategic decision based on your key goals. This can be whether you optimize for performance, cost, reduction in operational overhead, increase in operational excellence, integration of new analytical and machine learning approaches. Or perhaps you’re looking to leverage existing employees’ skills while meeting all your data governance and regulatory requirements. We will be exploring these different themes and will focus on how they guide your decision-making process. You may be coming from technologies which are solving some of the past problems and some of the terminologies may be more familiar, however they don’t scale your capabilities. There is also the opportunity cost of prioritizing legacy and new issues that arise from a transformation effort, and as a result your new initiative can set you further behind on your core business while you play catch up to an ever changing technology landscape. Data value chainThe key for any ingestion and transformation tool is to extract data from a source and start acting on it. The ultimate goal is to reduce the complexity and increase the timeliness of the data. Without data, it is impossible to create a data driven organization and act on the insights. As a result, data needs to be transformed, enriched, joined with other data sources, and aggregated to make better decisions. In other words, insights on good timely data mean good decisions.While deciding on the data ingestion pipeline, one of the best approaches is to look into the volume of data, the velocity of the data, and type of data that is arriving. Other considerations include the number of different data sources you are managing, whether you need to scale to thousands of sources using generic pipelines, whether you want to create one generic pipeline but then apply data quality rules and governance. ETL tools are ideal for this use case as generic pipelines can be written and then parameterized. On the other hand, consider the data source. Can the data be directly ingested without transforming and formatting the data? If the data does not need to be transformed and can be ingested directly into the data warehouse as a managed solution. This not only reduces the operational costs but also allows for more timely data delivery. If the data is coming in through an unstructured format such as XML or in a format such as EBCDIC and needs to be transformed and formatted, then a tool with ETL Capabilities can be used depending on the speed of the data arrival. It is also important to understand the speed and time of arrival of the data. Think about your SLAs and time durations/windows that are relevant for your data ingestion plans. This would not only drive the ingestion profiles but would also dictate which framework to use. As discussed above, velocity requirements would drive the decision-making process.Type of OrganizationDifferent organizations can be successful by employing different strategies based on the talent that they have. Just like in sports, each team plays with a different strategy with the ultimate goal of winning. Organizations often need to decide on what’s the best strategy to take in respect to data ingestion and processing – whether you need to hire an expensive group of data engineers, or exploit your data wizards and analysts to enrich and transform data that can be acted on, or whether it would be more realistic to train the current workforce to do more functional/high value work rather than to focus on building generally understood and available foundational pieces.On the other hand, the transformation part of ETL pipelines as we know it, dictates where the load will be. All of these are made a reality in the cloud native world where data can be enriched, aggregated, and joined. Loading data into a powerful and modern data warehouse means that you can already join and enrich the data using ELT. Consequently, ETL isn’t really needed in its strict terms anymore if the data can be loaded directly into the data warehouse.All of the above was not possible in the traditional, siloed, and static data warehouses and data ecosystems whereby systems would not talk to each other or there were capacity constraints in respect to both storing and processing the data in the expensive Data Warehouse. This is no longer the case in the BigQuery world as storage is now cheap and transformations are now much more capable without constraints of virtual appliances. If your organization is already heavily invested into an ETL tool, one option is to use them to load BigQuery and transform the data initially within the ETL tool. Once the as-is and to-be are verified to be matching, then with the improved knowledge and expertise one can start moving workloads into BigQuery SQL, and effectively do ELT. Furthermore, if your organization is coming from a more traditional data warehouse that extensively relies on stored procedures and scripting, then the question that one may ask is, do I continue leveraging these skills and expertise and use these capabilities that are also provided in BigQuery? ELT with BigQuery is more natural, similar to what’s already in Teradata BTEQ, Oracle PL/SQL but migrating from ETL to ELT requires changes. This change then enables exploiting streaming use cases, such as real-time use cases in retail. This is because there is no preceding step before data is loaded and made available.Organizations can be broadly classified under 3 types as Data Analyst Driven, Data Engineering driven, and Blended organization. We will be covering a Data Science driven organization within the Blended category.   Data Analyst DrivenAnalysts understand the business and are used to using SQL/spreadsheets. Allowing them to do advanced analytics through interfaces that they are accustomed to enables scaling. As a result, easy to use ETL tooling to bring data quickly into the target system becomes a key driver. Ingesting data directly from a source or staging area then also becomes critical as it allows analysts to exploit their key skills using ELT and increases timeliness of the data. This is commonplace with traditional EDWs and realized by extended capabilities of using Stored Procedures and Scripting. Data is enriched, transformed, and cleansed using SQL and ETL tools act as the orchestration tools. The capabilities brought by cloud computing on separation of data and computation changes the face of the EDW as well. Rather than creating complex ingestion pipelines, the role of the ingestion becomes, bringing data close to the cloud, staging on a storage bucket or on a messaging system before being ingested into the cloud EDW. This then releases data analysts to focus on looking into data insights using tools and interfaces that they are accustomed to. Data Engineering / Data Science Driven Building complex data engineering pipelines is expensive but enables increased capabilities. This allows creating repeatable processes and scaling the number of sources. Once complemented with cloud it enables agile data processing methodologies. On the other hand, data science organizations allow carrying out experiments and producing applications that work for specific use cases but are not often productionised or generalized. Real-time analytics enables immediate responses and there are specific use cases where low latency anomaly detection applications are required to run. In other words, business requirements would be such that it has to be acted upon as the data arrives on the fly. Processing this type of data or application requires transformation done outside of the target.All the above usually requires custom applications or state-of-the-art tooling which is achieved by organizations that excel with their engineering capabilities. In reality, there are very few organizations that can be truly engineering organizations. Many fall into what we call here as the blended organization.  Blended orgThe above classification can be used on tool selection for each project. For example, rather than choosing a single tool, choose the right tool for the right workload, because this would reduce operational cost, license cost and use the best of the tools available. Let the deciding factor be driven by business requirements: each business unit or team would know the applications they need to connect with to get valuable business insights. This coupled with the data maturity of the organization would be the key to making sure the right data processing tool would be the right fit. In reality, you are likely to be somewhere on a spectrum. Digital native organizations are likely to be closer to being engineering driven, due to their culture and business that they are in. However, brick and mortar organizations would be closer to being analyst driven due to the significant number of legacy systems and processes they possess. These organizations are either considering or working toward digital transformation with an aspiration of having a data engineering / software engineering culture like Google. The blended organization with strong skills around data engineering, would have built the platform and built frameworks, to increase reusable patterns would increase productivity and then reduce costs. Data engineers focus on running Spark on Kubernetes whereas infrastructure engineers focus on container work. This in turn provides unparalleled capabilities as application developers focus on the data pipelines and even the underlying technologies or platforms changes code stays the same. As a result, security issues, latency requirements, cost demands and portability are addressed at multiple layers. Conclusion – What type of organization are you?Often an organization’s infrastructure is not flexible enough to react to a fast changing technological landscape. Whether you are part of an organization which is engineering driven or analyst driven, organizations frequently look at technical requirements that inform which architecture to implement. But a key, and frequently overlooked, component needed to truly become a data-driven organization is the impact of the architecture on your data users. When you take into account the responsibilities, skill sets, and trust of your data users, you can create the right data platform to meet the needs of your IT department as well as your business.To become a truly data-driven organization, the first step is to design and implement an analytics data platform that meets your technical and business needs. The reality is that each organization is different and has a different culture, different skills, and capabilities. Key is to leverage its strengths to stay competitive while adopting new technologies when it is needed and as it fits to your organization. To learn more about the elements of how to build an analytics data platform depending on the organization you are, read our paper here.Related ArticleJust released: The Google Cloud Next session catalog is live. Build your custom playlists.Google Cloud Next session catalog is liveRead Article
Quelle: Google Cloud Platform

Recommendations AI data ingestion

In our previous post, we presented a high-level picture of Recommendations AI, showing how the product is typically used. In this post, we’ll take a deep dive into the first step of getting started, which is data ingestion. This post will answer all your questions on getting your data into Recommendations AI so you can train models and get recommendations.Recommendations AI uses your product catalog and user events to create machine learning models and deliver personalized product recommendations to your customers. Essentially, Recommendations AI uses a list of items available to be recommended (product catalog) and user’s interactions with those products (events), allowing you to create various types of models (algorithms specifically designed for your data) to generate predictions based on business objectives (conversion rate, click through rate, revenue).Recommendations AI is now part of the Retail API which uses the same product catalog and event data for several Google Retail AI products, like Retail Search.Catalog dataTo get started with Recommendations AI, you will first need to upload your data, starting with your complete product catalog. The Retail API catalog is made up of product entries. Take a look at the full Retail Product schema to see what can be included in a product. The schema is shared between all Retail Product Discovery products, so once you upload a catalog it can be used for Recommendations AI and Retail Search. While there are a lot of fields available in the schema, you can start with a small amount of data per product – the minimal required fields are: id, title, categories. We recommend submitting description and price as well as any custom attributes as well.Catalog levelsBefore uploading any products you may also need to determine which product level to use. By default, all products are “primary”, but if you have variants in your catalog you may need to change the default ingestion behavior. If your catalog has multiple levels (variants), you need to determine if you want to get recommendations back at the primary (group) level or at the variant (sku) level, and also if the events are sent using the primary id or the variant ids. If you’re using Google Merchant Center, you can easily import your catalog directly (see below).  In Merchant Center, the item grouping is done using item_group_id. If you have variants, and you’re not ingesting the catalog from Merchant Center, you just need to make sure your primaryProductId is set appropriately and you set ingestionProductType as needed before doing your initial catalog import.1. Catalog importThere are several ways to import catalog data into Retail API:a. Merchant Center syncMany retailers use Google Merchant Center to upload their product catalogs in the form of product feeds. These products can then be used for various types of Google Ads and for other services like Google Shopping and Buy on Google. But another nice feature of Merchant Center is the ability to export your products for use with other services – BigQuery for example.The Merchant Center product schema is similar to the Retail product schema, so the minimum requirements are met if you do want to use Merchant Center to feed your Retail API product catalog.The easiest way to import your catalog from Merchant Center is to set up a Merchant Center Sync in the Retail Admin Console:Simply go to the Data tab and select Import at the top of the screen. Then as the Source of data select Merchant Center Sync. Add your Merchant Center account # and select a branch to sync to.While this method is easy, there are some limitations. For example, if your Merchant Center catalog is not complete, you won’t be able to add more products directly to the Recommendations catalog – you would need to add them to the merchant center feed and they would then get synced to your Recommendations catalog. This may be easier than maintaining a separate feed for Recommendations however, as you can easily add products to your Merchant Center feed and simply leave them out of your Ads destinations if you don’t want to use them for Ads & Shopping.Another limitation of using Merchant Center data is that you may not have all of the attributes that you need for Recommendations AI. Size, Brand, Color are often submitted to Merchant Center, but you may have other data you want to use for Recommendations model data.Also, you are only able to enable a sync to a catalog branch that has no items. So if you have existing items in the catalog, you would need to delete them all first. b. Merchant Center import via BigQueryAnother option that provides a bit more flexibility is to export your Merchant Center catalog to BigQuery using the BigQuery Data Transfer Service. You can then bulk import that data from BigQuery directly into the Retail API catalog. You are still somewhat limited by the merchant center schema, but it is possible to add additional products from other sources to your catalog (unlike MC Sync which doesn’t allow updating the branch outside of the sync).The direct Merchant Center sync in a) is usually the simplest option, but if you already have a BigQuery DTS job or want to control exactly when items are imported, then this method may be a good option. You also have the flexibility to use a BigQuery view, so you could limit the import to a subset of the Merchant Center data if necessary – a single language or variant to avoid duplicate items for example. Likewise, you could also use unions or multiple tables to import from different sources as necessary.c. Google Cloud Storage importIf your catalog resides in a database or if you need to pull product details from multiple sources, doing an import from GCS may be your easiest option. For this option, you simply need to create a text file with one product per line (typically referred to as NDJSON format)  in the Retail AI JSON Product Schema. There are a lot of fields in the schema, but you can usually just start with the basics. So a very basic sample to import 2 items from a GCS file might look like this:d. BigQuery importJust as you can import products from BQ in the merchant center schema, you can also create a BigQuery table using the Retail product schema. The product schema definition for BigQuery is available here. The Merchant Center Big Query schema can be used whether or not you transfer the data from Merchant Center, but it is not the full schema for retail. It doesn’t include custom attributes for example. So using the Retail Schema allows you to import all possible fields.Importing from BigQuery is useful if your product catalog is already in BigQuery. You can also create a view that matches the Retail schema, and import from the view, pulling data from existing tables as necessary.For Merchant Center, Cloud Storage and BigQuery imports, the import itself can be triggered through the Admin Console UI, or via the import API call. When using the API, the schema needs to be specified with the dataSchema attribute as product or product_merchant_center accordingly.e. API import & product managementYou can also import and modify catalog items directly via API. This is useful to make changes to products in realtime for example, or if you want to integrate with an existing catalog management system. The inline import method is very similar to GCS import: you simply construct a list of products in the Retail Schema format, and call the products.import method API to submit the products. Like with GCS, existing products are overwritten and new products are created. Currently the import method can import up to 100 products per call.There is also the option to manage products individually with the API, using get, create, patch, and delete methods.All of the API calls can be done using HTTP/REST or gRPC, but using the retail client libraries for the language of your choice may be the easiest option. The documentation currently has many examples using curl with the REST API, but the client libraries are usually preferred for production use.2. Live user eventsOnce your catalog is imported you’ll need to start sending user events to the Retail API. Since recommendations are personalized in real-time based on recent activity, user events should be sent in real-time as they are occurring. Typically, you’ll want to start sending live, real-time events and then optionally backfill historical events before training any  models.There are currently 4 event types used by the Recommendations AI models:detail-page-viewadd-to-cartpurchase-completehome-page-viewNot all models require all of these events, but it is recommended to send all of these if possible.Note the “minimum required” fields for each event. As with the product schema, the user event schema also has many fields, but only a few are required. A typical event might looks like this:There are 3 ways you can send live events to Recommendations:a. Google Tag ManagerIf you are already using Google Tag Manager and are integrated with Google Analytics with Enhanced Ecommerce, then this will usually be the easiest way to get real-time events into the Retail API. We have provided a Cloud Retail tag in Google Tag Manager that can easily be configured to use the Enhanced Ecommerce data layer, but you can also populate the cloud retail data layer, and use your own variables in GTM to populate the necessary fields. Detailed instructions for setting up the cloud retail tag can be found here. Set up is slightly different depending on if you are using GA360 or regular Google Analytics, but essentially you just need to provide your Retail API key, project number, and then set up a few variable overrides to get visitorId, userId and any other fields that aren’t provided via Enhanced Ecommerce.The Cloud Retail Tag doesn’t require Google Analytics with Enhanced Ecommerce, but you will need to populate a data layer with the required fields or be able to get the required data fields GTM variables or existing data layer variables. A typical Cloud Retail tag configuration in GTM might look something like this:b. JavaScript pixelIf you’re not currently using Google Tag Manager, an easy alternative is to add our JavaScript pixel to the relevant pages on your site. Usually this would be the home page, product details pages and cart pages.Configuring this will usually require adding the javascript code along with the correct data to a page template. It may also require some server-side code changes depending on your environment.c. API write methodAs an alternative to GTM or the tracking pixel which sends events directly from the user’s browser to the Retail API, you can also opt to send events server-side using the userEvents.write API method. This is usually done by service providers that want to have an existing event handling infrastructure in their platform.3. Historical eventsAI models tend to work best with large amounts of data. There are minimum event requirements for training Recommendations models, but it is usually advised to submit a year’s worth of historical data if available. This is especially useful for retailers with high seasonality. For a high-traffic site, you may gather enough live events in a few days to start training a model, even so it’s usually a good idea to submit more historical data. You’ll get higher quality results without having to wait for events to stream in over weeks or months.Just like the catalog data, there are several ways to import historical event data:a. GA360 importIf you are using GA360 with Enhanced Ecommerce tracking you can easily export historical data into BigQuery and then import directly into the Retail API. Regular Google Analytics does not have an export functionality, but GA360 does. Using this export feature you can easily import historical events from GA360 into Retail API.b. Google Cloud Storage importIf you have historical events in a database or logs you can also write them out to files in NDJSON format and import those files from Cloud Storage. This is usually the easiest method of importing large number of events, since you simply have to write JSON to text files and then they can be imported directly from Google Cloud Storage.Just as with catalog import, the lines in each file simply need to be in the correct JSON format, in this case the JSON event format.The import can be done with the API, or in the cloud console UI, simply enter the GCS bucket path for your file:c. BigQuery importEvents can be read directly from BigQuery in the Retail Event Schema or in GA360 Event Schema. This method is useful if you already have events in BigQuery, or prefer to use BigQuery instead of GCS for storage.Since each event type is slightly different, it may be easiest to create a separate table for each event type.As with the GCS import, the BigQuery import can also be done using the API or in the cloud console UI by entering the BigQuery table name.d. API import & writeThe userEvents.write method used to do realtime event ingestion via API can also be used to write historical events. But for importing large batches of events the userEvents.import method is usually a better choice since it requires less API calls. The import method should not be used for real-time event ingestion since it may add additional processing latency.Keep in mind that you should only have to import historical events once, so the events in BigQuery or Cloud Storage can usually be deleted after importing. The Retail API will de-duplicate events that are exactly the same if you do accidentally import the same events.4. Catalog & event data qualityAll of the methods above will return errors if there are issues with the products or events in the request. For the inline and write methods errors will be returned immediately in the API response. For the BigQuery, Merchant Center & Cloud Storage imports error logs can be written to a GCS bucket, and there will be some details in the Admin Console UI. If you look at the Data section in the Retail Admin Console UI there are a number of places to see details about the Catalog data:The main Catalog tab shows the overall catalog status. If you click the VIEW link for Data quality you will see some more detailed metrics around key catalog fields:You can also click the Import Activity or Merchant Center links on the top of the page to view the status of the past imports or change your Merchant Center linking (if necessary).Commonly seen errorsBy far the most important metric is “Unjoined Rate”. An “unjoined” event is one in which we received an item id that was not in the catalog. This can be caused by numerous factors: outdated catalog, errors in event ingestion implementation, perhaps the events are for variant id’s but the catalog only has primary id’s, etc. To view the event metrics click on the Data > Event tab:Here you can see various errors over time. Clicking on the error will take you into cloud logging where you can see the full error response and determine exactly why a specific error occurred.Training modelsOnce your catalog & events are imported you should be ready to train your first model. Check the Data > Catalog & Data > Event tabs as shown above. If your catalog item count has the correct number of in-stock items for your inventory, the total number of events ingested, unjoined rate, and days with joined events are sufficient, you should be ready to train a model.Tune in for our next post for more details!Related ArticleHow to get better retail recommendations with Recommendations AIRecommendations AI is a solution that uses machine learning to bring product recommendations to their shoppers across any catalog or clie…Read Article
Quelle: Google Cloud Platform