How Confidential Space and multi-party computation can help manage digital assets more securely and efficiently

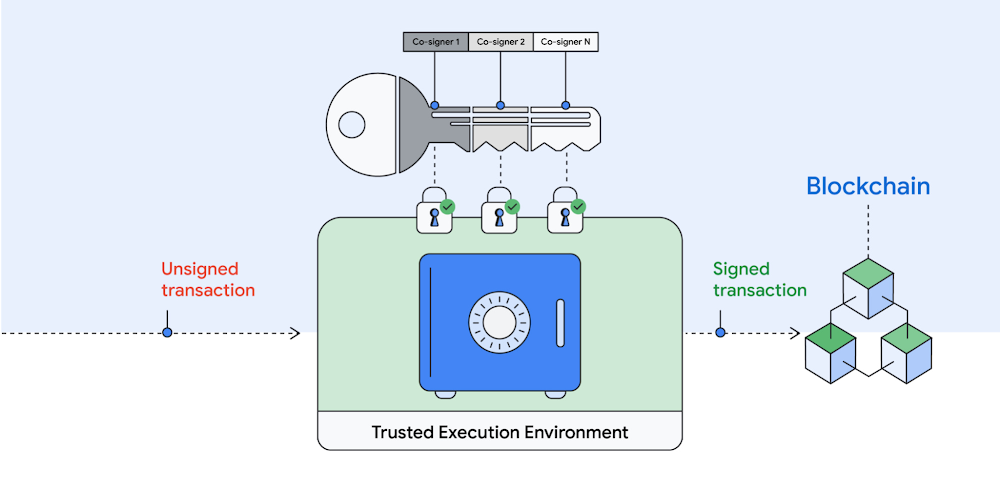
Managing digital asset transactions and their often-competing requirements to be secure and timely can be daunting. Human errors can lead to millions in assets being instantly lost, especially when managing your own encryption keys. This is where multi-party computation (MPC) can help reduce risk stemming from single points of compromise and facilitate instant, policy-compliant transactions. MPC has proven valuable to help secure digital asset transactions because it can simplify the user experience, and it can create operational efficiencies, while users retain control over their private keys. Google Cloud customers can implement MPC solutions with our new Confidential Space, which we introduced at Google Cloud Next in October. MPC enabled by Confidential Space can offer many benefits to safely manage and instantly transact digital assets:Digital assets can be held online without requiring cold storage.You can use an institutional-grade custody solution without having to give up control of your private keys.  Distributed parties can participate in a signing process that is both auditable and policy-compliant.All parties can produce their signatures while not exposing secret material to other parties, including the MPC platform operator.An individual private key represents a single point of failure in the digital asset custody and signing process. In an MPC-compliant model, an individual private key is replaced with distributed key shares. Each key shareholder collaborates to sign a transaction, and all actions performed by all parties are logged for offline auditing. No key holder exposes their key share to another key holder or to the platform operator. Unlike multi-signature, a single private key is not assembled or stored anywhere.Figure 1 – Multi-Party Computation for transacting digital assets.An attacker coming from outside the organization would need to compromise multiple parties across multiple distributed operating environments in order to get access to a key that can sign a transaction. MPC is resistant to insider attacks against the platform operator or key holder because no single key can sign a transaction and the operator can not access the key. Since multiple parties must come together to approve and sign each transaction, MPC-based digital asset custody solutions can better facilitate governance. The solutions provide the ability to create and enforce policies that control who must approve transactions. This prevents a single malicious insider from stealing assets, including the party that owns the workload or a workload operator. Because Confidential Space is built on our Confidential Computing platform, it leverages remote attestation and AMD’s Secure Encrypted Virtualization (SEV). This allows us to offer a more secure environment, fast performance, and seamless workload portability. This foundation can enable the MPC operator and co-signer workloads to run in a Trusted Execution Environment (TEE). Co-signers can have control over how their keys are used and which workloads are authorized to act on them. Finally, with the hardened version of Container-Optimized OS (COS), Confidential Space blocks the workload operator from influencing the signing workload.Deploying MPC on Confidential Space provides the following differentiated benefits:Isolation: Ensures that external parties cannot interfere with the execution of the transaction signing process.Confidentiality: Ensures that the MPC platform operator has no ability to access the key material.Verifiable attestations: Allows co-signers to verify the identity and integrity of the MPC operator’s workload before providing a signature.“MPC solutions will become increasingly essential as blockchains continue to support more critical infrastructure within the global financial system,” said Jack Zampolin, CEO of Strangelove Labs.“As a core developer building and hosting critical infrastructure in the rapidly growing Cosmos ecosystem, MPC-compliant systems are an important focus area for Strangelove. We are excited to expand our relationship with Google Cloud by building out key management integrations with our highly available threshold signer, Horcrux.”In 2022 the Web3 community celebrated the Ethereum merge, one of several engineering advancements that can encourage applications of MPC. For example, MPC could be used for the efficient management of Ethereum validator keys. To learn more about MPC and Web3 with Google Cloud, please reach out to your account team. If you’d like to try Confidential Space, you can take it for a spin today.We’d like to thank Atul Luykx and Ross Nicoll, software engineers, and Nelly Porter and Rene Kolga, product managers, for their contributions to this post.
Quelle: Google Cloud Platform

A new Google Cloud region is coming to Kuwait

To meet growing demand for cloud services in the Middle East, we are excited to announce plans to bring a new Google Cloud region to Kuwait to support our growing customer base. When it opens, the Kuwait region will deliver high-performance services that make it easier for organizations to serve their own users faster, more reliably and securely. Local customers like the Government of Kuwait and Alshaya Group will benefit from key controls that enable them to maintain low latency and the highest security and compliance standards. “Through our strategic partnership with Google Cloud, the State of Kuwait will continue to make great strides towards digital transformation, a main pillar of our New Kuwait vision (Kuwait 2035). Our alliance with Google Cloud will have significant benefits for Kuwait and will provide a major boost to achieving the country’s socio-economic priorities, including promoting efficiencies in government, enhancing healthcare and education, and diversifying the economy”, said H.E. Mr. Mazin Saad Alnahedh, Minister of Commerce and Industry and Minister of State for Communications and Information Technology Affairs.”Alshaya is a pioneer and leader in our industry, and the scale and expansion of Google Cloud’s platform will further enable us to deliver safe and reliable services to customers across the Middle East and Africa,” said Chady Younan, Director of Data, Analytics, BI & Data Science at Alshaya Group. With 35 regions and 106 zones currently in operation around the world, Google Cloud’s global network of cloud regions is the foundation of the infrastructure it is building to support customers of all sizes and across industries. From retail and media & entertainment to financial services, healthcare and the public sector, leading organizations come to Google Cloud as their trusted innovation partner to address five key areas: Understanding and using data: Google Cloud helps customers become smarter and make better decisions with a unified data platform. We help customers reduce complexity and combine unstructured and structured data — wherever it resides — to quickly and easily produce valuable insights. Establishing an open foundation for growth: When customers move to Google Cloud, they get a flexible, secure and open platform that evolves with their organization. Our commitment to multicloud, hybrid cloud, and open source offers organizations the freedom of choice, allowing their developers to build faster and more intuitively.Securing systems and users: As every company rethinks its security posture, we help customers protect their data using the same infrastructure and security services that Google uses for its own operations. Creating a collaborative environment: In today’s hybrid work environment, Google Cloud provides the tools needed to transform how people connect, create, and collaborate. Building a cleaner, more sustainable future: Google has been carbon-neutral since 2007, and we are working toward an ambitious goal to operate entirely on carbon-free energy by 2030. Today, when customers run on Google Cloud their workloads are matched with 100% renewable energy. The forthcoming Kuwait cloud region represents our ongoing commitment to supporting digital transformation across the Middle East, and follows previous announcements of our plans to bring cloud regions to Doha and Dammam. Learn more about our global cloud infrastructure, including new and upcoming regions.Related ArticleNew cloud regions coming to a country near youGoogle Cloud regions are coming to Austria, Greece, Norway, South Africa, and Sweden.Read Article
Quelle: Google Cloud Platform

Building an automated serverless deployment pipeline with Cloud Build

You’ve got a shiny new application ready to deploy to the cloud. After researching your options, you land on using Cloud Run with Cloud Build to build and push your containerized application code to an Artifact Registry repository. In three steps, using a Dockerfile and a Cloud Build configuration you  build your container, push it to Artifact Registry, and deploy it to Cloud Run:code_block[StructValue([(u’code’, u”steps:rn# Build the container imagern- name: ‘gcr.io/cloud-builders/docker’rn args: [‘build’, ‘-t’, ‘us-central1-docker.pkg.dev/my-project/my-app-repo/shiny-new-app’, ‘.’]rnrn# Push the container image to Artifact Registryrn- name: ‘gcr.io/cloud-builders/docker’rn args: [‘push’, ‘us-central1-docker.pkg.dev/my-project/my-app-repo/shiny-new-app’]rnrn# Deploy container image to Cloud Runrn- name: ‘gcr.io/google.com/cloudsdktool/cloud-sdk’rn entrypoint: gcloudrn args: [‘run’, ‘deploy’, ‘my-serverless-app’, ‘–image’, ‘us-central1-docker.pkg.dev/my-project/my-app-repo/shiny-new-app’, ‘–region’, ‘us-central1′]rnrnimages:rn- us-central1-docker.pkg.dev/my-project/my-app-repo/shiny-new-app”), (u’language’, u”), (u’caption’, <wagtail.wagtailcore.rich_text.RichText object at 0x3e9dc8528850>)])]The example above combines the build, push and deployment steps into one Cloud Build job.  This blog will show you what this could look like as a series of manual deployment steps, and how it can be developed into an automatic serverless deployment pipeline that can be used as a jumping off point for more complex solutions.  We’ll be using Cloud Build, Artifact Registry, Pub/Suband Cloud Run.  We’ll use the open source GitHub project, Emblem, to model a working reference of Google Cloud serverless architecture.  References to Emblem will be marked with the ???? emoji.A manual pipelineLet’s start by examining the manual steps to deploy a containerized application to Cloud Run.First, you make application code changes to your repository’s main branch. When an application change is merged, you use Cloud Build to build a new container.After a successful build, Cloud Build pushes the newly built container to Artifact Registry. You update Cloud Run with a new configuration pointing to the new build.Cloud Run deploys a new revision of your service. Your code changes are now deployed.  Of course, you would need to go through these steps each time there are changes to your application code. That’s not practical and can turn into a logistical nightmare for a team making continuous updates to the code.  Not to mention the added complexity of staging changes to multiple environments or incorporating systematic testing or incremental rollouts. Let’s see how you can automate your lovely little pipeline by looking at it as two parts: the build and the deployment.  Automate the buildTo automate the build step of your pipeline, Cloud Build should build and push when a change is committed to the application code in your repository.  Here’s what’s needed to make this happen:1. Connect your GitHub repository to your Cloud projectBy connecting your GitHub repository to your project, Cloud Build can use repository events to initiate a Cloud Build trigger. Common repository events are supported including pushing to a specific branch, pushing a new tag, and creating a pull request.  2. Include a Cloud Build yaml configuration in your repository You can configure a Cloud Build job with a build config file. This YAML file provides task-level instructions to Cloud Build.  This file can live alongside your application’s Dockerfile, or in a separate directory in your repository.  For an automatic build, your config file will tell Cloud Build to build the container image and push it to Artifact Registry.  ???? The Emblem project continuously builds multiple containers and keeps correspondingbuild config files in a centralized ops/ directory.  This allows for the separation of ownership of the Cloud Build configs and the application code they may build. 3. Create a Cloud Build triggerA Cloud Build trigger can be invoked each time a change is pushed to your main branch. Its configuration will require the GitHub repository to be connected to the Google Cloud project, the name of the branch you want to use, and the path to the Cloud Build configuration file in the repo. The invocation of the Cloud Build trigger can be narrowed down further by specifying files and directories to include or ignore, so that a new build can be created only when certain files have changed.???? The automatic build triggers featured in Emblem use aCloud Build config file that builds the container and pushes it to Artifact Registry:code_block[StructValue([(u’code’, u”steps:rn # Docker Build rn – name: ‘gcr.io/cloud-builders/docker’rn args: rn – ‘build’rn – ‘-t’rn – ‘${_REGION}-docker.pkg.dev/${PROJECT_ID}/content-api/content-api:${_IMAGE_TAG}’rnrn# Default to us-central1rnsubstitutions:rn _REGION: us-central1rn _IMAGE_TAG: $SHORT_SHArnrn# Store in Artifact Registryrnimages:rn – ‘${_REGION}-docker.pkg.dev/${PROJECT_ID}/content-api/content-api:${_IMAGE_TAG}'”), (u’language’, u”), (u’caption’, <wagtail.wagtailcore.rich_text.RichText object at 0x3e9dc964ab90>)])]The variables prefixed by an underscore (_) allow for substitutions to be provided when configuring the Cloud Build trigger.  In the example above, _REGION can be overridden allowing this configuration to be used unchanged even if the container registry is moved to a new location. Substitutions without an underscore, such as $PROJECT_ID, are built-in and have values provided by Cloud Build. You can see the list of built-in substitutions in the documentation. This is helpful for using a single Cloud Build config for multiple triggers that have a similar function.Automate the deploymentWith the manual pipeline, you know when a new build is pushed so you can faithfully update the Cloud Run service yourself. For this to work automatically, there needs to be some way of signaling Cloud Run that a new build is available. You can do this with a little help from Pub/Sub and another Cloud Build trigger. Let’s look at this in more detail:1. The “gcr” Pub/Sub topicIf your Google Cloud project includes a Pub/Sub topic named “gcr”, Artifact Registry will publish messages about changes in its repositories. A message will be published every time an image build is pushed, tagged, or deleted. These messages are delivered by a corresponding Pub/Sub subscription to your application or in our case, to a Cloud Build trigger.2. Create another Cloud Build trigger A second Cloud Build trigger is configured to deploy a new revision of your Cloud Run service.  In addition to repository events, Cloud Build triggers support Pub/Sub events. You can select the gcr Pub/Sub topic as the trigger event to create a corresponding subscription.  With that, your Cloud Run service will be updated automatically when Artifact Registry publishes a message to Pub/Sub. While it is possible to have a single Cloud Build trigger build, push and deploy your application, separating the deployment from the build and the push allows each stage to run in a separate Cloud Build job and make it easier to develop each piece of the pipeline independently from the other.  ???? Emblem features two separate Cloud Build triggers that automatically deploy the website and content-api services to Cloud Run. They share a commonCloud Build config file:code_block[StructValue([(u’code’, u”steps:rn # Print the full Pub/Sub message for debugging.rn – name: gcr.io/cloud-builders/gcloudrn entrypoint: /bin/bashrn args:rn – ‘-c’rn – |rn echo ${_BODY}rn # Cloud Run Deployrn – name: gcr.io/cloud-builders/gcloudrn args:rn – runrn – deployrn – ${_SERVICE}rn – –image=${_IMAGE_NAME}rn – –region=${_REGION}rn – –revision-suffix=${_REVISION}rn – –project=${_TARGET_PROJECT}rn – –allow-unauthenticated”), (u’language’, u”), (u’caption’, <wagtail.wagtailcore.rich_text.RichText object at 0x3e9dc964a390>)])]Once again, the config file uses variables for which values are provided via the trigger’s substitution variable settings.  Values for certain variables, such as _BODY, _IMAGE_NAME and _REVISION are evaluated using the message received from the gcr Pub/Sub topic, while others are hardcoded:Why stop there?The value of this pipeline lies not in its simplicity, but in its potential to be developed further to include more functionality, such as staging changes in a separate Google Cloud project, incorporating automatic testing for each change to your application, or doing incremental rollouts to your Cloud Run service.  These can all be achieved with a combination of additional Cloud Build triggers and Pub/Sub topics. Alternatively, with the recent addition of Cloud Run support, Cloud Deploy can be used as a delivery pipeline that will deploy to a Cloud Run target complete with rollbacks, approval, audit and delivery metrics.  ???? Emblem features a more advanced automatic deployment pipeline based on this model.  It includes multiple Google Cloud projects to support staging changes between multiple environments and incremental canary rollouts to production:To see this in action, visit the Emblem GitHub repository and deploy the Emblem sample application yourself.  For a step-by-step tutorial that will deploy this pipeline, The Squire’s guide to automated deployments with Cloud Build.Related ArticleThe Squire’s guide to automated deployments with Cloud BuildGetting started with your first automated deployment pipeline using open source project Emblem featuring Google Cloud Serverless products…Read Article
Quelle: Google Cloud Platform

Optimize Cloud Composer via Better Airflow DAGs

Hosting, orchestrating, and managing data pipelines is a complex process for any business.  Google Cloud offers Cloud Composer – a fully managed workflow orchestration service – enabling businesses to create, schedule, monitor, and manage workflows that span across clouds and on-premises data centers. Cloud Composer is built on the popular Apache Airflow open source project and operates using the Python programming language.  Apache Airflow allows users to create directed acyclic graphs (DAGs) of tasks, which can be scheduled to run at specific intervals or triggered by external events.This guide contains a generalized checklist of activities when authoring Apache Airflow DAGs.  These items follow best practices determined by Google Cloud and the open source community.  A collection of performant DAGs will enable Cloud Composer to work optimally and standardized authoring will help developers manage hundreds or even thousands of DAGs.  Each item will benefit your Cloud Composer environment and your development process.Get Started1. Standardize file names. Help other developers browse your collection of DAG files.a. ex) team_project_workflow_version.py2. DAGs should be deterministic.a. A given input will always produce the same output.3. DAGs should be idempotent. a. Triggering the DAG multiple times has the same effect/outcome.4. Tasks should be atomic and idempotent. a. Each task should be responsible for one operation that can be re-run independently of the others. In an atomized task, a success in part of the task means a success of the entire task.5. Simplify DAGs as much as possible.a. Simpler DAGs with fewer dependencies between tasks tend to have better scheduling performance because they have less overhead. A linear structure (e.g. A -> B -> C) is generally more efficient than a deeply nested tree structure with many dependencies. Standardize DAG Creation6. Add an owner to your default_args.a. Determine whether you’d prefer the email address / id of a developer, or a distribution list / team name.7. Use with DAG() as dag: instead of dag = DAG()a. Prevent the need to pass the dag object to every operator or task group.8. Set a version in the DAG ID. a. Update the version after any code change in the DAG.b. This prevents deleted Task logs from vanishing from the UI, no-status tasks generated for old dag runs, and general confusion of when DAGs have changed.c. Airflow open-source has plans to implement versioning in the future. 9. Add tags to your DAGs.a. Help developers navigate the Airflow UI via tag filtering.b. Group DAGs by organization, team, project, application, etc. 10. Add a DAG description. a. Help other developers understand your DAG.11. Pause your DAGs on creation. a. This will help avoid accidental DAG runs that add load to the Cloud Composer environment.12. Set catchup=False to avoid automatic catch ups overloading your Cloud Composer Environment.13. Set a dagrun_timeout to avoid dags not finishing, and holding Cloud Composer Environment resources or introducing collisions on retries.14. Set SLAs at the DAG level to receive alerts for long-running DAGs.a. Airflow SLAs are always defined relative to the start time of the DAG, not to individual tasks.b. Ensure that sla_miss_timeout is less than the dagrun_timeout.c. Example: If your DAG usually takes 5 minutes to successfully finish, set the sla_miss_timeout to 7 minutes and the dagrun_timeout to 10 minutes.  Determine these thresholds based on the priority of your DAGs.15. Ensure all tasks have the same start_date by default by passing arg to DAG during instantiation16. Use a static start_date with your DAGs. a. A dynamic start_date is misleading, and can cause failures when clearing out failed task instances and missing DAG runs.17. Set retries as a default_arg applied at the DAG level and get more granular for specific tasks only where necessary. a. A good range is 1–4 retries. Too many retries will add unnecessary load to the Cloud Composer environment.Example putting all the above together:code_block[StructValue([(u’code’, u’import airflowrnfrom airflow import DAGrnfrom airflow.operators.bash_operator import BashOperatorrnrn# Define default_args dictionary to specify default parameters of the DAG, such as the start date, frequency, and other settingsrndefault_args = {rn ‘owner': ‘me’,rn ‘retries': 2, # 2-4 retries maxrn ‘retry_delay': timedelta(minutes=5),rn ‘is_paused_upon_creation': True,rn ‘catchup': False,rn}rnrn# Use the `with` statement to define the DAG object and specify the unique DAG ID and default_args dictionaryrnwith DAG(rn ‘dag_id_v1_0_0′, #versioned IDrn default_args=default_args,rn description=’This is a detailed description of the DAG’, #detailed descriptionrn start_date=datetime(2022, 1, 1), # Static start datern dagrun_timeout=timedelta(minutes=10), #timeout specific to this dagrn sla_miss_timeout=timedelta(minutes=7), # sla miss less than timeoutrn tags=[‘example’, ‘versioned_dag_id’], # tags specific to this dagrn schedule_interval=None,rn) as dag:rn # Define a task using the BashOperatorrn task = BashOperator(rn task_id=’bash_task’,rn bash_command=’echo “Hello World”‘rn )’), (u’language’, u”), (u’caption’, <wagtail.wagtailcore.rich_text.RichText object at 0x3ee46b6fd110>)])]18. Define what should occur for each callback function. (send an email, log a context, message slack channel, etc.).  Depending on the DAG you may be comfortable doing nothing. a. successb. failurec. sla_missd. retryExample:code_block[StructValue([(u’code’, u’from airflow import DAGrnfrom airflow.operators.python_operator import PythonOperatorrnrndefault_args = {rn ‘owner': ‘me’,rn ‘retries': 2, # 2-4 retries maxrn ‘retry_delay': timedelta(minutes=5),rn ‘is_paused_upon_creation': True,rn ‘catchup': False,rn}rnrndef on_success_callback(context):rn # when a task in the DAG succeedsrn print(f”Task {context[‘task_instance_key_str’]} succeeded!”)rnrndef on_sla_miss_callback(context):rn # when a task in the DAG misses its SLArn print(f”Task {context[‘task_instance_key_str’]} missed its SLA!”)rnrndef on_retry_callback(context):rn # when a task in the DAG retriesrn print(f”Task {context[‘task_instance_key_str’]} retrying…”)rnrndef on_failure_callback(context):rn # when a task in the DAG failsrn print(f”Task {context[‘task_instance_key_str’]} failed!”)rnrn# Create a DAG and set the callbacksrnwith DAG(rn ‘dag_id_v1_0_0′,rn default_args=default_args,rn description=’This is a detailed description of the DAG’,rn start_date=datetime(2022, 1, 1), rn dagrun_timeout=timedelta(minutes=10),rn sla_miss_timeout=timedelta(minutes=7),rn tags=[‘example’, ‘versioned_dag_id’],rn schedule_interval=None,rn on_success_callback=on_success_callback, # what to do on successrn on_sla_miss_callback=on_sla_miss_callback, # what to do on sla missrn on_retry_callback=on_retry_callback, # what to do on retryrn on_failure_callback=on_failure_callback # what to do on failurern) as dag:rnrn def example_task(**kwargs):rn # This is an example task that will be part of the DAGrn print(f”Running example task with context: {kwargs}”)rnrn # Create a task and add it to the DAGrn task = PythonOperator(rn task_id=”example_task”,rn python_callable=example_task,rn provide_context=True,rn )’), (u’language’, u”), (u’caption’, <wagtail.wagtailcore.rich_text.RichText object at 0x3ee4786b43d0>)])]19. Use Task Groups to organize Tasks.Example:code_block[StructValue([(u’code’, u’# Use the `with` statement to define the DAG object and specify the unique DAG ID and default_args dictionaryrnwith DAG(rn ‘example_dag’,rn default_args=default_args,rn schedule_interval=timedelta(hours=1),rn) as dag:rn # Define the first task grouprn with TaskGroup(name=’task_group_1′) as tg1:rn # Define the first task in the first task grouprn task_1_1 = BashOperator(rn task_id=’task_1_1′,rn bash_command=’echo “Task 1.1″‘,rn dag=dag,rn )’), (u’language’, u”), (u’caption’, <wagtail.wagtailcore.rich_text.RichText object at 0x3ee4786b4210>)])]Reduce the Load on Your Composer Environment20. Use Jinja Templating / Macros instead of python functions.a. Airflow’s template fields allow you to incorporate values from environment variables and jinja templates into your DAGs. This helps make your DAGs idempotent (meaning multiple invocations do not change the result) and prevents unnecessary function execution during Scheduler heartbeats.b. The Airflow engine passes a few variables by default that are accessible in all templates.Contrary to best practices, the following example defines variables based on datetime Python functions:code_block[StructValue([(u’code’, u”# Variables used by tasksrn# Bad example – Define today’s and yesterday’s date using datetime modulerntoday = datetime.today()rnyesterday = datetime.today() – timedelta(1)”), (u’language’, u”), (u’caption’, <wagtail.wagtailcore.rich_text.RichText object at 0x3ee46945fd50>)])]If this code is in a DAG file, these functions execute on every Scheduler heartbeat, which may not be performant. Even more importantly, this doesn’t produce an idempotent DAG. You can’t rerun a previously failed DAG run for a past date because datetime.today() is relative to the current date, not the DAG execution date.A better way of implementing this is by using an Airflow Variable as such:code_block[StructValue([(u’code’, u”# Variables used by tasksrn# Good example – Define yesterday’s date with an Airflow variablernyesterday = {{ yesterday_ds_nodash }}”), (u’language’, u”), (u’caption’, <wagtail.wagtailcore.rich_text.RichText object at 0x3ee47a39a290>)])]21. Avoid creating your own additional Airflow Variables. a. The metadata database stores these variables and requires database connections to retrieve them. This can affect the performance of the Cloud Composer Environment. Use Environment Variables or Google Cloud Secrets instead.22. Avoid running all DAGs on the exact same schedules (disperse workload as much as possible). a. Prefer to use cron expressions for schedule intervals compared to airflow macros or time_deltas. This allows a more rigid schedule and it’s easier to spread out workloads throughout the day, making it easier on your Cloud Composer environment.b. Crontab.guru can help with generating specific cron expression schedules.  Check out the examples here.Examples:code_block[StructValue([(u’code’, u’schedule_interval=”*/5 * * * *”, # every 5 minutes.rnrn schedule_interval=”0 */6 * * *”, # at minute 0 of every 6th hour.’), (u’language’, u”), (u’caption’, <wagtail.wagtailcore.rich_text.RichText object at 0x3ee47a39a050>)])]23. Avoid XComs except for small amounts of data. a. These add storage and introduce more connections to the database. b. Use JSON dicts as values if absolutely necessary. (one connection for many values inside dict)24. Avoid adding unnecessary objects in the dags/ Google Cloud Storage path. a. If you must, add an .airflowignore file to GCS paths that the Airflow Scheduler does not need to parse. (sql, plug-ins, etc.)25. Set execution timeouts for tasks.Example:code_block[StructValue([(u’code’, u”# Use the `PythonOperator` to define the taskrntask = PythonOperator(rn task_id=’my_task’,rn python_callable=my_task_function,rn execution_timeout=timedelta(minutes=30), # Set the execution timeout to 30 minutesrn dag=dag,rn)”), (u’language’, u”), (u’caption’, <wagtail.wagtailcore.rich_text.RichText object at 0x3ee47a39ad90>)])]26. Use Deferrable Operators over Sensors when possible. a. A deferrable operator can suspend itself and free up the worker when it knows it has to wait, and hand off the job of resuming it to a Trigger. As a result, while it suspends (defers), it is not taking up a worker slot and your cluster will have fewer/lesser resources wasted on idle Operators or Sensors.Example:code_block[StructValue([(u’code’, u’PYSPARK_JOB = {rn “reference”: { “project_id”: “PROJECT_ID” },rn “placement”: { “cluster_name”: “PYSPARK_CLUSTER_NAME” },rn “pyspark_job”: {rn “main_python_file_uri”: “gs://dataproc-examples/pyspark/hello-world/hello-world.py”rn },rn}rnrnDataprocSubmitJobOperator(rn task_id=”dataproc-deferrable-example”,rn job=PYSPARK_JOB,rn deferrable=True,rn )’), (u’language’, u”), (u’caption’, <wagtail.wagtailcore.rich_text.RichText object at 0x3ee47a39ac10>)])]27. When using Sensors, always define mode, poke_interval, and timeout. a. Sensors require Airflow workers to run.b. Sensor checking every n seconds (i.e. poke_interval < 60)? Use mode=poke. A sensor in mode=poke will continuously poll every n seconds and hold Airflow worker resources. c. Sensor checking every n minutes (i.e. poke_interval >= 60)? Use mode=reschedule. A sensor in mode=reschedule will free up Airflow worker resources between poke intervals.Example:code_block[StructValue([(u’code’, u’table_partition_sensor = BigQueryTablePartitionExistenceSensor(rn project_id=”{{ project_id }}”,rn task_id=”bq_check_table_partition”,rn dataset_id=”{{ dataset }}”,rn table_id=”comments_partitioned”,rn partition_id=”{{ ds_nodash }}”,rn mode=”reschedule”rn poke_interval=60,rn timeout=60 * 5rn )’), (u’language’, u”), (u’caption’, <wagtail.wagtailcore.rich_text.RichText object at 0x3ee47a39ab50>)])]28. Offload processing to external services (BigQuery, Dataproc, Cloud Functions, etc.) to minimize load on the Cloud Composer environment.a. These services usually have their own Airflow Operators for you to utilize.29. Do not use sub-DAGs.a. Sub-DAGs were a feature in older versions of Airflow that allowed users to create reusable groups of tasks within DAGs. However, Airflow 2.0 deprecated sub-DAGs because they caused performance and functional issues.30. UsePub/Subfor DAG-to-DAG dependencies.a. Here is an example for multi-cluster / dag-to-dag dependencies. 31. Make DAGs load faster.a. Avoid unnecessary “Top-level” Python code. DAGs with many imports, variables, functions outside of the DAG will introduce greater parse times for the Airflow Scheduler and in turn reduce the performance and scalability of Cloud Composer / Airflow.b. Moving imports and functions within the DAG can reduce parse time (in the order of seconds).c. Ensure that developed DAGs do not increase DAG parse times too much.Example:code_block[StructValue([(u’code’, u”import airflowrnfrom airflow import DAGrnfrom airflow.operators.python_operator import PythonOperatorrnrn# Define default_args dictionaryrndefault_args = {rn ‘owner': ‘me’,rn ‘start_date': datetime(2022, 11, 17),rn}rnrn# Use with statement and DAG context manager to instantiate the DAGrnwith DAG(rn ‘my_dag_id’,rn default_args=default_args,rn schedule_interval=timedelta(days=1),rn) as dag:rn # Import module within DAG blockrn import my_module # DO THISrnrn # Define function within DAG blockrn def greet(): # DO THISrn greeting = my_module.generate_greeting()rn print(greeting)rnrn # Use the PythonOperator to execute the functionrn greet_task = PythonOperator(rn task_id=’greet_task’,rn python_callable=greetrn )”), (u’language’, u”), (u’caption’, <wagtail.wagtailcore.rich_text.RichText object at 0x3ee47a39ae10>)])]Improve Development and Testing32. Implement “self-checks” (via Sensors or Deferrable Operators).a. To ensure that tasks are functioning as expected, you can add checks to your DAG. For example, if a task pushes data to a BigQuery partition, you can add a check in the next task to verify that the partition generates and that the data is correct.Example:code_block[StructValue([(u’code’, u’# ————————————————————rn # Transform source data and transfer to partitioned tablern # ————————————————————rnrn create_or_replace_partitioned_table_job = BigQueryInsertJobOperator(rn task_id=”create_or_replace_comments_partitioned_query_job”,rn configuration={rn “query”: {rn “query”: ‘sql/create_or_replace_comments_partitioned.sql’,rn “useLegacySql”: False,rn }rn },rn location=”US”,rn )rnrn create_or_replace_partitioned_table_job_error = dummy_operator.DummyOperator(rn task_id=”create_or_replace_partitioned_table_job_error”,rn trigger_rule=”one_failed”,rn )rnrn create_or_replace_partitioned_table_job_ok = dummy_operator.DummyOperator(rn task_id=”create_or_replace_partitioned_table_job_ok”, trigger_rule=”one_success”rn )rnrn # ————————————————————rn # Determine if today’s partition exists in comments_partitionedrn # ————————————————————rnrn table_partition_sensor = BigQueryTablePartitionExistenceSensor(rn project_id=”{{ project_id }}”,rn task_id=”bq_check_table_partition”,rn dataset_id=”{{ dataset }}”,rn table_id=”comments_partitioned”,rn partition_id=”{{ ds_nodash }}”,rn mode=”reschedule”rn poke_interval=60,rn timeout=60 * 5rn )rnrn create_or_replace_partitioned_table_job >> [rn create_or_replace_partitioned_table_job_error,rn create_or_replace_partitioned_table_job_ok,rn ]rn create_or_replace_partitioned_table_job_ok >> table_partition_sensor’), (u’language’, u”), (u’caption’, <wagtail.wagtailcore.rich_text.RichText object at 0x3ee47a39a1d0>)])]33. Look for opportunities to dynamically generate similar tasks/task groups/DAGs via Python code.a. This can simplify and standardize the development process for DAGs. Example:code_block[StructValue([(u’code’, u’import airflowrnfrom airflow import DAGrnfrom airflow.operators.python_operator import PythonOperatorrnrndef create_dag(dag_id, default_args, task_1_func, task_2_func):rn with DAG(dag_id, default_args=default_args) as dag:rn task_1 = PythonOperator(rn task_id=’task_1′,rn python_callable=task_1_func,rn dag=dagrn )rn task_2 = PythonOperator(rn task_id=’task_2′,rn python_callable=task_2_func,rn dag=dagrn )rn task_1 >> task_2rn return dagrnrndef task_1_func():rn print(“Executing task 1″)rnrndef task_2_func():rn print(“Executing task 2″)rnrndefault_args = {rn ‘owner': ‘me’,rn ‘start_date': airflow.utils.dates.days_ago(2),rn}rnrnmy_dag_id = create_dag(rn dag_id=’my_dag_id’,rn default_args=default_args,rn task_1_func=task_1_func,rn task_2_func=task_2_funcrn)’), (u’language’, u”), (u’caption’, <wagtail.wagtailcore.rich_text.RichText object at 0x3ee47aa4cd10>)])]34. Implement unit-testing for your DAGsExample:code_block[StructValue([(u’code’, u’from airflow import modelsrnfrom airflow.utils.dag_cycle_tester import test_cyclernrnrndef assert_has_valid_dag(module):rn “””Assert that a module contains a valid DAG.”””rnrn no_dag_found = Truernrn for dag in vars(module).values():rn if isinstance(dag, models.DAG):rn no_dag_found = Falsern test_cycle(dag) # Throws if a task cycle is found.rnrn if no_dag_found:rn raise AssertionError(‘module does not contain a valid DAG’)’), (u’language’, u”), (u’caption’, <wagtail.wagtailcore.rich_text.RichText object at 0x3ee47aa4cb10>)])]35. Perform local development via the Composer Local Development CLI Tool.a. Composer Local Development CLI tool streamlines Apache Airflow DAG development for Cloud Composer 2 by running an Airflow environment locally. This local Airflow environment uses an image of a specific Cloud Composer version.36. If possible, keep a staging Cloud Composer Environment to fully test the complete DAG run before deploying in the production.a. Parameterize your DAG to change the variables, e.g., the output path of Google Cloud Storage operation or the database used to read the configuration. Do not hard code values inside the DAG and then change them manually according to the environment.37. Use a Python linting tool such as Pylint or Flake8 for standardized code.38. Use a Python formatting tool such as Black or YAPF for standardized code.Next StepsIn summary, this blog provides a comprehensive checklist of best practices for developing Airflow DAGs for use in Google Cloud Composer. By following these best practices, developers can help ensure that Cloud Composer is working optimally and that their DAGs are well-organized and easy to manage.For more information about Cloud Composer, check out the following related blog posts and documentation pages:What is Cloud Composer? Deutsche Bank uses Cloud Composer workload automationUsing Cloud Build to keep Airflow Operators up-to-date in your Composer environmentWriting DAGs (workflows) | Cloud Composer
Quelle: Google Cloud Platform

How to do multivariate time series forecasting in BigQuery ML

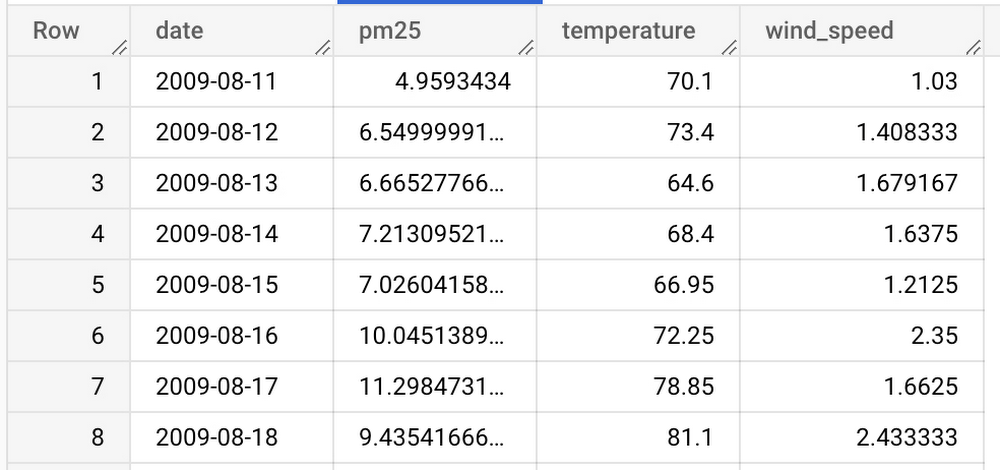
Companies across industries rely heavily on time series forecasting to project product demand, forecast sales, project online subscription/cancellation, and for many other use cases. This makes time series forecasting one of the most popular models in BigQuery ML. What is multivariate time series forecasting? For example, if you want to forecast ice cream sales, it is helpful to forecast using the external covariant “weather” along with the target metric “past sales.” Multivariate time series forecasting in BigQuery lets you create more accurate forecasting models without having to move data out of BigQuery. When it comes to time series forecasting, covariates or features besides the target time series are often used to provide better forecasting. Up until now, BigQuery ML has only supported univariate time series modeling using the ARIMA_PLUS model (documentation). It is one of the most popular BigQuery ML models.While ARIMA_PLUS is widely used, forecasting using only the target variable is sometimes not sufficient. Some patterns inside the time series strongly depend on other features. We see strong customer demand for multivariate time series forecasting support that allows you to forecast using covariate and features.  We recently announced the public preview of multivariate time series forecasting with external regressors. We are introducing a new model type ARIMA_PLUS_XREG, where the XREG refers to external regressors or side features. You can use the SELECT statement to choose side features with the target time series. This new model leverages the BigQuery ML linear regression model to include the side features and the BigQuery ML ARIMA_PLUS model to model the linear regression residuals.The ARIMA_PLUS_XREG model supports the following capabilities: Automatic feature engineering for numerical, categorical, and array features.All the model capabilities of the ARIMA_PLUS model, such as detecting seasonal trends, holidays, etc.Headlight, an AI-powered ad agency, is using a multivariate forecasting model to determine conversion volumes for down-funnel metrics like subscriptions, cancellations, etc. based on cohort age. You can check out the customer video and demo here.The following sections show some examples of the new ARIMA_PLUS_XREG model in BigQuery ML. In this example, we explore the bigquery-public-data.epa_historical_air_quality dataset, which has daily air quality and weather information. We use the model to forecast the PM2.51 , based on its historical data and some covariates, such as temperature and wind speed.An example: forecast Seattle’s air quality with weather informationStep 1. Create the datasetThe PM2.5, temperature, and wind speed data are in separate tables. To simplify the queries, create a new table by joining those tables into a new table “bqml_test.seattle_air_quality_daily,” with the following columns:date: the date of the observationPM2.5: the average PM2.5 value for each daywind_speed: the average wind speed for each daytemperature: the highest temperature for each dayThe new table has daily data from 2009-08-11 to 2022-01-31.code_block[StructValue([(u’code’, u”CREATE TABLE `bqml_test.seattle_air_quality_daily`rnASrnWITHrn pm25_daily AS (rn SELECTrn avg(arithmetic_mean) AS pm25, date_local AS datern FROMrn `bigquery-public-data.epa_historical_air_quality.pm25_nonfrm_daily_summary`rn WHERErn city_name = ‘Seattle’rn AND parameter_name = ‘Acceptable PM2.5 AQI & Speciation Mass’rn GROUP BY date_localrn ),rn wind_speed_daily AS (rn SELECTrn avg(arithmetic_mean) AS wind_speed, date_local AS datern FROMrn `bigquery-public-data.epa_historical_air_quality.wind_daily_summary`rn WHERErn city_name = ‘Seattle’ AND parameter_name = ‘Wind Speed – Resultant’rn GROUP BY date_localrn ),rn temperature_daily AS (rn SELECTrn avg(first_max_value) AS temperature, date_local AS datern FROMrn `bigquery-public-data.epa_historical_air_quality.temperature_daily_summary`rn WHERErn city_name = ‘Seattle’ AND parameter_name = ‘Outdoor Temperature’rn GROUP BY date_localrn )rnSELECTrn pm25_daily.date AS date, pm25, wind_speed, temperaturernFROM pm25_dailyrnJOIN wind_speed_daily USING (date)rnJOIN temperature_daily USING (date)”), (u’language’, u”), (u’caption’, <wagtail.wagtailcore.rich_text.RichText object at 0x3e6736a2bed0>)])]Here is a preview of the data:Step 2. Create ModelThe “CREATE MODEL” query of the new multivariate model, ARIMA_PLUS_XREG, is very similar to the current ARIMA_PLUS model. The major differences are the MODEL_TYPE and inclusion of feature columns in the SELECT statement.code_block[StructValue([(u’code’, u”CREATE OR REPLACErn MODELrn `bqml_test.seattle_pm25_xreg_model`rn OPTIONS (rn MODEL_TYPE = ‘ARIMA_PLUS_XREG’,rn time_series_timestamp_col = ‘date’,rn time_series_data_col = ‘pm25′)rnASrnSELECTrn date,rn pm25,rn temperature,rn wind_speedrnFROMrn `bqml_test.seattle_air_quality_daily`rnWHERErn datern BETWEEN DATE(‘2012-01-01′)rn AND DATE(‘2020-12-31′)”), (u’language’, u”), (u’caption’, <wagtail.wagtailcore.rich_text.RichText object at 0x3e674df5f490>)])]Step 3. Forecast the future dataWith the created model, you can use the ML.FORECAST function to forecast the future data. Compared to the ARIMA_PLUS model, you have to specify the future covariates as an input.code_block[StructValue([(u’code’, u”SELECTrn *rnFROMrn ML.FORECAST(rn MODELrn `bqml_test.seattle_pm25_xreg_model`,rn STRUCT(30 AS horizon),rn (rn SELECTrn date,rn temperature,rn wind_speedrn FROMrn `bqml_test.seattle_air_quality_daily`rn WHERErn date > DATE(‘2020-12-31′)rn ))”), (u’language’, u”), (u’caption’, <wagtail.wagtailcore.rich_text.RichText object at 0x3e674df5f750>)])]After running the above query, you can see the forecasting results:Step 4. Evaluate the modelYou can use the ML.EVALUATE function to evaluate the forecasting errors. You can set perform_aggregation to “TRUE” to get the aggregated error metric or “FALSE” to see the per timestamp errors.code_block[StructValue([(u’code’, u”SELECTrn *rnFROMrn ML.EVALUATE(rn MODEL `bqml_test.seattle_pm25_xreg_model`,rn (rn SELECTrn date,rn pm25,rn temperature,rn wind_speedrn FROMrn `bqml_test.seattle_air_quality_daily`rn WHERErn date > DATE(‘2020-12-31′)rn ),rn STRUCT(rn TRUE AS perform_aggregation,rn 30 AS horizon))”), (u’language’, u”), (u’caption’, <wagtail.wagtailcore.rich_text.RichText object at 0x3e674df5fb90>)])]The evaluation result of ARIMA_PLUS_XREG is as follows:As a comparison, we also show the univariate forecasting ARIMA_PLUS result in the following table:Compared to ARIMA_PLUS, ARIMA_PLUS_XREG performs better on all measured metrics on this specific dataset and date range.ConclusionIn the previous example, we demonstrated how to create a multivariate time series forecasting model, forecast future values using the model, and evaluate the forecasted results. The ML.ARIMA_EVALUATE and ML.ARIMA_COEFFICIENTS table value functions are also helpful for investigating your model. Based on the feedback from users, the model does the following to improve user productivity.  It shortens the time spent preprocessing data and lets users keep their data in BigQuery when doing machine learning. It reduces overhead for the users who know SQL to do machine learning work in BigQuery.   For more information about the ARIMA_PLUS_XREG model, please see thedocumentation here.What’s Next?In this blogpost, we described the BigQuery ML Multivariate Time Series Forecast model, which is now available for public preview. We also showed a code demo for a data scientist, data engineer, or data analyst to enable the multivariate time series forecast model. The following features are coming soon:Large-scale multivariate time series, i.e., training millions of models for millions of multivariate time series in a single CREATE MODEL statementMultivariate time series anomaly detectionThanks to Xi Cheng, Honglin Zheng, Jiashang Liu, Amir Hormati, Mingge Deng and Abhinav Khushraj from the BigQuery ML team. Also thanks to Weijie Shen from the Google Resource Efficiency Data Science team.1. A measure of air pollution from fine particulate matter
Quelle: Google Cloud Platform
Log Analytics in Cloud Logging is now GA

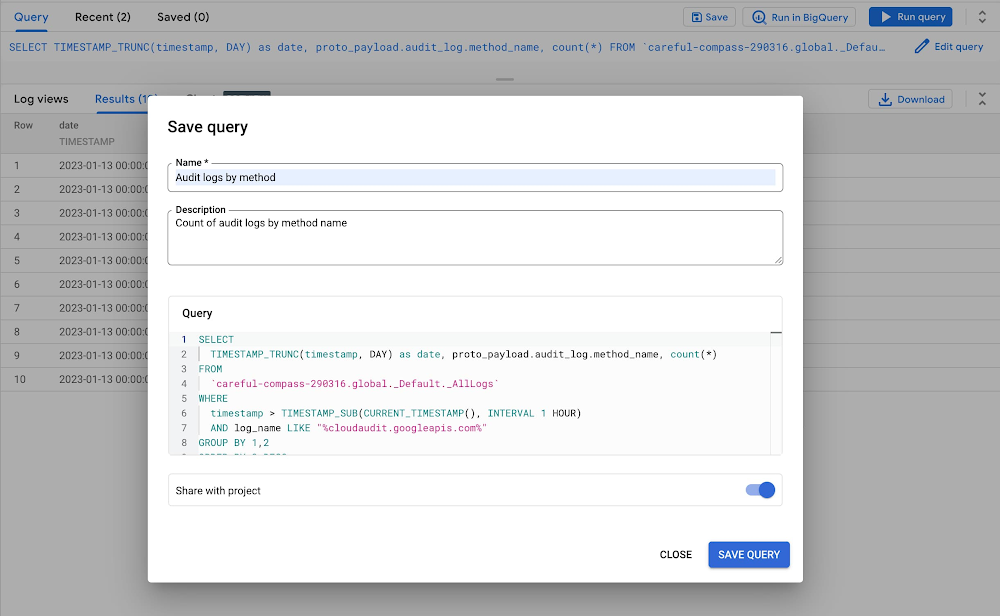
Solving big problems usually takes a combination of the right people and the right tools. SRE, DevOps, and IT operations teams in organizations both big and small have used Google Cloud’s built-in logging service, Cloud Logging, to troubleshoot faster, recognize trends easier, and scale operations more effectively. Additionally, customers have been building homegrown solutions that combine the powers of BigQuery and Cloud Logging to help them address operational and security challenges at massive scale. Last year we introduced Log Analytics, powered by BigQuery, so more customers can bring logs and advanced analysis together without having to build the connection themselves.  Today, we are announcing the general availability of Cloud Logging’s Log Analytics (powered by BigQuery), a capability that allows you to search, aggregate and transform all log data types including application, network and audit log data at no additional cost for existing Cloud Logging customers. We are also launching three new Log Analytics capabilities. Multi-region support for US and EU regionImproved query experience to save and share queriesSupport for custom retention up to 10 yearsTo get started, upgrade your existing log buckets to Log Analytics supported buckets. Same logs, same cost, more value with Log Analytics Log Analytics brings entirely new capabilities to search, aggregate, or transform logs at query time directly into Cloud Logging with a new user experience that’s optimized for analyzing logs data. Centralized logging –  By collecting and centrally storing the log data in a dedicated Log Bucket, it allows multiple stakeholders to manipulate their data from the same datasource. You don’t need to make duplicate copies of the data.Reduced cost and complexity – Log Analytics allows reuse of data across the organization, effectively saving cost and reducing complexities. Ad hoc log analysis – It allows for ad-hoc query-time log analysis without requiring complex pre-processing. Scalable platform – Log Analytics can scale for observability using the serverless BQ platform and perform aggregation at petabyte scale efficientlyBy leveraging BigQuery, Log Analytics breaks down data silos helping security, networking, developer and even business teams collaborate using a single copy of data. New features in this release1. Multi-region support for Log Analytics buckets In addition to GA, we are also announcing multi-region support for Log Analytics with log buckets in the US and EU. These new multi-regions are available for log buckets that use Log Analytics and for those that don’t.  This means that you can now store and analyze your logs in the region that is most convenient for you, improving performance and reducing latency. 2. Improved query experienceWe are also improving the query experience by allowing users to save, share and re-use recent queries. This means that you can easily reuse and share your most important queries, saving time and making it easier to get the insights you need from your logs.Log Analytics feature: Save & Share Query3. Retain logs up to 10 years in a Log Analytics bucketWe are rolling out the ability to support custom log retention. You can now store logs in the Log Analytics supported bucket for beyond 30 days. Standard custom log retention pricingwill apply. Get started todayNow that Log Analytics is Generally Available, you can upgrade your log buckets to use Log Analytics and know that it’s covered under the Cloud Logging SLA. Upgrade your log bucket today to start taking advantage of Log Analytics. If this is the first time you’re hearing about Log Analytics, we’ve got you covered with some materials to get you up to speed. Take a look at our blog the top 10 reasons to get started with Log Analytics, watch a recent on-demand information session we did aimed at developers, and learn more about the overall challenges we’re helping you solve in this video: Streamline software development with better insights and diagnostics.
Quelle: Google Cloud Platform

Managing Dialogflow CX Agents with Terraform

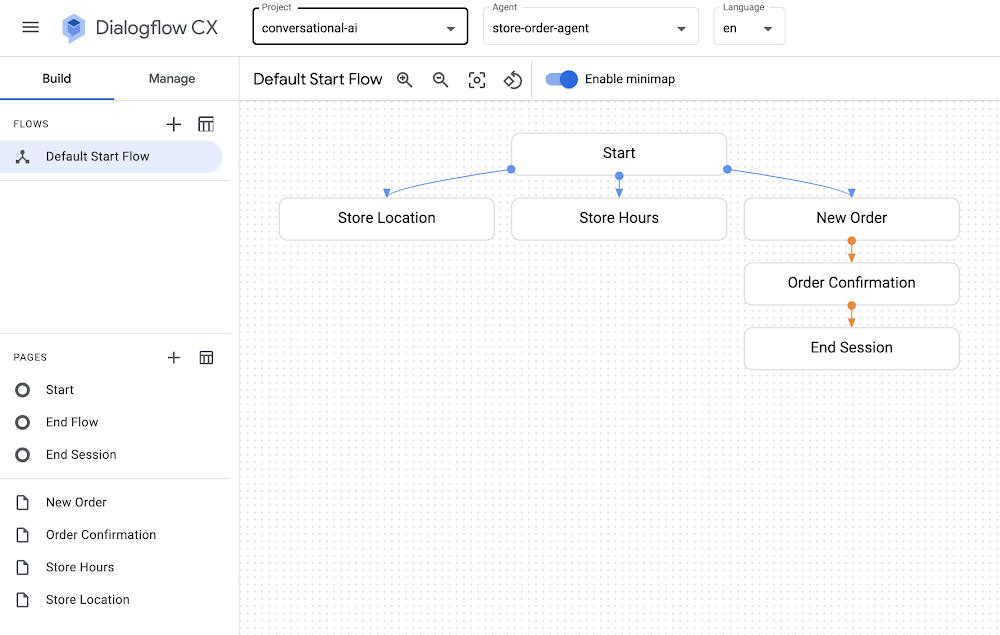
Dialogflow CX is a powerful tool in Google Cloud that you can use to design conversational agents powered by Natural Language Understanding (NLU) to transform user requests into actionable data. You can integrate voice and/or chat agents in your app, website, or customer support systems to determine user intent and interact with users.If you’ve ever wanted to get started with Dialogflow CX, you might have seen or ran through the quickstart steps to build a shirt ordering agent that you can ask for the store location, get store hours, or make a shirt order.While going through the quickstart steps, you might find yourself wanting to codify all of the Dialogflow CX components and settings, which would help you quickly spin up agents and manage their configuration programmatically. In fact, you might already be using infrastructure as code tooling and best practices to manage virtual machines in Compute Engine, Kubernetes clusters in GKE, or topics and subscriptions in Pub/Sub. You can also use the same infrastructure as code approach with your Dialogflow CX agents: Terraform and Google Cloud to the rescue!You can use the Terraform modules for Dialogflow CX along with the sample Terraform + Dialogflow CX configuration files to reproduce the chatbot/agent described in the “build a shirt ordering agent” quickstart. Try them out and spin up a Dialogflow CX agent with a single command in your own Google Cloud account!SetupThere are a few things that you’ll need to set up before you run the sample Terraform configuration files for Dialogflow CX.Register for a Google Cloud account.Enable the Dialogflow CX API.Install and initialize the Google Cloud CLI.Install Terraform.UsageOnce you’ve completed the setup on your local machine, you’re ready to spin up your own fully-configured Dialogflow CX agent in seconds:Clone the CCAI samples repository and cd into the dialogflow-cx/shirt-order-agent/ directory.Edit the values in variables.tf to specify your Google Cloud project ID along with your desired region and zone.Run terraform init to initialize the directory that contains the Terraform configuration files.Run terraform apply, the command that spins everything up!Once you run terraform apply and confirm the proposed plan, you’ll see messages about all of the components that were provisioned, including the agent, pages, intents, flows, and more:code_block[StructValue([(u’code’, u’google_dialogflow_cx_agent.agent: Creating…rngoogle_dialogflow_cx_agent.agent: Creation complete after 2srngoogle_dialogflow_cx_entity_type.size: Creating…rngoogle_dialogflow_cx_page.store_location: Creating…rngoogle_dialogflow_cx_intent.store_hours: Creating…rngoogle_dialogflow_cx_page.store_hours: Creating…rngoogle_dialogflow_cx_page.order_confirmation: Creating…rngoogle_dialogflow_cx_intent.store_location: Creating…rngoogle_dialogflow_cx_intent.store_hours: Creation complete after 1srngoogle_dialogflow_cx_page.store_location: Creation complete after 1srngoogle_dialogflow_cx_page.order_confirmation: Creation complete after 1srngoogle_dialogflow_cx_page.store_hours: Creation complete after 1srngoogle_dialogflow_cx_intent.store_location: Creation complete after 1srngoogle_dialogflow_cx_entity_type.size: Creation complete after 1srngoogle_dialogflow_cx_page.new_order: Creating…rngoogle_dialogflow_cx_intent.order_new: Creating…rngoogle_dialogflow_cx_intent.order_new: Creation complete after 0srngoogle_dialogflow_cx_page.new_order: Creation complete after 0s’), (u’language’, u”), (u’caption’, <wagtail.wagtailcore.rich_text.RichText object at 0x3ef4c6f145d0>)])]Now that you’ve provisioned your agent in Dialogflow CX, you’re ready to view and test your agent in the Dialogflow CX Console!How it worksWe’re using the Terraform modules for Dialogflow CX to define a conversational agent and all of its components. We’ve reproduced the agent described in the build a shirt ordering agent quickstart.All of the agent’s associated entity types, flows, intents, and pages are created and managed with Terraform, so you can edit your Terraform configuration files to change certain parameters, run terraform apply, and see your changes instantly reflected in the Dialogflow CX console.You might notice that the flows.tf file actually uses a local-exec command within a null_resource block to make a REST API call instead of using a Terraform resource for Dialogflow CX to define the flow. This approach was used since Dialogflow CX creates a default start flow when the agent is created rather than being created and managed by Terraform. As a result, we can use a REST API call to PATCH the default start flow and then modify its messages and routes. We can still use Terraform to templatize and trigger the REST API command, which means that you can manage any setting that is also available in the Dialogflow CX REST API, or even add custom callbacks to other Google Cloud services if needed.SummaryIt’s convenient to be able to manage conversational agents as code using Terraform in Google Cloud. We get all of the benefits of Dialogflow CX with the convenience of Terraform to manage everything in a stateful and version-control friendly way.Now that you’ve captured all of your Dialogflow CX agent settings and configuration in Terraform, you are ready to check your Terraform scripts into version control, spin up and destroy agents as you please using terraform apply and terraform destroy, or even store remote Terraform state in Google Cloud using the GCS backend.Take a look at the Terraform + Dialogflow CX sample code along with the Terraform modules for Dialogflow CX so you can spin up your own Dialogflow CX agents with a single command. If you found this Terraform code sample useful, be sure to star, watch, or ask questions in our CCAI samples repository on GitHub!aside_block[StructValue([(u’title’, u’Terraform + Dialogflow CX sample code’), (u’body’, <wagtail.wagtailcore.rich_text.RichText object at 0x3ef4c5a19750>), (u’btn_text’, u’TRY IT OUT!’), (u’href’, u’https://github.com/GoogleCloudPlatform/contact-center-ai-samples/tree/main/dialogflow-cx/shirt-order-agent’), (u’image’, None)])]
Quelle: Google Cloud Platform

Changing the customer experience with Contact Center AI: Look back and look forward

We meet daily with contact center owners and customer experience (CX) execs across all industries, geographies, and business sizes. Looking back at these conversations, it’s crystal clear that 2022 was a high-stakes year for call centers, with three primary challenges trending across all customers and continuing in 2023:Many organizations feel pressure to rapidly scale up their call center operations in response to macroeconomic changes. Uncertain conditions are forcing Contact Centers to be ever more cost-effective, and to find ways to generate revenue for the business.End users areincreasingly demandingandless forgivingwhen it comes to CX. Users have a choice, and they expect brands to meet them where they are with superior experiences. Connecting with customers where they engage is one of the key components of superior CX—customers should not have to go through elaborate processes or unhelpful phone trees to get help but should rather have service available quickly and easily in their preferred channels. Consumers demand more intimate ways of connecting with brands and Conversational AI can create that critical interaction medium. Organizations understand that AI can help address these challenges. However, many business leaders remain unsure how to successfully make the journey. A growing number of offerings are on the market, but many don’t deliver on their promise, with long and expensive integration requirements and unpredictable and underwhelming outcomes.Helping our customers successfully address these challenges and opportunities was one of our top priorities last year and will continue to be a significant focus in coming months. In this blog post, we’ll review our Contact Center AI (CCAI) news from last year, as a primer for 2023. Looking back: Why 2022 was a big year for Contact Center AIIn 2022, we increased our strategic investment in CCAI, including expanding it to include a comprehensive, end-to-end contact center solution suite that is user-first, AI-first, and cloud-first. We launched Contact Center AI Platform, our Contact Center as a Service (CCaaS) offering, as part of the CCAI product suite that offers a modern, turnkey solution, designed with user-first, AI-first, and cloud-first design. During Google Cloud Next ‘22, we shared lots of great content on how organizations can use CCAI to improve customer experiences, including these breakout sessions:Delight customers in every interaction with Contact Center AIPower new voice enabled interfaces with applications with Google Cloud’s speech solutionsWe also got a chance to hear how customers are using CCAI to better reach their own customers, including Wells Fargo and TIAA. We partnered with CDW to discuss Providing Better Customer Experiences and with Quantiphi in a webinar called “Elevating the Banking Experience with CCAI Platform.” Just recently, our customer Segra shared their success story.Through these customer interactions, three key priorities have surfaced as we look forward to 2023: Elevate the customer experience, bring new forms of AI to drive new automation and accelerate time to value.Looking forward: Elevate CX, integrate new forms of AI, accelerate time to value 1. User-first: Meet them where they are with elevated Customer Experience.As we have learned, users expect that brands meet them where they are and on their own terms and expectations. To do that, brands must integrate with and adopt the latest user-centric technologies and product best practices from consumer mobile and web apps. Enterprise B2C can’t exist anymore in a parallel world of different and often inferior user experience. Google has over 20 years of experience in building such consumer experiences, with multiple products successfully serving billions of users. Bringing these capabilities and experiences from our consumer products and research teams to our cloud offerings was a key component for our product offerings in 2022 and is a big part of our key investments in 2023. Moreover, a vast majority of CX user journeys start with a query on Google Search or YouTube. Connecting with the users at that point, even before they reach out directly to the contact center is a win-win, saving money for the brand and delivering immediate value to the user. By focusing on the user we created a superior  integrated omnichannel experience.2. AI-first and cloud-first: Quality contact center growth depends on transforming to modern, Cloud, AI solutions.For contact centers to evolve, they need to transform from cost centers to revenue generators. That requires modern Cloud and AI solutions. Conversational data spans across all parts of the contact center, opening new ways to generate value. Cloud capabilities of privacy, security and scale can enable personalized CX across channels, enabling key omnichannel experiences. From a study by McKinsey: “Cross-channel integration and migration issues continue to hamper progress. For example, 77 percent of survey respondents report that their organizations have built digital platforms, but only 10 percent report that those platforms are fully scaled and adopted by customers. Only 12 percent of digital platforms are highly integrated, and, for most organizations, only 20 percent of digital contacts are unassisted.” Traditional telephony technologies are becoming commoditized and struggle to keep up with ever more complex rule based systems. Leaders in applicative AI and Cloud technology are stepping up as the new partners for brands who understand they need to take the leap to the next generation CX solutions. .  3. Accelerating time to value while future proofing investments with predictable and measurable valueReducing upfront implementation investment and accelerating time to value can be a challenge for contact center solutions. Scaling Cloud and AI can provide a faster path advanced conversational AI, can help address these challenges. Let’s look at three examples:Out of the Box(OOTB) integrated transcription, chat and voice summarization, and topic modeling — This saves customers money by reducing agent handling time for every chat and call, as well as providing valuable insights that can be used for quality management, contact center optimization and automation, agent and user churn prediction, business insights, and revenue opportunities.AI based chat and voice calls steering  paired with info-seeking virtual agents — Together these deliver higher Customer Satisfaction at scale while reducing cost –  by significantly reducing waiting queues and being routed to the wrong agent, as well as automating away total handling time.Reduced time to full automation — Reduce the complexity of conversation modeling, prebuilt components and APIs for shorter time to value and more predictable outcomes, and metrics driven ML-Dev & QA tools and playbooks.With these new capabilities, our customers can now see results as soon as they implement CCAI. We’re excited to get our customers to where they want to be faster!And there you have it: a quick overview of CCAI and its progress in 2022 and what’s coming in 2023. For more details, check out the documentation or our CCAI solutions page.Related ArticleGoogle Cloud expands CCAI and DocAI solutions to accelerate time to valueGoogle Cloud deepens customer understanding with Contact Center AI Insights and transforms contract management with Contract DocAIRead Article
Quelle: Google Cloud Platform

Tips to get the most out of Google Cloud Documentation

As a Google Cloud practitioner, you typically spend a lot of time in the documentation pages to read up on the guides, commands, tutorials and more. The documentation team has introduced several features over the years to make it easier to be more productive while working with Google Cloud documentation.A few of these tips would be well known to some of you and I am hoping that there is at least one tip that you go away with that helps you. In no particular order, here are my personal list of tips that I have found useful.Interactive Tutorials or WalkthroughsThis is an excellent feature of the documentation, where an interactive tutorial opens up right in the Google Cloud Console and you can complete the tutorial as a sequence of steps. Several tutorials are available from the Google Cloud Console via the Support icon in the top Action Bar. SearchThe Search bar at the top in the Google Cloud console is an efficient way to search for various product services, documentation pages, tutorials and even Google Cloud Resources (e.g. Compute Engine VM names). While you can locate the specific Product page from the hamburger menu on the top left and the subsequent left-navigation bar, the Search bar is probably the quickest way to get to a product (Extra points to those who are power users and have used the “pin” feature to lock frequently used products at the top of the list in the left-navigation bar). Here is a screencast demonstrating how to search for a specific product. You will notice that it’s just not about going to a specific product but it also provides you different sections (Tutorials, Google Cloud Resources, etc).If you would like to straightaway look at all the products and their related documentation, you should check out the View all Products link in the left-navigation bar. The screencast below demonstrates that. Need more tutorials, Quickstarts and reference guides? You have probably noticed that as you navigate across the documentation, we have a list of tutorials, Quickstarts and reference guides available for each of the products. There are couple of ways that I use to get more information on a specific product. First up, you will notice that some of our product pages have a Learn icon. Here is a sample of the Compute Engine product home page.Click on the Learn button to get access to a bunch of related documentation around the product. At times, I want to try out a few more interactive tutorials (walkthroughs). You would have noticed that via the Support icon in the top action bar, you can get access to some interactive tutorials via the Start a tutorial link as we saw earlier. This list is limited and there are other interactive tutorials available and you can get them as follows:Let’s say that you are interested in learning more about IAM and want to check out the various interactive tutorials that are available under this service. Go to the main Search bar at the top and enter IAM. This will present a list of search results as we saw earlier. You will notice that we provide a few results under the Documentation and Tutorials section as shown above. The keyword here is Interactive Tutorial. If you click on See more results … , this will lead to a search results page, where you can further filter into interactive tutorials only. Saving your favorite documentation pagesAt the top of each documentation page, you will see a Bookmark icon that you can click on to save to  your collection of documentation pages that you can then reference easily from your Google Profile. For e.g. here is a documentation page on how to create and start a VM instance in Compute Engine. I wish to bookmark this document. All I need to do is click on the Bookmark icon as shown below:You can choose to save it to your My saved pages or create a New Collection and save it in that. In my case above, I have created a new collection named Compute Engine and I chose to bookmark this page under that. How do you access all your bookmarked pages? On the top bar, next to your Google Profile pic, you will see a set of 3 dots, click on that. This will provide you a way to visit your Google Developer Profile associated with that account. One of the options as you can see below is that of Saved pages. When you visit the page, you will see your Saved Pages as shown below:You can tap on any of the collections that you have created and all your bookmarks will be available under that. Providing FeedbackYour feedback is valuable and Google Cloud Documentation makes it easy for you to submit your feedback. Notice the Send feedback button on the documentation pages. Click that and it will help you give us feedback on the specific page or the particular product documentation in general. Interactive Code samplesThis one continues to be one of my favorites and it boosts developer productivity by multiple  levels, especially when you are trying out the various gcloud commands. The specific feature is about using placeholder variables in the commands e.g. Project ID, Region, etc that you need to repeat across a series of commands. The feature is well over 2+ years old and has been well documented in the following blog post. I reproduce a screencast of the same here and reproduce the text from that blog post pertaining to this feature:“If a page has multiple code samples with the same placeholder variable, you only need to replace the variable once. For example, when you replace a PROJECT_ID variable with your own Google Cloud project ID, all instances of the PROJECT_ID variable (including in any other command line samples on the page) will use the same Google Cloud project ID.”Hope this set of tips was useful to you. If you would like to try out an interactive tutorial, try out the Compute Engine quickstart. I am sure you have a list of your own tips that you have found useful while working with Google Cloud documentation? Do reach out on Twitter (@iRomin) with those. I’d love to hear about them. 
Quelle: Google Cloud Platform

Run faster and more cost-effective Dataproc jobs

Dataproc is a fully managed service for hosting open-source distributed processing platforms such as Apache Hive, Apache Spark, Presto, Apache Flink, and Apache Hadoop on Google Cloud. Dataproc provides flexibility to provision and configure clusters of varying sizes on demand. In addition, Dataproc has powerful features to enable your organization to lower costs, increase performance and streamline operational management of workloads running on the cloud. Dataproc is an important service in any data lake modernization effort. Many customers begin their journey to the cloud by migrating their Hadoop workloads to Dataproc and continue to modernize their solutions by incorporating the full suite of Google Cloud’s data offerings.This guide demonstrates how you can optimize Dataproc job stability, performance, and cost-effectiveness. You can achieve this by using a workflow template to deploy a configured ephemeral cluster that runs a Dataproc job with calculated application-specific properties.  Before you beginPre-requisitesA Google Cloud projectA 100-level understanding of Dataproc (FAQ)Experience with shell scripting, YAML templates, Hadoop ecosystemAn existing dataproc application , referred to as “the job” or “the application”Sufficient project quotas (CPUs, Disks, etc.) to create clusters Consider Dataproc Serverless or BigQueryBefore getting started with Dataproc, determine whether your application is suitable for (or portable to) Dataproc Serverless or BigQuery. These managed services will save you time spent on maintenance and configuration. This blog assumes the user has identified Dataproc as the best choice for their scenario. For more information about other solutions, please check out some of our other guides like Migrating Apache Hive to Bigquery and Running an Apache Spark Batch Workload on Dataproc Serverless.Separate data from computationConsider the advantages of using Cloud Storage. Using this persistent storage for your workflows has the following advantages:It’s a Hadoop Compatible File System (HCFS), so it’s easy to use with your existing jobs.Cloud Storage can be faster than HDFS. In HDFS, a MapReduce job can’t start until the NameNode is out of safe mode—a process that can take a few seconds to many minutes, depending on the size and state of your data.It requires less maintenance than HDFS.It enables you to easily use your data with the whole range of Google Cloud products.It’s considerably less expensive than keeping your data in replicated (3x) HDFS on a persistent Dataproc cluster. Pricing Comparison Examples (North America, as of 11/2022):GCS: $0.004 – $0.02 per GB, depending on the tierPersistent Disk: $0.04 – $0.34 per GB + compute VM costsHere are some guides on Migrating On-Premises Hadoop Infrastructure to Google Cloud and HDFS vs. Cloud Storage: Pros, cons, and migration tips. Google Cloud has developed an open-source tool for performing HDFS to GCS.Optimize your Cloud StorageWhen using Dataproc, you can create external tables in Hive, HBase, etc., where the schema resides in Dataproc, but the data resides in Google Cloud Storage. Separating compute and storage enables you to scale your data independently of compute power.In HDFS / Hive On-Prem setups, the compute and storage were closely tied together, either on the same machine or in a nearby machine. When using Google Cloud Storage over HDFS, you separate compute and storage at the expense of latency. It takes time for Dataproc to retrieve files on Google Cloud Storage. Many small files (e.g. millions of <1mb files) can negatively affect query performance, and file type and compression can also affect query performance.When performing data analytics on Google Cloud, it is important to be deliberate in choosing your Cloud Storage file strategy. Monitoring Dataproc JobsAs you navigate through the following guide, you’ll submit Dataproc Jobs and continue to optimize runtime and cost for your use case. Monitor the Dataproc Jobs console during/after job submissions to get in-depth information on the Dataproc cluster performance. Here you will find specific metrics that help identify opportunities for optimization, notably YARN Pending Memory, YARN NodeManagers, CPU Utilization, HDFS Capacity, and Disk Operations. Throughout this guide you will see how these metrics influence changes in cluster configurations.Guide: Run Faster and Cost-Effective Dataproc Jobs1. Getting startedThis guide demonstrates how to optimize performance and cost of applications running on Dataproc clusters. Because Dataproc supports many big data technologies – each with their own intricacies – this guide intends to be trial-and-error experimentation. Initially it will begin with a generic dataproc cluster with defaults set. As you proceed through the guide, you’ll increasingly customize Dataproc cluster configurations to fit your specific workload.Plan to separate Dataproc Jobs into different clusters – each data processing platform uses resources differently and can impact each other’s performances when run simultaneously. Even better, isolating single jobs to single clusters can set you up for ephemeral clusters, where jobs can run in parallel on their own dedicated resources.Once your job is running successfully, you can safely iterate on the configuration to improve runtime and cost, falling back to the last successful run whenever experimental changes have a negative impact.You can export an existing cluster’s configuration to a file during experimentation. Use this configuration to create new clusters through the import command.code_block[StructValue([(u’code’, u’gcloud dataproc clusters export my-cluster \rn –region=region \rn –destination=my-cluster.yamlrnrngcloud dataproc clusters import my-new-cluster \rn –region=us-central1 \rn –source=my-cluster.yaml’), (u’language’, u”), (u’caption’, <wagtail.wagtailcore.rich_text.RichText object at 0x3ebfd8f5f5d0>)])]Keep these as reference to the last successful configuration incase drift occurs. 2. Calculate Dataproc cluster sizea. Via on-prem workload (if applicable)View the YARN UIIf you’ve been running this job on-premise, you can identify the resources used for a job on the Yarn UI. The image below shows a Spark job that ran successfully on-prem.The table below are key performance indicators for the job.For the above job you can calculate the followingNow that you have the cluster sizing on-prem, the next step is to identify the initial cluster size on Google Cloud. Calculate initial Dataproc cluster sizeFor this exercise assume you are using n2-standard-8, but a different machine type might be more appropriate depending on the type of workload. n2-standard-8 has 8 vCPUs and 32 GiB of memory. View other Dataproc-supported machine types here.Calculate the number of machines required based on the number of vCores required.Recommendations based on the above calculations:Take note of the calculations for your own job/workload.b. Via an autoscaling clusterAlternatively, an autoscaling cluster can help determine the right number of workers for your application. This cluster will have an autoscaling policy attached. Set the autoscaling policy min/max values to whatever your project/organization allows. Run your jobs on this cluster. Autoscaling will continue to add nodes until the YARN pending memory metric is zero. A perfectly sized cluster minimizes the amount of YARN pending memory while also minimizing excess compute resources.Deploying a sizing Dataproc clusterExample: 2 primary workers (n2-standard-8)0 secondary workers (n2-standard-8)pd-standard 1000GBAutoscaling policy: 0 min, 100 max.No application properties set.sample-autoscaling-policy.ymlcode_block[StructValue([(u’code’, u’workerConfig:rn minInstances: 2rn maxInstances: 2rnsecondaryWorkerConfig:rn minInstances: 0rn maxInstances: 100rnbasicAlgorithm:rn cooldownPeriod: 5mrn yarnConfig:rn scaleUpFactor: 1.0rn scaleDownFactor: 1.0rn gracefulDecommissionTimeout: 1hr’), (u’language’, u”), (u’caption’, <wagtail.wagtailcore.rich_text.RichText object at 0x3ebfda5cd190>)])]code_block[StructValue([(u’code’, u’gcloud dataproc autoscaling-policies import policy-namern –source=sample-autoscaling-policy.yml \rn –region=regionrnrngcloud dataproc clusters create cluster-name \rn –master-machine-type=n2-standard-8 \rn –worker-machine-type=n2-standard-8 \rn –master-boot-disk-type=pd-standard \rn –master-boot-disk-size=1000GBrn –autoscaling-policy=policy-name rn –region=region’), (u’language’, u”), (u’caption’, <wagtail.wagtailcore.rich_text.RichText object at 0x3ebfc6803ed0>)])]Submitting Jobs to Dataproc Clustercode_block[StructValue([(u’code’, u”gcloud dataproc jobs submit spark \rn –cluster=cluster-name \rn –region=region \rn –jar=<your-spark-jar-path> \rn –properties=’spark.executor.cores=5,spark.executor.memory=4608mb’ \rn — arg1 arg2″), (u’language’, u”), (u’caption’, <wagtail.wagtailcore.rich_text.RichText object at 0x3ebfe510d7d0>)])]Monitoring Worker Count / YARN NodeManagersObserve the peak number of workers required to complete your job.To calculate the number of required cores, multiply the machine size (2,8,16,etc. by the number of node managers.) 3. Optimize Dataproc cluster configurationUsing a non-autoscaling cluster during this experimentation phase can lead to the discovery of more accurate machine-types, persistent disks, application properties, etc. For now, build an isolated non-autoscaling cluster for your job that has the optimized number of primary workers.Example: N primary workers (n2-standard-8)0 secondary workers (n2-standard-8)pd-standard 1000GBNo autoscaling policyNo application properties setDeploying a non-autoscaling Dataproc clustercode_block[StructValue([(u’code’, u’gcloud dataproc clusters create cluster-name \rn –master-machine-type=n2-standard-8 \rn –worker-machine-type=n2-standard-8 \rn –master-boot-disk-type=pd-standard \rn –master-boot-disk-size=1000GB \rn –region=region \rn –num-workers=x’), (u’language’, u”), (u’caption’, <wagtail.wagtailcore.rich_text.RichText object at 0x3ebfe510d1d0>)])]Choose the right machine type and machine sizeRun your job on this appropriately-sized non-autoscaling cluster. If the CPU is maxing out, consider using C2 machine type. If memory is maxing out, consider using N2D-highmem machine types. Prefer using smaller machine types (e.g. switch n2-highmem-32 to n2-highmem-8). It’s okay to have clusters with hundreds of small machines. For Dataproc clusters, choose the smallest machine with maximum network bandwidth (32 Gbps). Typically these machines are n2-standard-8 or n2d-standard-16.On rare occasions you may need to increase machine size to 32 or 64 cores. Increasing your machine size can be necessary if your organization is running low on IP addresses or you have heavy ML or processing workloads. Refer to Machine families resource and comparison guide | Compute Engine Documentation | Google Cloud for more information.Submitting Jobs to Dataproc Clustercode_block[StructValue([(u’code’, u’gcloud dataproc jobs submit spark \rn –cluster=cluster-name \rn –region=region \rn –jar=<your-spark-jar-path> \rn — arg1 arg2′), (u’language’, u”), (u’caption’, <wagtail.wagtailcore.rich_text.RichText object at 0x3ebfd978bf90>)])]Monitoring Cluster MetricsMonitor memory to determine machine-type:Monitor CPU to determine machine-type:Choose the right persistent diskIf you’re still observing performance issues, consider moving from pd-standard to pd-balanced or pd-ssd.Standard persistent disks (pd-standard) are best for large data processing workloads that primarily use sequential I/Os. For PD-Standard without local SSDs, we strongly recommend provisioning 1TB (1000GB) or larger to ensure consistently high I/O performance. Balanced persistent disks (pd-balanced) are an alternative to SSD persistent disks that balance performance and cost. With the same maximum IOPS as SSD persistent disks and lower IOPS per GB, a balanced persistent disk offers performance levels suitable for most general-purpose applications at a price point between that of standard and SSD persistent disks.SSD persistent disks (pd-ssd) are best for enterprise applications and high-performance database needs that require lower latency and more IOPS than standard persistent disks provide.For similar costs, pd-standard 1000GB == pd-balanced 500GB == pd-ssd 250 GB. Be certain to review performance impact when configuring disk. See Configure Disks to Meet Performance Requirements for information on disk I/O performance. View Machine Type Disk Limits for information on the relationships between machine types and persistent disks. If you are using 32 core machines or more, consider switching to multiple Local SSDs per node to get enough performance for your workload. You can monitor HDFS Capacity to determine disk size. If HDFS Capacity ever drops to zero, you’ll need to increase the persistent disk size.If you observe any throttling of Disk bytes or Disk operations, you may need to consider changing your cluster’s persistent disk to balanced or SSD:Choose the right ratio of primary workers vs. secondary workersYour cluster must have primary workers. If you create a cluster and you do not specify the number of primary workers, Dataproc adds two primary workers to the cluster. Then you must determine if you prioritize performance or cost optimization.If you prioritize performance, utilize 100% primary workers. If you prioritize cost optimization, specify the remaining workers to be secondary workers. Primary worker machines are dedicated to your cluster and provide HDFS capacity. On the other hand, secondary worker machines have three types: spot VMs, standard preemptible VMs, and non-preemptible VMs. As a default, secondary workers are created with the smaller of 100GB or the primary worker boot disk size. This disk space is used for local caching of data and do not run HDFS. Be aware that secondary workers may not be dedicated to your cluster and may be removed at any time. Ensure that your application is fault-tolerant when using secondary workers.Consider attaching Local SSDsSome applications may require higher throughput than what Persistent Disks provide. In these scenarios, experiment with Local SSDs. Local SSDs are physically attached to the cluster and provide higher throughput than persistent disks (see the Performance table). Local SSDs are available at a fixed size of 375 gigabytes, but you can add multiple SSDs to increase performance.Local SSDs do not persist data after a cluster is shut down. If persistent storage is desired, you can use SSD persistent disks, which provide higher throughput for their size than standard persistent disks. SSD persistent disks are also a good choice if partition size will be smaller than 8 KB (however, avoid small paritions).Like Persistent Disks, continue to monitor any throttling of Disk bytes or Disk operations to determine whether Local SSDs are appropriate:Consider attaching GPUsFor even more processing power, consider attaching GPUs to your cluster. Dataproc provides the ability to attach graphics processing units (GPUs) to the master and worker Compute Engine nodes in a Dataproc cluster. You can use these GPUs to accelerate specific workloads on your instances, such as machine learning and data processing.GPU drivers are required to utilize any GPUs attached to Dataproc nodes. You can install GPU drivers by following the instructions for this initialization action.Creating Cluster with GPUscode_block[StructValue([(u’code’, u’gcloud dataproc clusters create cluster-name \rn –region=region \rn –master-accelerator type=nvidia-tesla-k80 \rn –worker-accelerator type=nvidia-tesla-k80,count=4 \rn –secondary-worker-accelerator type=nvidia-tesla-k80,count=4rn –initialization-actions gs://goog-dataproc-initialization-actions-${REGION}/gpu/install_gpu_driver.sh’), (u’language’, u”), (u’caption’, <wagtail.wagtailcore.rich_text.RichText object at 0x3ebfda9ecbd0>)])]Sample cluster for compute-heavy workload:code_block[StructValue([(u’code’, u’gcloud dataproc clusters create cluster-name \rn –master-machine-type=c2-standard-30 \rn –worker-machine-type=c2-standard-30 \rn –master-boot-disk-type=pd-balanced \rn –master-boot-disk-size=500GB \rn –region=region \rn –num-workers=10′), (u’language’, u”), (u’caption’, <wagtail.wagtailcore.rich_text.RichText object at 0x3ebfda9ecb90>)])]4. Optimize application-specific propertiesIf you’re still observing performance issues, you can begin to adjust application properties. Ideally these properties are set on the job submission, isolating properties to their respective jobs. View the best practices for your application below.Spark Job TuningHive Performance TuningTez Memory TuningPerformance and Efficiency in Apache PigSubmitting Dataproc jobs with propertiescode_block[StructValue([(u’code’, u”gcloud dataproc jobs submit spark \rn –cluster=cluster-name \rn –region=region \rn –jar=my_jar.jar \rn –properties=’spark.executor.cores=5,spark.executor.memory=4608mb’ \rn — arg1 arg2″), (u’language’, u”), (u’caption’, <wagtail.wagtailcore.rich_text.RichText object at 0x3ebfe59c08d0>)])]5. Handle edge-case workload spikes via an autoscaling policyNow that you have an optimally sized, configured, tuned cluster, you can choose to introduce autoscaling. Autoscaling should not be viewed as a cost-optimization technique because aggressive up/down scaling can lead to Dataproc job instability. However, conservative autoscaling can improve Dataproc cluster performance during edge-cases that require more worker nodes.Use ephemeral clusters (see next step) to allow clusters to scale up, and delete them when the job or workflow is complete.Ensure primary workers make up >50% of your cluster.Avoid autoscaling primary workers. Primary workers run HDFS Datanodes, while secondary workers are compute-only workers. HDFS’s Namenode has multiple race conditions that cause HDFS to get into a corrupted state that causes decommissioning to get stuck forever. Primary workers are more expensive but provide job stability and better performance. The ratio of primary workers vs. secondary workers is a tradeoff you can make; stability versus cost.Note: Having too many secondary workers can create job instability. Best practice indicates to avoid having a majority of secondary workers. Prefer ephemeral, non-autoscaled clusters where possible.Allow these to scale up and delete them when jobs are complete.As stated earlier, you should avoid scaling down workers because it can lead to job instability. Set scaleDownFactor to 0.0 for ephemeral clusters.Creating and attaching autoscaling policiessample-autoscaling-policy.ymlcode_block[StructValue([(u’code’, u’workerConfig:rn minInstances: 10rn maxInstances: 10rnsecondaryWorkerConfig:rn maxInstances: 50rnbasicAlgorithm:rn cooldownPeriod: 4mrn yarnConfig:rn scaleUpFactor: 1.0rn scaleDownFactor: 0rn gracefulDecommissionTimeout: 0rnrnrngcloud dataproc autoscaling-policies import policy-namern –source=sample-autoscaling-policy.yml \rn –region=regionrnrngcloud dataproc clusters update cluster-name rn –autoscaling-policy=policy-name rn –region=region’), (u’language’, u”), (u’caption’, <wagtail.wagtailcore.rich_text.RichText object at 0x3ebfe4027710>)])]6. Optimize cost and reusability via ephemeral Dataproc clustersThere are several key advantages of using ephemeral clusters:You can use different cluster configurations for individual jobs, eliminating the administrative burden of managing tools across jobs.You can scale clusters to suit individual jobs or groups of jobs.You only pay for resources when your jobs are using them.You don’t need to maintain clusters over time, because they are freshly configured every time you use them.You don’t need to maintain separate infrastructure for development, testing, and production. You can use the same definitions to create as many different versions of a cluster as you need when you need them.Build a custom imageOnce you have satisfactory cluster performance, you can begin to transition from a non-autoscaling cluster to an ephemeral cluster.Does your cluster have init scripts that install various software? Use Dataproc Custom Images. This will allow you to create ephemeral clusters with faster startup times. Google Cloud provides an open-source tool to generate custom images.Generate a custom imagecode_block[StructValue([(u’code’, u’git clone https://github.com/GoogleCloudDataproc/custom-images.gitrnrncd custom-images || exitrnrnpython generate_custom_image.py \rn –image-name “<image-name>” \rn –dataproc-version 2.0-debian10 \rn –customization-script ../scripts/customize.sh \rn –zone zone \rn –gcs-bucket gs://”<gcs-bucket-name>” \rn –disk-size 50 \rn –no-smoke-test’), (u’language’, u”), (u’caption’, <wagtail.wagtailcore.rich_text.RichText object at 0x3ebfd8526810>)])]Using Custom Imagescode_block[StructValue([(u’code’, u’gcloud dataproc clusters create cluster-name \rn –image=projects/<PROJECT_ID>/global/images/<IMAGE_NAME> \rn –region=region rnrngcloud dataproc workflow-templates instantiate-from-file \rn –file ../templates/pyspark-workflow-template.yaml \rn –region region’), (u’language’, u”), (u’caption’, <wagtail.wagtailcore.rich_text.RichText object at 0x3ebfd8f5f890>)])]Create a Workflow TemplateTo create an ephemeral cluster, you’ll need to set up a Dataproc workflow template. A Workflow Template is a reusable workflow configuration. It defines a graph of jobs with information on where to run those jobs.Use the gcloud dataproc clusters export command to generate yaml for your cluster config:code_block[StructValue([(u’code’, u’gcloud dataproc clusters export my-cluster \rn –region=region \rn –destination=my-cluster.yaml’), (u’language’, u”), (u’caption’, <wagtail.wagtailcore.rich_text.RichText object at 0x3ebfd8f5fe10>)])]Use this cluster config in your workflow template. Point to your newly created custom image, your application, and add your job specific properties.Sample Workflow Template (with custom image)code_block[StructValue([(u’code’, u’—rnjobs:rn – pysparkJob:rn properties:rn spark.pyspark.driver.python: ‘/usr/bin/python3’rn args:rn – “arg1″rn mainPythonFileUri: gs://<path-to-python-script>rn stepId: step1rn placement:rn managedCluster:rn clusterName: cluster-namern config:rn gceClusterConfig:rn zoneUri: zonern masterConfig:rn diskConfig:rn bootDiskSizeGb: 500rn machineTypeUri: n1-standard-4rn imageUri: projects/<project-id>/global/images/<image-name>rn workerConfig:rn diskConfig:rn bootDiskSizeGb: 500rn machineTypeUri: n1-standard-4rn numInstances: 2rn imageUri: projects/<project-id>/global/images/<image-name>rn initializationActions:rn – executableFile: gs://<path-to-init-script>rn executionTimeout: ‘3600s”), (u’language’, u”), (u’caption’, <wagtail.wagtailcore.rich_text.RichText object at 0x3ebfc6650cd0>)])]Deploying an ephemeral cluster via a workflow templatecode_block[StructValue([(u’code’, u’gcloud dataproc workflow-templates instantiate-from-file \rn –file ../templates/pyspark-workflow-template.yaml \rn –region region’), (u’language’, u”), (u’caption’, <wagtail.wagtailcore.rich_text.RichText object at 0x3ebfc6650e10>)])]Dataproc Workflow Templates provide a dataproc orchestration solution for use-cases such as:Automation of repetitive tasksTransactional fire-and-forget API interaction modelSupport for ephemeral and long-lived clustersGranular IAM securityFor broader data orchestration strategies, consider a more comprehensive data orchestration service like Cloud Composer.Next stepsThis post demonstrates how you can optimize Dataproc job stability, performance, and cost-effectiveness. Use Workflow templates to deploy a configured ephemeral cluster that runs a Dataproc job with calculated application-specific properties. Finally, there are many ways that you can continue striving for maximum optimal performance. Please review and consider the guidance laid out in the Google Cloud Blog. For general best practices, check out Dataproc best practices | Google Cloud Blog. For guidance on running in production, check out 7 best practices for running Cloud Dataproc in production | Google Cloud Blog.
Quelle: Google Cloud Platform