Next ’21 is on: Top five things to do at Google Cloud Next

Google Cloud Next is less than a week away. Register now to join us October 12–14, 2021, for our no-cost, three-day flagship event to discover live and on-demand content that allows you to connect with experts, see the latest tech in action, and sharpen your skills around all things cloud.To make the most of Next ’21, be sure to check out as many of these top five things to do as possible:Kick off the first two days with a keynote. On October 12 at 9 AM PT, get your daily dose of cloud insights from leaders like Google and Alphabet CEO Sundar Pichai and Google Cloud CEO Thomas Kurian. On day two, be sure to catch the Developer keynote with Google Cloud SVP of Technical Infrastructure Urs Hölzle where he reveals our vision for the top three cloud technology trends for the next decade.Customize your content. Search and filter the catalog to find your favorite sessions, build your own playlists, and share them on Twitter, LinkedIn, and more – don’t forget to tag your posts with #GoogleCloudNext. Need some inspiration? Check out our personal playlists like Advanced app dev for developers! from Director of Product Management Aparna Sinha, Developer Advocate Stephanie Wong’s Looking for more technical data sessions? – and my own, Marketers who love data, with a side of collaboration. Or take a quick quiz and we’ll build a suggested playlist based on your availability and interests.Engage with experts. Get help solving your toughest business challenges. Participate in expert-led live Q&As with topics on data cloud, open cloud infrastructure, and more than 40 online interactive labs. Meet your peers in over 20 community conversations covering everything from building with Google Workspace to getting started with Vertex AI. Or chat with the Women Techmakers team, the authors of the 2021 State of DevOps report, or Google developers from APAC, EMEA and India.Dive in to demos. See how forward-thinking businesses use Google Cloud with our featured demos. Chess.com drives the future of the 1,500-year-old game by scaling to meet the demands of 11 million live matches per day with in-game, real-time player feedback. And international automaker Renault built its industry data management platform on Google Cloud to optimize production and operations worldwide. Chat with presenters at our live demos as you learn what’s new with Google Workspace, how to go beyond the basics of zero trust with BeyondCorp Enterprise, and more. Take action with Diversity, Equity & Inclusion (DEI) sessions. Learn how you can champion diversity, build community, and drive change with data-driven DEI discussions and sessions that explore how to turn core DEI values into real-world impact. Learn how healthcare providers enable accessible healthcare through technology to predict outcomes and craft personalized prevention plans. Or join Jim Hogan, principal innovation strategist at Google Cloud, in conversation with one of the founders of the internet, Vint Cerf, as they discuss how Cerf’s personal experiences with disability led to his belief that accessibility is the cornerstone of innovation.Be sure to tune in to Next ’21 on October 12–14 to get informed, be inspired, and expand your expertise.Related ArticleNext OnAir as it happens: All the announcements in one placeWe’ll be sharing lots of news, updates, and learning opportunities throughout Next OnAir. Check back here to see a running list of what’s…Read Article
Quelle: Google Cloud Platform

BigQuery migrations made easy

Migrations are not easy: they take time, energy and effort to make them successful. BigQuery makes it easier with customizable tools and years of expertise to help out with your journey to the cloud. In line with our commitment to providing an open and flexible platform, we have built these migration tools following an open approach which enables flexibility and choice for you and your partners when migrating to BigQuery. Comprehensive solution for migration to BigQueryToday, we are announcing the preview of BigQuery Migration Service, a set of free-to-use tools to help you with your end-to-end migration needs. This service speeds up Teradata to BigQuery migrations with tooling covering migration planning, data transfer, automated SQL/script conversion and data verification. Support for additional data warehouses is coming soon.Assessment: Plan and manage migration risks and costsWhen we work with customers and partners on migrations, the most important step is to understand their ecosystem, requirements and business goals. We use this information to create a custom migration plan to help prepare and execute migrations. Over and over again, we have seen that identifying and addressing migration complexities ahead of time leads to reduced TCO and lower risk migrations.To that end, we are excited to announce private preview of our automated assessment tool as part of the BigQuery Migration Service. Assessment leverages our many years of experience helping some of the large organizations in the world modernize with BigQuery. It provides an easy and automated way to collect statistics from your legacy warehouse and generates a state analysis report consisting of: List of database objects, data I/O patterns and dependenciesAutomated query translation coverage and resultsQuery-to-Object mapping (e.g., which tables, views, functions it uses)User-to-Table mapping (e.g., which users access which tables)Table correlations (e.g., tables which are often joined or sub queried)List of BI/ETL tools in useThe summary report helps you efficiently prioritize and have a clear understanding of all the components and the amount of work required to execute a migration. In addition, all the underlying assessment data is made available within a BigQuery dataset for complete customization and ad-hoc analysis for you and your migration partners. SQL translation: Reduce manual effort, time and errors One of the hardest pieces of a data warehouse migration is modernizing legacy business logic, such as SQL queries, scripts and stored procedures. This process normally involves substantial manual query rewrites and verifications, which is time consuming and error prone. Today, we are excited to announce the public preview of batch and interactive SQL translation which helps automate much of this process, thus speeding up your path to a successful migration. Batch and interactive SQL translation provides fast, semantically correct and human readable translations of legacy objects with no ongoing dependencies post migration. It supports a broad range of Teradata artifacts including DML, DDL and BTEQ. Translations can be run in batch mode or ad-hoc directly from the BigQuery SQL workspace. Early users of SQL translation saw ~95% successful translations on 10M+ queries, leaving only ~5% of queries for manual review with their migration partners. Interactive SQL translation provides a split view within the BigQuery SQL editor. Users can type in SQL queries in non-BigQuery dialects and view the translated BigQuery SQL immediately. Interactive SQL translation provides users with a live, real time SQL translation tool which allows users to self-serve translation of their queries in parallel with a centralized large-scale SQL migration effort. This not only reduces the time and effort for analysts to migrate their queries, but also increases how quickly they learn to leverage the modern capabilities of BigQuery.Data Validation: Verify correctness of dataData validation is a crucial step in data warehouse migration projects. It compares structured and semi-structured data from the source and target to confirm data and logic has been moved correctly. The GCP Data Validation Tool (DVT) is an open sourced CLI tool that leverages open-source frameworks. It offers customized multi-level validation functions to compare source and target tables on the table level, column level, and row level. It is also flexible, meaning that new validation rules can easily be plugged in as you see fit. Furthermore, to facilitate automation, orchestration and scheduling, it can also be integrated with Cloud Functions, Cloud Run, and Composer for recurring validation.Customize BigQuery Migration Service to your needsWith BigQuery Migration Service we are fast tracking, simplifying and de-risking your migration so that you can modernize your data warehouse with BigQuery, a truly serverless and modern data warehouse, with confidence. We are starting with Teradata migration capabilities, but will add support for additional data warehouses soon. We have built end-to-end tools with openness top-of-mind which you and your migration partner of choice can customize to help ensure a successful migration. From assessment which streamlines metrics collection and exposes the raw dataset for full customization to our open source Data Validation Tool, where you and your partner can add custom validation logic, we are committed to giving you migrations tools you can customize to your unique needs. Our tools are freely available to help speed up your migration. If you would like to leverage our tools for an upcoming proof-of-concept or migration, reach out to your favorite GCP partner, your GCP sales rep or check out our documentation. We look forward to partnering with you on your journey to the cloud.
Quelle: Google Cloud Platform

Get started, build and grow your Startup on Google Cloud

We understand how crucial it is for startups that are experimenting with technologies, to get the right support on this journey, build fast, optimize and scale. At Google Cloud, we want to help you build your business and partner with you at every stage of your startup journey.Elevate your startup with our how-to guided series We’re very excited to announce the launch of Google Cloud Technical Guides for Startups, a video series for technical enablement aimed at helping startups to start, build and grow their businesses successfully and sustainably on Google Cloud.Through this multi series, you will not only be guided on how your startup can get started on Google Cloud, you will also be able to understand how other startups are leveraging our solutions across industries.This is a three part video series designed to match your startup’s stage of growth:The Start Series: Begin by building, deploying and managing new applications on Google Cloud from start to finish.The Build Series: Optimize and scale existing deployments to reach your target audiences.The Grow Series: Grow and attain scale with deployments on Google Cloud.Get started with the first episodeWe have launched  the Start Series, focused on the early stage startups and how to get started on Google Cloud by building and deploying new applications. Check out the first episode of the series here.Join us on this journeyWe hope that you will come with us on this journey, as we navigate through the topics on Google Cloud for startups  through the Start, Build, Grow Series together.  Join us by checking out the video series on the Google Cloud Tech channel, and subscribe to stay up to date. We can’t wait to see you there.
Quelle: Google Cloud Platform

Analyzing Twitter sentiment with new Workflows processing capabilities

The Workflows team recently announced the general availability of iteration syntax and connectors! Iteration syntax supports easier creation and better readability of workflows that process many items. You can use a for loop to iterate through a collection of data in a list or map, and keep track of the current index. If you have a specific range of numeric values to iterate through, you can also use range-based iteration. Click to enlargeConnectors have been in preview since January. Think of connectors like client libraries for workflows to use other services. They handle authentication, request formats, retries, and waiting for long-running operations to complete. Check out our previous blog post for more details on connectors. Since January, the number of available connectors has increased from 5 to 20.The combination of iteration syntax and connectors enables you to implement robust batch processing use cases. Let’s take a look at a concrete sample. In this example, you will create a workflow to analyze sentiments of the latest tweets for a Twitter handle. You will be using the Cloud Natural Language API connector and iteration syntax.APIs for Twitter sentiment analysisThe workflow will use the Twitter API and Natural Language API. Let’s take a closer look at them.Twitter API To use the Twitter API, you’ll need a developer account. Once you have the account, you need to create an app and get a bearer token to use in your API calls. Twitter has an API to search for Tweets. Here’s an example to get 100 Tweets from the @GoogleCloudTech handle using the Twitter search API:Natural Language APINatural Language API uses machine learning to reveal the structure and meaning of text. It has methods such as sentiment analysis, entity analysis, syntactic analysis, and more. In this example, you will use sentiment analysis. Sentiment analysis inspects the given text and identifies the prevailing emotional attitude within the text, especially to characterize a writer’s attitude as positive, negative, or neutral.You can see a sample sentiment analysis response here. You will use the score of documentSentiment to identify the sentiment of each post. Scores range between -1.0 (negative) and 1.0 (positive) and correspond to the overall emotional leaning of the text. You will also calculate the average and minimum sentiment score of all processed tweets.Define the workflowLet’s start building the workflow in a workflow.yaml file.In the init step, read the bearer token, Twitter handle, and max results for the Twitter API as runtime arguments. Also initialize some sentiment analysis related variables:In the searchTweets step, fetch tweets using the Twitter API:In the processPosts step, analyze each tweet and keep track of the sentiment scores. Notice how each tweet is analyzed using the new for-in iteration syntax with its access to the current index.Under the processPosts step, there are multiple substeps. The analyzeSentiment step uses the Language API connector to analyze the text of a tweet and the next two steps calculate the total sentiment and keep track of the minimum sentiment score and index:Once outside the processPosts step, calculate the average sentiment score, and then log and return the resultsDeploy and execute the workflowTo try out the workflow, let’s deploy and execute it.Deploy the workflow:Execute the workflow (don’t forget to pass in your own bearer token):After a minute or so, you should see the see the result with sentiment scores:NextThanks to the iteration syntax and connectors, we were able to read and analyze Tweets in an intuitive and robust workflow with no code. Please reach out to @meteatamel and krisabraun@ for questions and feedback.Twitter sentiment analysis on GitHub.Share feedback, interesting use cases and customer requestsRelated ArticleIntroducing Workflows callbacksIntroducing Workflows callbacks. Thanks to callbacks, you can put a human being or autonomous system into the loop. If your processes req…Read Article
Quelle: Google Cloud Platform

Serving predictions & evaluating Recommendations AI

In this post we’ll show how to use Recommendations AI to display predictions on a live website and set up A/B experiments to measure performance. A/B testing involves creating two or more versions of a page and then splitting user traffic into groups to determine the impact of those changes. This is the most effective way to measure the impact of Recommendations AI. You can use A/B testing to test Recommendations AI against an existing recommender, or if you don’t have any recommendations on your site currently you can measure the impact of a recommender like Recommendations AI. You can also test different placement locations on a page or different options to find the optimal settings for your site.If you’ve been following the previous Recommendations AI blog posts you should now have a model created and you’re ready to serve live recommendations (also called “predictions”). Using the Retail API predict method you specify which serving config to use, and given some input data a list of item id’s will be returned as a prediction.Predict MethodThe predict method is how you get recommendations back from Recommendations AI. Based on the model type objectives, those predictions are returned in an ordered list, with the highest probability items returned first. Based on the input data, you’ll get a list of item id’s back that can then be displayed to end users.The predict method is authenticated via OAuth using a service account. Typically, you’ll want to create a service account dedicated to predict requests and assign the role of “Retail Viewer”. The retail documentation has an example of how to call predict with curl. For a production environment however, we would usually recommend using the retail client libraries.The predict request requires a few fields:placement id (serving config)Passed as part of the urluserEventSpecifies the required fields for the model being called. This is separate (and can be different) from the actual user event sent on the corresponding page view. It is used to pass the required information to the model:eventTypehome-page-view, detail-page-view, add-to-cart, etcvisitorIdRequired for all requests. This is typically a session iduserInfo.userIdId of logged in user (not required, but strongly recommended when a user is logged in or otherwise identifiable)productDetails[].product.idRequired for models that use product ids (Others You May Like, Similar Items, Frequently Bought Together). Not required for Recommended For You recommendations since those are simply based on vistorId/userId history.You can pass in a single product (product detail page placements) or a list of products (cart pages, order complete, category pages, etc.)There are also some optional fields that are used to control the results:filterUsed to filter on custom tags that are included as part of the catalog. Can also filter out OUT_OF_STOCK items.pageSizeControls how many predictions are returned in the responseparamsVarious parameters:returnProduct returns the full product data in the response (id’s only is the default), returnScore returns a probability score for each itempriceRerankLevel and diversityLevel control the rerank and diversity settingsThe prediction response can be used however you like. Typically the results are incorporated into a web page, but you could also use these results to provide personalized emails or recommendations within an application. Keep in mind that most of the models are personalized in real-time, so the results shouldn’t be cached or stored for long periods of time since they will usually become outdated quickly.Serving Recommendations client-sideReturning results as part of the full web page response is one method of incorporating recommendations into a page, but there are some drawbacks. As a “blocking” request, a server-side implementation can add some latency to the overall page response, it also tightly couples the page serving code to the recommendations code. A server-side integration may also limit the recommendations serving code to serving web results only, so a separate handler may be needed for a mobile application.An Ajax implementation of Recommendations can solve these issues. There is no direct API endpoint for Recommendations AI that can be called directly from client-side JavaScript since the predict method requires authentication, however it is easy to implement a handler to serve Ajax requests. This can be a webapp or endpoint deployed within your existing serving infrastructure, or deploying on App Engine or a Google Cloud Function are also good alternatives.Google Cloud Functions (GCF) are a great serverless way to quickly deploy this type of handler. An example GCF for Recommendations AI can be found here. This example uses python and the retail client library to provide an endpoint that can return Recommendations responses in JSON or HTML.This video shows how to set up the cloud function and call it from a web page to render results in a <div>.A/B testing recommendationsOnce you have finished the frontend integration for Recommendations AI, you may want to evaluate them on your site. The best way to test changes is usually a live A/B test.A/B testing for Recommendations may be useful for testing and comparing various changes:Existing recommender vs. Google Recommendations AIGoogle Recommendations vs. no recommenderVarious models or serving changes (CTR vs. CVR optimized, or changes to price re-ranking & diversity)UI changes or different placements on a pageThere are some more A/B testing tips for Recommendations AI here.In general, A/B testing involves splitting traffic into 2 or more groups and serving different versions of a page to each group, then reporting the results. You may have a custom in-house A/B testing framework or a 3rd-party A/B testing tool, but as an example here we’ll show how to use Google Optimize to run a basic A/B test for Recommendations AI.Google Optimize & AnalyticsIf you’re already using Google Analytics, Google Optimize provides easy-to-manage A/B experiments and displays the results as a Google Analytics report. To use Google Optimize, simply link your Optimize account to Google Analytics, and install the Optimize tag. Once installed, you can create and run new experiments without any server-side code changes.Google Optimize is primarily designed for front-end tests: any UI or DOM changes, CSS. Optimize can also add JavaScript to each variant of an experiment, which is useful when testing content that is displayed via an Ajax call (e.g. our cloud function). Doing an A/B experiment with server-side rendered content is possible, but usually this needs to be implemented by doing a Redirect test or by using the Optimize JavaScript API.As an example, let’s assume we want to test two different models on the same page: Similar Items & Others You Make Like. Both models take a product id as input and are well-suited for a product details page placement. For this example we’ll assume a cloud function or other service is running that returns the recommendations in HTML format. These results can then be inserted into a div and displayed on page load. The basic steps to configure an Optimize experiment here are:Click Create Experience in Google Optimize control panelGive your experience a name and select A/B test as the experience typeAdd 2 variants: one for Others You May Like, another for Similar ItemsSet variants weights to 0 for Original and 50%/50% for the 2 variantsEdit each variant and add your Ajax call to “Global JavaScript code” to populate the divAdd a url match rule to Page targeting to match all of your product detail pagesChoose primary and secondary objectives for your experimentRevenue or Transactions for example, and Recommendation Clicks or another useful metric for secondaryChange any other optional settings like Traffic allocation as necessaryVerify your installation and click Start to start your experimentIn this scenario we have an empty <div> on the page by default, and then we create two variants that call our cloud function with a different placement id on each variant. You could use an existing <div> with the current recommendations for the Original version and then just have one variant, but this will cause unneeded calls to the recommender and may cause the display to flicker as the existing <div> content is changed.Once the experiment is running you can click into the Reporting tab to view some metrics:Optimize will predict a winner of the experiment based on the primary objective. But to view more detailed reports click the “View in Analytics” button and you’ll be able to view all metrics that Analytics has for the different segments in the experiment:In this case it’s difficult to choose a clear winner, but we can see that the Similar Items model is providing a bit more Revenue per Session, and viewing the other goals shows a higher click through rate. We could choose to run the experiment longer, or try another experiment with different options. Most retailers run A/B experiments continually to test new features and options on the site to find what works best for their business objectives, so your first A/B test is usually just the start.For more information please see the main Retail documentation, and some more tips for A/B experiments with Recommendations AI.Related ArticleRecommendations AI modelingIn this series of Recommendations AI deep dive blog posts, we started with an overview of Recommendations AI and then walked through the …Read Article
Quelle: Google Cloud Platform

Debugging Vertex AI training jobs with the interactive shell

Training a machine learning model successfully can be a challenging and time consuming task. Unlike typical software development, the results of training depend on both the training code and the input data. This can make debugging a training job a complex process, even when you’re running it on your local machine. Running code on remote infrastructure can make this task even more difficult. Debugging code that runs in a managed cloud environment can be a tedious and error-prone process since the standard tools used to debug programs locally aren’t available in a managed environment. Also, training jobs can get stuck and stop making progress without visible logs or metrics. Interactive access to the job has the potential to make the entire debugging process significantly easier.In this article, we introduce the interactive shell, a new tool available to users of Vertex AI custom training jobs. This feature gives you direct shell-like access to the VM that’s running your code, giving you the ability to run arbitrary commands to profile or debug issues that can’t be resolved through logs or monitoring metrics. You can also run commands using the same credentials as your training code, letting you investigate permissions issues or other problems that are not locally reproducible. Access to the interactive shell is authenticated using the same set of IAM permissions used for regular custom training jobs, providing a secure interface to the Vertex AI training environment.Example: TensorFlow distributed trainingLet’s take a look at one example where using the interactive shell in Vertex AI can be useful to debug a training program. In this case, we’ll intentionally submit a job to Vertex AI training that deadlocks and stops making progress. We’ll use py-spy in the interactive shell to understand the root cause of the issue. Vertex AI is a managed ML platform that provides a useful way to scale up your training jobs to take advantage of additional compute resources. To run your TensorFlow trainer across multiple nodes or accelerators, you can use TensorFlow’s distribution strategy API, the TensorFlow module for running distributed computation. To use multiple workers, each with one or more GPUs, we’ll use tf.distribute.MultiWorkerMirroredStrategy, which uses an all-reduce algorithm to synchronize gradient updates across multiple devices.Setting up your codeWe’ll use the example from the Vertex AI Multi-Worker Training codelab. In this codelab, we train an image classification model on the Tensorflow Cassava dataset using a ResNet50 model pre-trained on Imagenet. We’ll run the training job on multiple nodes using tf.distribute.MultiWorkerMirroredStrategy. In the codelab, we create a custom container for the training code and push it to Google Container Registry (GCR) in our GCP project.Submitting a jobBecause tf.distribute.MultiWorkerMirroredStrategy is a synchronous data parallel algorithm, all workers must have the same number of GPUs. This is from the MultiWorkerMirroredStrategy docs, which say that “All workers need to use the same number of devices, otherwise the behavior is undefined”. We can trigger the example deadlock behavior by submitting a training job with different numbers of GPUs in two of our worker pools, and see that this will cause the job to hang indefinitely. Since logs aren’t printed out while the job is stuck, and the utilization metrics won’t show any usage either, we’ll use the interactive shell to investigate. We can get the exact call stack of where the job is stuck, which can be helpful for further analysis. You can use the Cloud Console, REST API, Python SDK, or gcloud to submit Vertex AI Training Jobs. Simply set the customJobSpec.enableWebAccess API field to true in your job request. We’ll use the Cloud Console to submit a job with the interactive shell enabled. If you use the Cloud Console:In Training method, select No managed dataset and Custom training. In Model details, expand the Advanced options dropdown and select Enable training debugging. This will enable the interactive shell for your training job. 3. In Training container, select Custom container and select the container that was pushed to GCR in the codelab (gcr.io/$PROJECT_ID/multiworker:cassava).4. In Compute and pricing, create 2 worker pools. Worker pool 0 has a single chief node with 1 GPU, and worker pool 1 has 2 workers, each with 2 GPUs. This deviates from the config used in the codelab and is what will trigger the deadlock behavior, as the different worker pools have different numbers of GPUs.Hit the Start training button and wait for the job to be provisioned. Once the job is running, we can take a look at the logs and metrics and see that it’s deadlocked. The CPU utilization metrics are stuck at 0% and nothing is printed to the logs.Accessing the interactive shellThe interactive shell is created along with your job, so it’s only available while the job is in the RUNNING state. Once the job is completed or cancelled, the shell won’t be accessible. For our example job, it should take about 5-10 mins for the job to be provisioned and start. Once the job is running, you’ll see links to the interactive shell on the job details page. One web terminal link will be created for each node in the job:Clicking one of the web terminal links opens a new tab, with a shell session running on the live VM of the training job.Using py-spy for debuggingpy-spy is a sampling profiler for Python programs and is useful for investigating issues in your training application without having to modify your code. It also supports profiling Python programs in separate processes, which is useful since the interactive shell runs as a separate process.We run pip install py-spy to install py-spy. This can either be done at container build or runtime. Since we didn’t modify our container when we enabled the interactive shell, we’ll install py-spy at runtime to investigate the stuck job. py-spy has a number of useful commands for debugging and profiling Python processes. Since the job is deadlocked, we’ll use py-spy dump to print out the current call stack of each running Python thread.Running this command on node workerpool0-0 (the chief node) gives the following result:There are a couple of useful entries in the above call stack, which are listed below:create_mirrored_variable (tensorflow/python/distribute/distribute_utils.py:306)_create_variable (tensorflow/python/distribute/mirrored_strategy.py:538)ResNet50 (tensorflow/python/keras/applications/resnet.py:458)create_model (task.py:41)From these, we can see that the code is stuck at the create_mirrored_variable method in our code’s create model function. This is the point where TensorFlow initializes the MultiWorkerMirroredStrategy and replicates the model’s variables across all the provided devices. As specified in the MultiWorkerMirroredStrategy docs, when there’s a mismatch between the number of GPUs on each machine, the behavior is undefined. In this case, this replication step hangs forever.py-spy has additional useful commands for debugging training jobs, such as py-spy top and py-spy record.  py-spy top provides a live-updating view of your program’s execution. py-spy record periodically samples the Python process and creates a flame graph showing the time spent in each function. The flame graph is written locally on the training node, so you can use gsutil to copy it to Cloud Storage for further analysis.CleanupEven though the job was stuck, we’ll still be charged for the infrastructure used while the job is running, so we should manually cancel it to avoid excess charges. We can use gcloud to cancel the job:To avoid excess charges in general, you can configure Vertex AI to automatically cancel your job once it reaches a given timeout value. Set the CustomJobSpec.Scheduling.timeout field to the desired value, after which the job will be automatically cancelled.What’s nextIn this post, we showed how to use the Vertex AI interactive shell to debug a live custom training job. We installed the py-spy profiler at runtime and used it to get a live call stack of the running process. This helped us pinpoint the root cause of the issue in the TensorFlow distribution strategy initialization code.You can also use the interactive shell for additional monitoring and debugging use cases, such as:Analyzing local or temporary files written to the node’s persistent disk.Investigating permissions issues: the interactive shell is authenticated using the same service account that Vertex AI uses to run your training code.Profiling your running training job with perf or nvprof (for GPU jobs).For more information, check out the following resources:Documentation on monitoring and debugging training with an interactive shell.Documentation on containerizing and running training code locally before submitting it to Vertex AI.Samples using Vertex AI in our Github repository.Related ArticleYour guide to all things AI & ML at Google Cloud NextA comprehensive guide to all things AI & ML at Next 2021. The list covers AI topics from Conversational AI to Document Understanding to D…Read Article
Quelle: Google Cloud Platform

Google Cloud joins forces with EDM Council to build a more secure and governed data cloud

Google Cloud joins the EDM Council to announce the release of the CDMC framework v1.1.1. This has been an industry wide effort which started in the summer of 2020, where leading cloud providers, data governance vendors and experts worked together to define the best practices for data management in the cloud. The CDMC Framework captures expertise from the group and defines clear criteria to manage, govern, secure and ensure privacy of data in the cloud. Google Cloud implements most of the mission critical controls and automations in Dataplex – Google Cloud’s own first party solution to organize, manage and ensure data governance for data across Google Clouds’ native data storage systems. Leveraging Dataplex, and working with the best practices in the CDMC framework, can ensure adequate control over sensitive data, and sensitive data workloads. Additionally, Google Clouds’ data services allow a high degree of configurability which, together with the integration with specialised data management software provided by our partners like Collibra, provide a rich eco-system for customers to implement solutions which adhere to the CDMC best practices.The CDMC framework is a joint venture between hundreds of organizations across the globe, including major Cloud Service Providers, technology service organizations, privacy firms and major consultancy and advisory firms who have come together to define best practices. The framework spans governance and accountability, cataloging and classification, accessibility and usage, protection and privacy and data lifecycle management. The framework represents a milestone in adoption of industry best practices for data management and we believe that it will contribute to build trust, confidence and accountability for the adoption of cloud, particularly for sensitive data. Capitalising on this, Google Cloud is going to make publicly available Dataplex, which will implement cataloging, lifecycle management, governance and most of the other controls in the framework (others are available on a per product basis).“Google Cloud customers, who include financial services, regulated entities, and privacy minded organizations continue to benefit from Google’s competency in handling sensitive data. The CDMC framework ensures that Google’s best practices are shared and augmented from feedback across the industry” Said Evren Eryurek, Google’s Director of Product Management at Google Cloud, a Key leader for Big Data in Google Cloud. אאThe organizing body of which Google Cloud is a member of, the EDM Council, is a global non-profit trade association, with over 250 member organizations from the US, Canada, UK, Europe, South Africa, Japan, Asia, Singapore and Australia, and over 10,000 data management professionals as members. The EDM Council provides a venue for data professionals to interact, communicate, and collaborate on the challenges and advances in data management as a critical organizational function. The Council provides research, education and exposure to how data, as an asset, is being curated today, and vision of how it must be managed in the future.For more about DataplexFor more information about CDMC Framework, and a downloadable docFor more about the EDM Council
Quelle: Google Cloud Platform

Artifact Registry for language packages now generally available

Using a centralized, private repository to host your internal code as a package not only enables code reuse, but also simplifies and secures your existing software delivery pipeline. By using the same formats and tools as you would in the open-source ecosystem, you can leverage the same advantages, simplify your build, and keep your business logic and applications secure.Language repository formats, now generally availableAs of today, support for language repositories in Artifact Registry is now generally available, allowing you to store all your language-specific artifacts in one place. Supported package types include:Java packages  (using the Maven repository format)Node.js packages (using the npm repository format)Python packages (using the PyPI repository format)OS repository formats in previewAdditionally, support for new repository formats for Linux distributions is in public preview, allowing developers to create private internal-only packages and securely use them across multiple applications deployed to Linux environments. New supported artifact formats include:Debian packages (using the Apt repository format)RPM packages (using the Yum repository format)This is in addition to existing container images and Helm charts (using the Docker repository format). Your own secure supply chainStoring your packages in Artifact Registry not only enables code reuse, but also simplifies and secures your existing build pipeline. In addition to bringing your internal packages to a managed repository, using Artifact Registry also allows you to take additional steps to improve the security of your software delivery pipeline:Use Container Analysis to scan containers that use your private packages for vulnerabilitiesInclude your repositories in a Virtual Private Cloud to control accessMonitor repository usage with Cloud Audit LogsUse the binauthz-attestation builder with Cloud Build to create attestations that Binary Authorization verifies before allowing container deploymentUse  Cloud Identity and Access Management (IAM) for repository access controlSeamless authenticationWith credential helpers to authenticate access for installers based on Cloud Identity and Access Management (IAM) permissions, using Artifact Registry to host your packages makes authentication to private repositories easy. By managing IAM groups, administrators can control access to repositories via the same tools used across Google Cloud.Regional repositories lower cost and enable data complianceArtifact Registry provides regional support, enabling you to manage and host artifacts in the regions where your deployments occur, reducing latency and cost. By implementing regional repositories, you can also comply with your local data sovereignty and security requirements.Get started todayThese repository formats are now generally available to all Artifact Registry customers. Pricing for language repositories is the same as container pricing; see the pricing documentation for details. To get started using language and OS repositories, try the quickstarts in the Artifact Registry documentation.Node.js Quickstart GuidePython Quickstart GuideJava Quickstart GuideApt Quickstart GuideRPM Quickstart GuideRelated ArticleNode, Python and Java repositories now available in Artifact RegistryExpanded language support lets you store Java, Node and Python artifacts in Artifact Registry, for a more secure software supply chain.Read Article
Quelle: Google Cloud Platform

LOVOO’s love affair with Spanner

Editor’s note: In this blog, we look at how German dating app LOVOO broke up with its monolith system for a microservices architecture, powered in part by the fully managed, scalable Cloud Spanner. Founded in 2011, LOVOO is one of Europe’s leading dating apps, available in 15 languages. We currently employ approximately 170 employees from more than 25 nations, with offices in Dresden and Berlin. LOVOO changes people’s lives by changing how they meet. We do this through innovative location-based algorithms, an app radar feature, and live streaming that helps people find successful matches through chat and real-time video. Three years ago, we started to encounter growing pains. Our user base was growing at a steady clip, and their activity within the app was growing as well. We had built the app on an on-premises monolith architecture. As we grew, the old system was unable to keep up with the speed and scale we needed to serve our users. After assessing the options available to us in 2018, Google’s open source driven approach and cutting edge technology were key drivers for our decision to migrate to Google Cloud and its managed services, including Cloud Spanner. Spanner now hosts more than 20 databases for us, powers 40 microservices and integrates perfectly with our other Google Cloud services. With Spanner’s open source auto-scaler, we can seamlessly scale from 14 to 16 nodes during busier hours in which we perform 20,000 queries per second. One of our databases handles 25 million queries per day and collects 100GB of new data every month. We feel confident in the platform’s ability to scale for our future needs and address our growing customer base while supporting new services and capabilities.Breaking up with the monolithBefore migrating to Google Cloud, our infrastructure lived on-premises and used open-source PostgreSQL as a database. However, we encountered challenges with bottlenecks in performance, difficulty scaling during peak times, and constantly needing to add new hardware. The cloud promised to give our engineers and product teams a faster, smoother development process, which was a big selling point for us. We performed a lift-and-shift migration of our architecture, but used the migration as a catalyst to modernize and make important changes. We separated some responsibilities from the monolith into microservices, moving them directly onto Google Kubernetes Engine (GKE). We started out by converting about a dozen functions from the monolith into microservices, and we’re now up to over 40 microservices that we’ve separated from the prior monolith.We performed the migration smoothly within a six month timeline, as we wanted to finish within the time remaining on our on-premises contracts. We have plans to eventually move entirely to a microservices-based architecture, but we are taking it one step at a time. Our billing database and logic is complex, and was built on PostgreSQL, our original database solution. In this specific case,  we chose to lift and shift the workload to Cloud SQL for PostgreSQL, Google’s fully managed database service. Falling in love with SpannerSpanner was our first level of support on Google Cloud, and our preferred solution for large distributed databases. Spanner is a fully managed relational database service with unlimited scale and up to 99.999% availability, which means our prior scale and speed problems are effectively solved. Our developers love managed services like Spanner because routine headaches like infrastructure management, updates, and maintenance are taken care of for us, and we can devote our energy to building new features for LOVOO. We have roughly 20 databases in one Spanner instance, with a mix of production and development databases. It’s a kind of multi-tenancy architecture, and most of our services are connected one-to-one with a database. We have 20 TB and 14 nodes (16 at peak) on one regional deployment at the moment.Among our use cases for Spanner are a notifications database, which is our largest database. This database is where we save data needed to send out notifications to our app’s users when other users take an action on their profiles, such as a view or a match. So when you indicate you are interested in a person and they have already shown interest in you, that translates to a row in the notification table. When the other person logs in, we query the new notifications they have and they will see that they matched with you.We also have a database on Spanner for our user messaging. Users have conversations in our real-time chats, and messages within those conversations may include various media types they can send to each other, such as photos, audio, and gifs. The microservice that powers this real-time chat feature has a web socket connection to the clients, and it stores the text and contents in Spanner. We have a table for conversations and a table for individual messages (where each message has a conversation id).A third use case for Spanner is with our in-app credit transaction service, where users can gift each other credits. You can think about it almost like a virtual currency payments system. So that means that we have a table with all our users and for each one we have their credit balance. And when you send out a gift, we decrease the credit number in your row and increase theirs. We also have a “payments ” ledger table that has a row for every credit gifting ever made. This capability is where Spanner’s transactional consistency shines, because we can perform all these operations automatically in one transaction.Planning a future with Google CloudWe’ve also been pleased with the Spanner Emulator, which has made our development process a lot easier.  Without needing direct access to Spanner,  an engineer can debug their code on their machine by running the emulator locally. As part of our build process, we launch an emulator so we can have our software tests run against it. Our engineers also use it to run integration tests on-demand on their machines. This ensures that the same API calls we use when we build the code will work when we deploy the code.Our plans are to build all of our new features on top of Spanner, and to continue pulling services out of our monolith. We’re currently migrating our user device representation database, which tracks all of a user’s various devices. We also want to continue moving away from PHP for future use cases, and we’d like to use Google’s gRPC, an open source communication protocol, to directly connect the clients with the microservices, instead of via PHP. With Spanner and other Google Cloud-managed services saving us time and delivering on speed and scalability, we’ll be charting our future roadmap with them on our side. Google Cloud is the right match for us.Read more about LOVOO and Cloud Spanner. Or read out how Spanner helped Merpay, a fintech enterprise, scale to millions of users.Related ArticleHow ShareChat built scalable data-driven social media with Google CloudSee how India-based social media company ShareChat migrated to Google Cloud databases and more to serve 160 million monthly active users …Read Article
Quelle: Google Cloud Platform

Model training as a CI/CD system: Part I

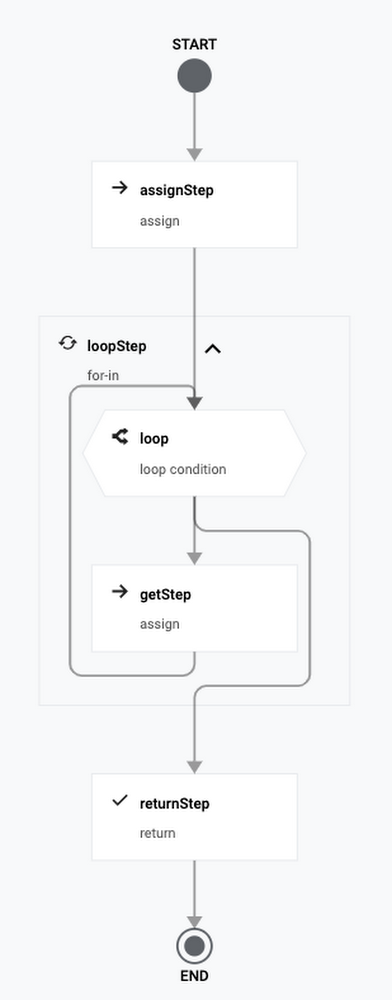
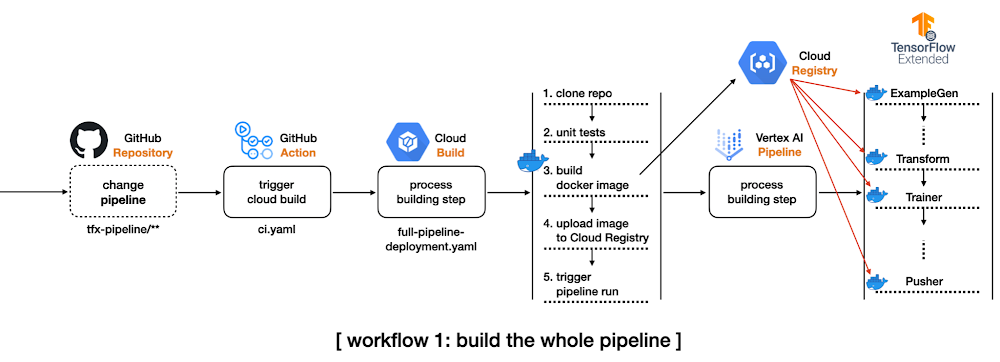
In software engineering, Continuous Integration (CI) and Continuous Delivery (CD) are two very important concepts. CI is when you integrate changes (new features, approved code commits, etc.) into your system reliably and continuously. CD is when you deploy these changes reliably and continuously. CI and CD both can be performed in isolation as well as they can be coupled. A machine learning (ML) system is essentially a software system. So, to operate with such systems scalably we need CI/CD practices in place to facilitate rapid experimentation, integration, and deployment. Here are some scenarios:As an ML Engineer, you are likely to experiment with new model architectures to improve performance. How do you reliably integrate them into the system without breaking anything? Upon availability of new data, how do you automatically trigger new training runs so that your system can adapt to the recency of the data? How do you deploy the newly trained models to different environments such as staging, pre-production, and production? Integrating a new model into the system is like adding a new feature. When operating at a large scale, the number of these new models can grow rapidly within a short period of time. This is why manual processes to deal with CI/CD are atypical. You can learn more about why having a resilient CI/CD system for your ML application is crucial for success from this excellent post.In this two-part series blog post, we will present two different scenarios of CI/CD particularly from the perspectives of model training. In this first part, we will explore how to build a complete TFX project with prebuilt components, and how to run the pipeline on Vertex AI automatically in response to the changes of the codebase.We will build on top of what we will learn in this post and extend that to automatically trigger runs based on different triggers. We will use Pub/Sub, Cloud Functions, and Cloud Scheduler along with TensorFlow Extended (TFX) and Vertex AI.To comfortably understand this series of posts, we expect that you are already familiar with the basic MLOps terminologies, TFX, Vertex AI, and GitHub Actions. ApproachIn this section, we will introduce schematics of two workflows we want to develop so that we can develop a mental image of what’s to come. In the first workflow, we want to do the following:Create a complete TFX pipeline project from TFX CLI. Modify some configurations to leverage Vertex AI, and set up a GitHub Action workflow to be triggered by detecting any changes in the tfx-pipeline directory which contains all the codebase for this project.When the GitHub Action gets executed, it will initiate a Cloud Build process.The initiated Cloud Build process clones the entire repository, builds a new docker image based on the changed codebase, pushes the docker image to the Google Container Registry(GCR), and submits the TFX pipeline to Vertex AI. For managing the build process, we will use Cloud Build which is a serverless fully managed CI/CD system provided by Google Cloud Platform (GCP). Other alternatives include CircleCI, Jenkins, etc. We will also have the GitHub Action workflow monitor certain changes in the codebase so that it can initiate the above workflow automatically.Figure 1: CI/CD for the whole pipelineTFX pipeline consists of an array of components from ExampleGen to Pusher, and each component is run based on the same docker image. The first workflow shows how to build such docker images whenever the codebase changes. This is demonstrated in the main branch of this repository.In the second workflow, we will shift gears slightly and incorporate the following changes:Separate the data preprocessing and modeling codes for TFX Transform and Trainer components respectively from the TFX pipeline project to an individual directory, modules. These modules will be stored in a GCS bucket as in the Cloud Build process. Modify the pipeline source code so that TFX Transform and Trainer components can refer to the modules in the GCS bucket. In this way, we don’t need to build a new docker image based on changes in the two modules. Set up another GitHub Action workflow to be triggered by detecting any changes in the modules directory.When the GitHub Action gets fired, it will initiate the other Cloud Build process.The initiated Cloud Build process clones the entire repository, copies the only files in the modules directory to the GCS bucket, and submits the TFX pipeline to Vertex AI.Figure 2: CI/CD for the data preprocessing and modeling modulesThe second workflow is demonstrated in the experiment-decoupling branch of this repository.Implementation detailsTFX based MLOps project consists of a number of components from ExampleGen for taking care of the input dataset to Pusher for storing or serving trained models for the production. It is non-trivial to understand how these components are interconnected and to see which configurations are available for each component.In this section, we will show you how to use the TFX CLI tool that lets you start from a complete TFX based MLOps project template instead of building one from scratch by yourself. Initial TFX project with TFX CLIThere are two template projects, taxi and penguin at the moment. We will use the taxi template for this post. The following TFX CLI shows how to generate a new TFX project based on the taxi template. You can specify which template to use in –model, the name of pipeline in –pipeline-name, and the path where to store the generated project in –destination-path.After the CLI creates a template for us we can investigate its directory structure(Some minor files like caching, testing, __init__.py are omitted to save some space, but the most important files for understanding TFX pipeline are listed): Giving full descriptions for each file and directory is out of scope of this post, but let’s quickly discuss the most important ones for the purpose of this post. kubeflow_v2_runner.py explicitly says that we want to run the pipeline on Kubeflow 2.x environment, and it has to be used to leverage Vertex AI as a backend orchestrator. The models directory provides a set of predefined modules for data preprocessing, modeling, and there are testing templates for each module as well. The pipeline.py defines how the TFX pipeline is constructed, and the configs.py is there for configuring all the parameters passed down to the TFX component.  If you want more details about the TFX CLI and what’s included in the template project, please refer to the official document of TFX CLI and the codelabs that we are working on.Compile and build TFX projectThere are two ways to run a TFX pipeline. The first option is to use the Python API directly from the source code. The method will be covered in the second blog post. In this blog post, we will explore the second option, using TFX CLI. The tfx pipeline create command creates a new pipeline in the given orchestrator, and the underlying orchestrator can be selected via –engine. It is set to vertex since we want to run the pipeline in the Vertex AI platform, but you can choose other options such as kubeflow, local, airflow, and beam.There are two more important flags, –pipeline-path and –build-image. The value for the first flag should be set to kubeflow_v2_runner.py provided by the template if your orchestrator is vertex or Kubeflow 2.x. If you plan to run the pipeline on Kubeflow 1.x or local environment, there are kubeflow_runner.py and local_runner.py as well. The –build-image is an optional flag, and it has to be set when you want to build/update the custom TFX docker image. The image name can be modified via PIPELINE_IMAGE variable in pipeline/configs.py which manages all the configurations across the pipeline.After the tfx pipeline create command, you can run the pipeline on Vertex AI platform with the other CLI command tfx run create. The value for the –pipeline_name should match to the pipeline name used in tfx template copy. You can change the name afterward via the PIPELINE_NAME variable in pipeline/configs.py, but you have to re-run the tfx pipeline create command in this case.The base of the Vertex AI Platform is Kubeflow 2.x, but one of the main differences is that it is hosted in GCP as a serverless platform. That means we don’t have to manage the underlying GKE and Kubeflow infrastructure anymore. It is managed by Google entirely. Before Vertex AI, we needed to create and manage GKE clusters and install the Kubeflow platform on top of it ourselves. The –project and –region flags clearly show how these changes are reflected. Without Vertex AI we had to set –endpoint where the Kubeflow is running, but we only let the TFX know where to run the pipeline without caring how.Figure 3: Complete TFX pipeline hosted on Vertex AIAfter the tfx run create command, if you visit the Vertex AI pipeline in the GCP console, you will see something similar to Figure 3. You can see that the template project provides a nice starting point with all the standard TFX components interconnected to deliver the MLOps pipeline without writing any code. Setup GitHub Action and Cloud Build for the first workflowThe below YAML file defines a GitHub Action triggered by push event on the main branch:The dorny/paths-filter GitHub Action lets us detect if there were any changes on a given path for the push. In this example, that path is specified as tfx-pipeline which means any changes of the code base defining the pipeline should set steps.tfx-pipeline-change.outputs.src to true.If the steps.tfx-pipeline-change.outputs.src is true, the next step for submitting the Cloud Build can proceed. The Cloud Build specification is defined as below, and the environmental values beginning with $ symbol are injected via –substitutions. It is somewhat hard to read at first, but if you read the Cloud Build spec carefully, you will notice that there are four steps, which are to clone the repository, run the unit tests based on the three *_test.py files under the models directory, run the tfx pipeline create command, and run the tfx run create command in sequential manner. The last two steps were described in the earlier section, Compile and build TFX project.You might wonder why the docker image, ‘gcr.io/gcp-ml-172005/cb-tfx’ is used instead of the standard python image with the name: python instruction. The reason is the version of the Python provided by the standard python image is 3.9, and the latest TFX version only supports Python 3.8. Below is the Dockerfile to build cb-tfx docker file to enable the version of TFX above 1.0, kfp, and pytest which are required to run TFX CLI and unit tests.If you make any changes under the tfx-pipeline directory, you will see the Cloud Build process gets launched, and you can see the status from the Cloud Build dashboard in GCP console as in Figure 4.Figure 4: Cloud Build process displayed on GCP consoleWe have built a whole CI/CD pipeline for MLOps projects with TFX. However, we can make an additional improvement. Since building a docker image every time could let the system spend more time and cost, avoiding this step is ideal whenever possible. Let’s see what we can do about this in the next section.Decouple modules from the existing TFX projectIn order to run the two standard TFX components, Transform and Trainer, we have to provide codes in separate files containing how to pre-process raw data and how to build and run the model. There are two options to do this. The first option is to use run_fn and preprocessing_fn parameters for Trainer and Transform respectively, and the second option is to use module_file parameters for both components. The first option can be used when the files are included in the docker image, and we specify which function to trigger the action. For example, in the generated template project, run_fn is set as run_fn=models.run_fn. The second option also can be used when the files are included in the docker image as well, but the file should have a designated function name, run_fn and preprocessing_fn, and it will be recognized by the component. However, one of the most important differences is that the files can be injected from the GCS bucket directly. In this case, we don’t have to include the files in the docker image but simply specify the GCS path to the modeul_file parameter.In order to do that, we change the PREPROCESSING_FN and RUN_FN variables in configs.py like above. As you see we specify the GCS path where the files reside instead of the function name in the module. Also, we have to include every function and variable in a single file since the GCS bucket is just a storage system that doesn’t know anything about the Python filesystem. Then we store the two files in separate directory modules. One drawback of this way is that we have to pack everything inside a single file. For example, you can not have separate files for defining a model, training steps, signatures for serving, and so on. This harms some code management and readability, but you can avoid building a new docker image whenever these files are changed. So there is a trade-off.Setup GitHub Action and Cloud Build for the second workflowThe original GitHub Action script should be modified to adapt this change like below. As you see, one more filter is defined on modules directory, and one more step to trigger the Cloud Build process when steps.change.outputs.modules is true is defined. The original workflow to build a new docker image and launch the pipeline on Vertex AI When the pipeline itself gets modified is still handled. We added one more workflow that triggers the different Cloud Build process defined in separate file partial-pipeline-deployment.yamlif any changes are detected under the modules directory.Below shows how partial-pipeline-deployment.yaml is defined:We added one additional step in between Clone Repository andCreate Pipeline steps to copy files in modules directory to the designated GCS bucket. Also, as you might have noticed, the –build-image option flag in the tfx pipeline create command is removed since we don’t have to build a new docker image anymore.CostVertex AI Training is a separate service from Pipeline. We need to pay for the Vertex AI Pipeline individually, and it costs about $0.03 per pipeline run. The type of compute instance for each TFX component was e2-standard-4, and it costs about $0.134 per hour. Since the whole pipeline took less than an hour to be finished, we can estimate that the total cost was about $0.164 for a Vertex AI Pipeline run.The cost of custom model training depends on the type of machine and the number of hours. Also, you have to consider that you pay for the server and the accelerator separately. For this project, we chose n1-standard-4machine type whose price is $0.19 per hour and NVIDIA_TESLA_K80 accelerator type whose price is $0.45 per hour. The training for each model was done in less than an hour, so it cost about $1.28 in total.The cost of Cloud Build also depends on the type of machine and the number of hours to run. We have used the n1-highcpu-8 instance, and the job was done in an hour. In that case, the total cost for a Cloud Build run is about $0.016 per hour.If we sum them up, the total cost for this project is approximately $1.46. Please refer to the official documents on the price: Vertex AI price reference, Cloud Build price reference.ConclusionSo far we have demonstrated three workflows. As the first step, we have shown how to use TFX CLI to create a complete TFX MLOps project, build a new docker image, and launch the pipeline on Vertex AI platform. In the second step, we have covered how to integrate GitHub Action and Cloud Build to build CI/CD systems to adapt to any changes in the codebase. Lastly, we have demonstrated how to decouple data preprocessing and modeling modules from the pipeline to avoid building a new docker image whenever possible. This is good. But What if we wanted to maintain a schedule (which is usually dependent on the use-case) to trigger the pipeline runs on Vertex AI? What if we wanted a system such that during the experimentation phase whenever a new architecture is published as a Pub/Sub topic the same pipeline needs to be executed (but with different hyperparameters)? Note that this is different from committing your code changes to GitHub and then triggering the execution from there. A developer might want to first experiment and commit the changes (model architecture, hyperparameters, etc.) that yielded the best results. In the second part of this blog post, we will tackle these scenarios and discuss relevant solutions.   AcknowledgementsWe are grateful to the ML-GDE program that provided GCP credits for supporting our experiments. We sincerely thank Karl Weinmeister of Google for his help with the review.Related ArticleNew to ML: Learning path on Vertex AIIf you’re new to ML, or new to Vertex AI, this post will walk through a few example ML scenarios to help you understand when to use which…Read Article
Quelle: Google Cloud Platform