Cloud Bigtable launches Autoscaling plus new features for optimizing costs and improved manageability

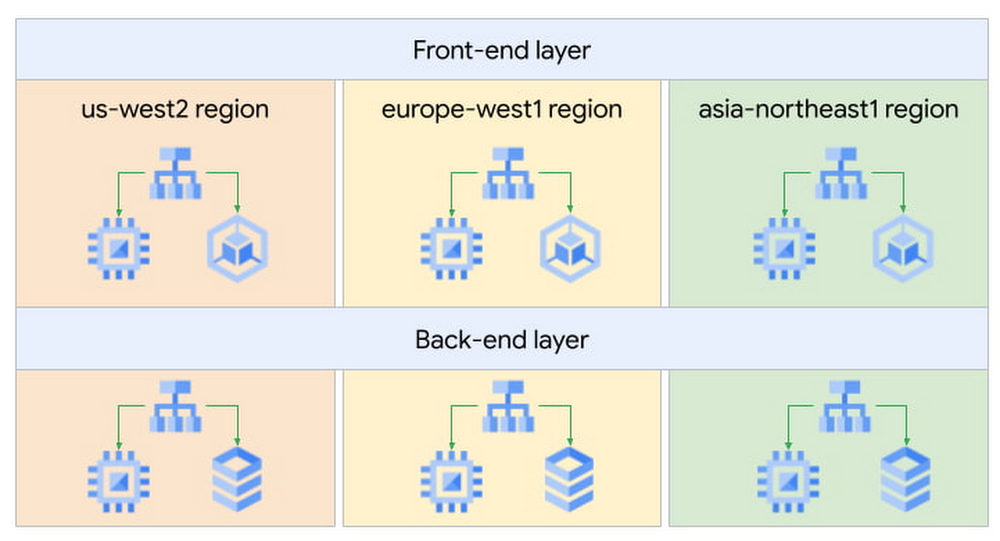
Cloud Bigtable is a fully managed, scalable NoSQL database service for large operational and analytical workloads used by leading businesses across industries, such as The Home Depot, Equifax, and Twitter. Bigtable has more than 10 Exabytes of data under management and processes more than 5 billion requests per second at peak. Today, we’re announcing the general availability of autoscaling for Bigtable that automatically adds or removes capacity in response to the changing demand for your applications. With autoscaling, you only pay for what you need and you can spend more time on your business instead of managing infrastructure. In addition to autoscaling, we recently launched new capabilities for Bigtable that reduce cost and management overhead:2X storage limit that lets you store more data for less, particularly valuable for storage optimized workloads.Cluster groups provide flexibility for determining how you route your application traffic to ensure a great experience for your customers. More granular utilization metrics improve observability, faster troubleshooting and workload management. Let’s discuss these capabilities in more detail. Optimize costs and improve manageability with autoscalingThe speed of digitization has increased in most aspects of life driving up consumption of digital experiences. The ability to scale up and scale down applications to quickly respond to shifts in customer demand is now more critical for businesses  than ever before.  Autoscaling for Bigtable automatically scales the number of nodes in a cluster up or down according to the changing demands of usage. It significantly lowers your risk of over-provisioning and incurring unnecessary costs, and under-provisioning which can lead to missed business opportunities. Bigtable now natively supports autoscaling with direct access to the Bigtable servers to provide a highly responsive autoscaling solution.Customers are able to set up an autoscaling configuration for their Bigtable clusters using the Cloud Console, gcloud, the Bigtable admin API, or our client libraries. It works on both HDD and SSD clusters, and is available in all Bigtable regions. You can set the minimum and maximum number of nodes for your Bigtable autoscaling configuration in Cloud Console as shown below.Once you have set up autoscaling, it is helpful to  understand what autoscaling is doing, when and why to reconcile against billing and performance expectations. We have invested significantly in comprehensive monitoring and audit logging to provide developers with granular metrics and pre-built charts that explain how autoscaling makes decisions.Related ArticleBigtable Autoscaling: Deep dive and cost saving analysisBigtable now supports autoscaling. In this post we’ll look at when and how to use it, analyze autoscaling in action, and see its impact o…Read Article2X the storage limit Data is being generated at a tremendous pace and numerous applications need access to that data to deliver superior customer experiences.Many data pipelines supporting these applications require high throughput, and low latency access to vast amounts of data while maintaining the cost of compute resources. In order to meet the needs of storage driven workloads, Bigtable has doubled the storage capacity per node so that you can store more data for less, and don’t have to compromise on your data needs. Bigtable nodes now support 5TB per node (up from 2.5TB) for SSD and 16TB per node (up from 8TB) for HDD. This is especially cost-effective for batch workloads that operate on large amounts of data. Manageability at scale with cluster groupsBusinesses today need to serve users across regions and continents and ensure they provide the best experience to every user no matter the location. We recently launched the capability to deploy a Bigtable instance in up to 8 regions so that you can place the data as close to the end user as possible. A greater number of regions helps ensure your applications are performant for a consistent customer experience, where your customers are located. Previously, an instance was limited to four regions.With a global presence, there are typically multiple applications that require access to the replicated data. Each application needs to ensure that its serving path traffic does not see increased latency or reduced throughput because of a potential ‘noisy neighbor’ when additional workloads need access to the data. To provide improved workload management, we recently launched App Profile Cluster Group routing. Cluster group routing provides finer grained workload isolation management, allowing you to configure where to route your application traffic. This will allow you to allocate Bigtable clusters to handle certain traffic like batch workloads while not directly impacting the clusters being used to serve your customers.Greater observabilityHaving detailed insight and understanding of how your Bigtable resources are being utilized to support your business is crucial for troubleshooting and optimizing resource allocation. The recently launched CPU utilization by app profile metric includes method and table dimensions. These additional dimensions provide more granular observability into the Bigtable cluster’s CPU usage and how your Bigtable instance resources are being used. These observability metrics tell you what applications are accessing what tables with what API method, making it much easier to quickly troubleshoot and resolve issues.Learn moreTo get started with Bigtable, create an instanceor try it out with a Bigtable Qwiklab.Check out Youtube videos for step by step introduction to how Bigtable can be used in real world applications like Personalisation and Fraud detection.Learn how you can migrate data from HBase to Bigtable
Quelle: Google Cloud Platform

Expanding support for early-stage startups on Google Cloud

Startups are uniquely adept at solving difficult challenges, and Google is committed to partnering with these organizations and delivering technology to help them do so as they start, build, and grow. Over the past year, we’ve deepened our focus on helping startups scale and thrive in the cloud, including launching new resources and mentorship programs, hosting our first-ever Google Cloud Startup Summit, growing our team of startup experts, and more.With the new year in full swing, I’m excited to roll out several new offerings and updates designed to support startups even more effectively.First, we will align Google Cloud’s startup program with Google for Startups to ensure startup customers enjoy a consistent experience across all of Google—including Google Cloud infrastructure and services—and to provide founders access to Google mentors, products, programs, and best practices. Going forward, our program will be the Google for Startups Cloud Program.Next, we’ll deepen our commitment to supporting founders that are just starting out, when access to the right technology and expertise can have a massive impact on their company’s growth trajectory. Early-stage startups are particularly well-positioned to move quickly and solve problems, but they need the ability to scale with minimal costs, to pivot to address a new opportunity, and to leverage expertise and resources as they navigate new markets and investors.  Supporting early-stage startups is a key goal of the Google for Startups Cloud Program, and today I’m thrilled to announce a new offer for funded startups that will make it easier for these companies to get access to the technology and resources they need. Providing new Google Cloud credits for early-stage startupsStarting now, the Google for Startups Cloud Program will cover the first year of Google Cloud usage for investor-backed startups, through series A rounds, up to $100,000. For most startups, this will mean they can begin building on Google Cloud at no cost, ensuring they can focus on innovation, growth, and customer acquisition. In their second year of the program, startups will have 20% of their Google Cloud usage costs covered, up to an additional $100,000 in credits.This new offering will make it simpler for startups to access to Google Cloud’s capabilities in AI, ML, and analytics, and to rapidly build and scale on Google Cloud infrastructure with services like Firebase and Google Kubernetes Engine (GKE).Learn more about this new offer and eligibility requirements here.Connecting startup customers to Google know-how and supportWe know that navigating decisions as a fast-scaling startup can be challenging. Last year, we introduced our global Startup Success Team as a dedicated Google Cloud point of contact for startups in our program as they build. Now that this team is fully up and running, we’re expanding it to all qualified, early-stage startups in the Google for Startups Cloud Program. These guides will get to know the unique needs of each startup throughout their two years in the program, and will help connect them with the right Google teams to help resolve any technical, go-to-market, or credit questions along the way. As a customer grows in their usage and expertise with Google Cloud, they’ll be connected to our startup expert account teams to continue their journey.   The Google for Startups Cloud Program joins Google’s numerous offerings for entrepreneurs. In addition to receiving mentorship, tailored resources, and technical support from Google subject matter experts, participating startups are eligible for additional Google product benefits to help their business including Google Workspace, Google Maps and more. Founders can take advantage of workshops, events, and technical training courses, as well as Google for Startups programsand partner offerings. They can also tap into a supportive network of peers through our new C2C Connect digital community just for founders and CTOs building on Google Cloud. Helping startups focus on innovation, not infrastructureOur goal is to help startups move fast now, without creating technical debt that will slow them down later. With our fully managed, serverless offerings like Cloud Run, Firestore, Firebaseand BigQuery, startups can spend their time on their roadmap, rather than infrastructure management. And as they go from MVP to product to scale, startups don’t need to overhaul their architecture—Google Cloud services scale with them.That’s how Nylas, a startup focused on business productivity, is able to rapidly scale its platform and support larger, enterprise customers, all while growing its revenue by 5X. FLYR Labs is helping airlines better manage revenue and forecast demand, with a platform powered by Google Cloud data and AI capabilities and running on GKE.Sniip is rapidly growing adoption of its app that helps people more easily track and pay bills, leveraging GKE to scale quickly and Cloud Run to empower their developers.With Google Cloud, startups benefit from a business and technology partnership to help them build and go to market. We’ll work with founders from the early prototypes to global scale as they expand to new markets. Startups around the world are choosing to build with Google Cloud. Join us and let’s get solving.Related ArticleRead Article
Quelle: Google Cloud Platform

Sprinklr and Google Cloud join forces to help enterprises reimagine their customer experience management strategies

Enterprises are increasingly seeking out technologies that help them create unique experiences for customers with speed and at scale. At the same time, customers want flexibility when deciding where to manage their enterprise data, particularly when it comes to business-critical applications.That’s why I’m thrilled that Sprinklr, the unified customer experience management (Unified-CXM) platform for modern enterprises, has partnered with Google Cloud to accelerate its go-to-market strategy and grow awareness among our joint customers. Sprinklr will work closely with our global salesforce, benefitting from our deep relationships with enterprises that have chosen to build on Google Cloud. Akin to Google Cloud’s mission to accelerate every organization’s ability to digitally transform their business through data-powered innovation, Sprinklr’s primary objective is to empower the world’s largest and most loved brands to make their customers happier by listening, learning, and taking action through insights. With this strategic partnership now in place, Sprinklr and Google Cloud will go-to-market together with the end-customer as our sole focus.Traditionally, brands have adopted point solutions to manage segments of the customer journey. In isolation, these may work — but they rarely work collaboratively, even when vendors build “Frankenstacks” of disconnected products. These solutions can’t deliver a 360° view of the customer, and often reinforce departmental silos. All of which creates point-solution chaos.Sprinklr’s approach is fundamentally different and is the way out of the aforementioned point-solution chaos. As the first platform purpose-built for unified customer experience management (Unified-CXM) and trusted by the enterprise, Sprinklr’s industry-leading AI and powerful Care, Marketing, Research, and Engagement solutions enable the world’s top brands to learn about their customers, understand the marketplace, and reach, engage, and serve customers on all channels to drive business growth. Sprinklr was built from the ground up as a platform-first solution, designed to evolve and grow with the rapid expansion of digital channels and applications. The results? Faster innovation. Stronger performance. And a future-proof strategy for customer engagement on an enterprise scale.”Sprinklr works with large, global companies that want flexibility when deciding where to manage their enterprise data and consider our platform a business-critical application,” said Doug Balut, Senior Vice President of Global Alliances, Sprinklr. “Giving our customers the opportunity to manage Sprinklr on Google Cloud empowers them to create engaging customer experiences while maintaining the high security, scalability, and performance they need to run their business.”To learn more about this exciting partnership and the challenges we jointly solve for customers, check out the recent conversation between Google Cloud’s VP of Marketing, Sarah Kennedy, and Sprinklr’s Chief Experience Officer, Grad Conn. Or read the press release on the partnership.
Quelle: Google Cloud Platform

How to publish applications to our users globally with Cloud DNS Routing policies?

When building applications that are critical to your business, one key consideration is always high availability. In Google Cloud, we recommend building your strategic applications on a multi-regional architecture. In this article, we will see how Cloud DNS routing policies can help simplify your multi-regional design.As an example, let’s take a web application that is internal to our company, such as a knowledge-sharing wiki application. It uses a classic 2-tier architecture: front-end servers tasked to serve web requests from our engineers and back-end servers containing the data for our application. This application is used by our engineers based in the US (San Francisco), Europe (Paris) and Asia (Tokyo), so we decided to deploy our servers in three Google Cloud regions for better latency, performance and lower cost.High level designIn each region, the wiki application is exposed via an Internal Load Balancer (ILB), which engineers connect to over an Interconnect or Cloud VPN connection. Now our challenge is determining how to send users to the closest available front-end server. Of course, we could use regional hostnames such as <region>.wiki.example.com where <region> is US, EU, or ASIA – but this puts the onus on the engineers to choose the correct region, exposing unnecessary complexity to our users. Additionally, it means that if the wiki application goes down in a region, the user has to manually change the hostname to another region – not very user-friendly!So how could we design this better? Using Cloud DNS Policy Manager, we could use a single global hostname such as wiki.example.com and use a geo-location policy to resolve this hostname to the endpoint closest to the end user. The geo-location policy will use the GCP region where the Interconnect or VPN lands as the source for the traffic and look for the closest available endpoint.For example, we would resolve the hostname for US users to the IP address of the US Internal Load Balancer in the below diagram:DNS resolution based on the location of the userThis allows us to have a simple configuration on the client side and to ensure a great user experience.The Cloud DNS routing policy configuration would look like this:See the official documentation page for more information on how to configure Cloud DNS routing policies.This configuration also helps us improve the reliability of our wiki application: if we were to lose the application in one region due to an incident, we can update the geo-location policy and remove the affected region from the configuration. This would mean that new users will resolve the next closest region to them, and it would not require an action on the client’s side or the application team’s side.We have seen how this geo-location feature is great for sending users to the closest resource, but it can also be useful for machine-to-machine traffic. Expanding on our web application example, we would like to ensure that front-end servers all have the same configuration globally and use the back-end servers in the same region. We would configure front-end servers to connect to the global hostname backend.wiki.example.com. The Cloud DNS geo-location policy will use the front-end servers’ GCP region information to resolve this hostname to the closest available backend tier Internal Load Balancer.Front-end to back-end communication (instance to instance)Putting it all together, we now have a multi-regional and multi-tiered application with DNS policies to smartly route users to the closest instance of that application for optimal performance and costs. In the next few months, we will introduce even smarter capabilities to Cloud DNS routing policies, such as health checks to allow automatic failovers. We look forward to sharing all these exciting new features with you in another blog post.Related ArticleSimplify traffic steering with Cloud DNS routing policiesCloud DNS routing policies (geo-location and weighted round robin) helps you define custom ways to steer private and Internet traffic usi…Read Article
Quelle: Google Cloud Platform

Developing and securing a platform for healthcare innovation with Google Cloud

In an industry as highly regulated as healthcare, building a single secure and compliant application that tracks patient care and appointments at a clinic requires a great deal of planning from development and security teams. So, imagine what it would be like to build a solution that includes almost everything related to a patient’s healthcare, including insurance and billing. That’s what Highmark Health (Highmark)—a U.S. health and wellness organization that provides millions of customers with health insurance plans, a physician and hospital network, and a diverse portfolio of businesses–decided to do. Highmark is developing a solution called Living Health to re-imagine healthcare delivery, and it is using Google Cloud and the Google Cloud Professional Services Organization (PSO) to build and maintain the innovation platform supporting this forward thinking experience. Considering all the personal information that different parties like insurers, specialists, billers and coders, clinics, and hospitals share, Highmark must build security and compliance into every part of the solution. In this blog, we look at how Highmark Health and Google are using a technique called “secure-by-design” to address the security, privacy, and compliance aspects of bringing Living Health to life.Secure-by-design: Preventive care for developmentIn healthcare, preventing an illness or condition is the ideal outcome. Preventive care often involves early intervention—a course of ideas and actions to ward off illness, permanent injury, and so on. Interestingly, when developing a groundbreaking delivery model like Living Health, it’s a good idea to take the same approach to security, privacy, and compliance. That’s why Highmark’s security and technology teams worked with their Google Cloud PSO team to implement secure-by-design for every step of design, development, and operations. Security is built into the entire development process rather than waiting until after implementation to reactively secure the platform or remediate security gaps. It’s analogous to choosing the right brakes for a car before it rolls off the assembly line instead of having an inspector shut down production because the car failed its safety tests. The key aspect of secure-by-design is an underlying application architecture created from foundational building blocks that sit on top of a secure cloud infrastructure. Secure-by-design works to ensure that these building blocks are secure and compliant before moving on to development.The entire approach requires security, development, and cloud teams to work together with other stakeholders. Most importantly, it requires a cloud partner, cloud services, and a cloud infrastructure that can support it. Finding the right cloud and services for secure-by-design Highmark chose Google Cloud because of its leadership in analytics, infrastructure services, and platform as a service. In addition, Google Cloud has made strategic investments in healthcare interoperability and innovation, which was another key reason Highmark decided to work with Google. As a result, Highmark felt that Google Cloud and the Google Cloud PSO were best suited for delivering on the vision of Living Health—its security and its outcomes. “Google takes security more seriously than the other providers we considered, which is very important to an organization like us. Cloud applications and infrastructure for healthcare must be secure and compliant,” explains Highmark Vice President and Chief Information Security Officer, Omar Khawaja. Forming a foundation for security and complianceHow does security-by-design with services work? It starts with the creation and securing of the foundational platform, allowing teams to harden and enforce specified security controls. It’s a collaborative process that starts with input from cross-functional teams—not just technology teams—using terms they understand, so that everyone has a stake in the design. A strong data governance and protection program classifies and segments workloads based on risk and sensitivity. Teams build multiple layers of defense into the foundational layers to mitigate against key industry risks. Google managed services such as VPC Service Controls help prevent unauthorized access. Automated controls such as those in Data Loss Prevention help teams quickly classify data and identify and respond to potential sources of data risk. Automation capabilities help ensure that security policies are enforced.After the foundational work is done, it’s time to assess and apply security controls to the different building blocks, which are Google Cloud services such as Google Kubernetes Engine, Google Compute Engine, and Google Cloud Storage. The goal is to make sure that these and similar building blocks, or any combination of them, do not introduce additional risks and to ensure any identified risks are remediated or mitigated. Enabling use cases, step by stepAfter the foundational security is established, the security-by-design program enables the Google Cloud services that developers then use to build use cases that form Living Health. The service enablement approach allows Highmark to address complexity by providing the controls most relevant for each individual service. For each service, the teams begin by determining the risks and the controls that can reduce them. The next step is enforcing preventive and detective controls across various tools. After validation, technical teams can be granted an authorization to operate, also called an ATO. An ATO authorizes the service for development in a use case.For use cases with greater data sensitivity, the Highmark teams validate the recommended security controls with an external trust assessor, who uses the HITRUST Common Security Framework, which maps to certifications and compliance such as HIPAA, NIST, GDPR, and more. A certification process follows that can take anywhere from a few weeks to a few months. In addition to certification, there is ongoing monitoring of the environment for events, behavior, control effectiveness, and control lapses or any deviation from the controls.The approach simplifies compliance for developers by abstracting compliance requirements away. The process provides developers a set of security requirements written in the language of the cloud, rather than in the language of compliance, providing more prescriptive guidance as they build solutions. Through the secure-by-design program, the Highmark technology and security teams, Google, the business, and the third-party trust assessor all contribute to a secure foundation for any architectural design with enabled Google Cloud services as building blocks. Beating the learning curve Thanks to the Living Health project, the Highmark technology and security teams are trying new methods. They are exploring new tools for building secure applications in the cloud. They are paying close attention to processes and the use case steps and, when necessary, aligning different teams to execute. Because everyone is working together collaboratively toward a shared goal, teams are delivering more things on time and with predictability, which has reduced volatility and surprises. The secrets to success: Bringing everyone to the table early and with humilityTogether, Highmark and Google Cloud PSO have created over 24 secure-by-design building blocks by bringing everyone to the table early and relying on thoughtful, honest communication. Input for the architecture design produced for Highmark came from privacy teams, legal teams, security teams, and the teams that are building the applications. And that degree of collaboration ultimately leads to a much better product because everyone has a shared sense of responsibility and ownership of what was built. Delivering a highly complex solution like Living Health takes significant, more purposeful communication and execution. It is also important to be honest and humble. The security, technology, and Google teams have learned to admit when something isn’t working and to ask for help or ideas for a solution. The teams are also able to accept that they don’t have all the answers, and that they need to figure out solutions by experimenting. Khawaja puts it simply, “That level of humility has been really important and enabled us to have the successes that we’ve had. And hopefully that’ll be something that we continue to retain in our DNA.”
Quelle: Google Cloud Platform

Bio-pharma organizations can now leverage the groundbreaking protein folding system, AlphaFold, with Vertex AI

At Google Cloud, we believe the products we bring to market should be strongly informed by our research efforts across Alphabet. For example, Vertex AI was ideated, incubated and developed based on the pioneering research from Google’s research entities. Features like Vertex AI Forecast, Explainable AI, Vertex AI Neural Architecture Search (NAS) and Vertex AI Matching Engine were born out of discoveries by Google’s researchers, internally tested and deployed, and shared with data scientists across the globe as an enterprise-ready solution, each within a matter of a few short years. Today, we’re proud to announce another deep integration between Google Cloud and Alphabet’s AI research organizations: the ability in Vertex AI to run DeepMind’s groundbreaking protein structure prediction system, AlphaFold. We expect this capability to be a boon for data scientists and organizations of all types in the bio-pharma space, from those developing treatments for diseases to those creating new synthetic biomaterials. We’re thrilled to see Alphabet AI research continue to shape products and contribute to platforms on which Google Cloud customers can build. This guide provides a way to easily predict the structure of a protein (or multiple proteins) using a simplified version of AlphaFold running in a Vertex AI. For most targets, this method obtains predictions that are near-identical in accuracy compared to the full version. To learn more about how to correctly interpret these predictions, take a look at the “Using the AlphaFold predictions” section of this blog post below. Please refer to the Supplementary Information for a detailed description of the method.Solution OverviewVertex AI lets you develop the entire data science/machine learning workflow in a single development environment, helping you deploy models faster, with fewer lines of code and fewer distractions.For running AlphaFold, we choose Vertex AI Workbench user-managed notebooks, which uses Jupyter notebooks and offers both various preinstalled suites of deep learning packages and full control over the environment. We also use Google Cloud Storage and Google Cloud Artifact Registry, as shown in the architecture diagram below.Figure 1. Solution OverviewWe provide a customized Docker image in Artifact Registry, with preinstalled packages for launching a notebook instance in Vertex AI Workbench and prerequisites for running AlphaFold. For users who want to further customize the docker image for the notebook instance, we also provide the Dockerfile and a build script you can build upon. You can find the notebook, the Dockerfile and the build script in the Vertex AI community content.Getting StartedVertex AI Workbench offers an end-to-end notebook-based production environment that can be preconfigured with the runtime dependencies necessary to run AlphaFold. With user-managed notebooks, you can configure a GPU accelerator to run AlphaFold using JAX, without having to install and manage drivers or JupyterLab instances. The following is a step-by-step walkthrough for launching a demonstration notebook that can predict the structure of a protein using a slightly simplified version of AlphaFold that does not use homologous protein structures or the full-sized BFD sequence database.1. If you are new to Google Cloud, we suggest familiarizing yourself with the materials on the Getting Started page, and creating a first project to host the VM Instance that will manage the tutorial notebook. Once you have created a project, proceed to step 2 below.2. Navigate to the tutorial notebook, hosted in the vertex-ai-samples repository on GitHub.3. Launch the notebook on Vertex Workbench via the “Launch this Notebook in Vertex AI Workbench” link. This will redirect to the Google Cloud Platform Console and open Vertex AI Workbench using the last project that you used.4. If needed, select your project using the blue header at the top of the screen, on the left.If you have multiple Google Cloud user accounts, make sure you select the appropriate account using the icon on the right.First-time users will be prompted to take a tutorial titled “Deploy a notebook on AI Platform,” with the start button appearing on the bottom-right corner of the screen.This tutorial is necessary for first-time users; it will help orient you to the Workbench, as well as configure billing and enable the Notebooks API (both required).A full billing account is required for GPU acceleration, and is strongly recommended. Learn more here.5. Enter a name for the notebook but don’t click “Create” just yet; you still need to configure some “Advanced Options.” If you have used Vertex AI Workbench before, you may first need to select “Create a new notebook.”6. GPU acceleration is strongly recommended for this tutorial. When using GPU acceleration, you should ensure that you have sufficient accelerator quota for your project. Total GPU quota: “GPUs (all regions)”Quota for your specific GPU type: “NVIDIA V100 GPUs per region”Enter the Quota into the “filter” box and ensure Limit > 0. If needed, you can spin up small quota increases in only a few minutes by selecting the checkbox, and the “Edit Quotas.”7. Next, select “Advanced Options,” on the left, which will give you the remaining menus to configure:Under Environment, configure “Custom container” (first in the drop-down menu) In the “Docker container image” text box, enter (without clicking “select”): us-west1-docker.pkg.dev/cloud-devrel-public-resources/alphafold/alphafold-on-gcp:latestSuggested VM configuration:Machine type: n1-standard-8 (8 CPUs, 30 GB RAM)GPU type: NVIDIA Tesla V100 GPU accelerator (recommended).Longer proteins may require a powerful GPU; check your quota configuration for your specific configuration, and request a quota increase if necessary (as in Step 6).If you don’t see the GPU that you want, you might need to change your Region / Zone settings from Step 5. Learn more here.Number of GPUs: 1Make sure the check box “Install NVIDIA GPU driver automatically for me” is checked.The defaults work for the rest of the menu items. Press Create!8. After several minutes, a virtual machine will be created and you will be redirected to a JupyterLab instance. When launching, you may need to confirm the connection to the Jupyter server running on the VM; click Confirm:9. If a message about “Build Recommended” appears, click “Cancel.”10. The notebook is ready to run! From the menu, select Run > Run all Cells to evaluate the notebook top-to-bottom, or run each cell by individually highlighting and clicking <shift>-return. The notebook has detailed instructions for every step, such as where to add the sequence(s) of a protein you want to fold.11. Congratulations, you’ve just folded a protein using AlphaFold on the Vertex AI Workbench!12. When you are done with the tutorial, you should stop the host VM instance in the “Vertex AI” > ”Workbench” menu to avoid any unnecessary billing. Using the AlphaFold predictionsThe protein structure that you just predicted has automatically been saved as ‘selected_prediction.pdb’ to the ‘prediction’ folder of your instance. To download it, use the File Browser on the left side to navigate to the ‘prediction’ folder, then right click on the ‘selected_prediction.pdb’ file and select ‘Download’. You can then use this file in your own viewers and pipelines.You can also explore your prediction directly in the notebook by looking at it in the 3D viewer. While many predictions are highly accurate, it should be noted that a small proportion will likely be of lower accuracy. To help you interpret the prediction, take a look at the model confidence (the color of the 3D structure) as well as the Predicted LDDT and Predicted Aligned Error figures in the notebook. You can find out more about these metrics and how to interpret AlphaFold structures on this page and in this FAQ.If you use AlphaFold (e.g. in publications, services or products), please cite the AlphaFold paper and, if applicable, the AlphaFold-Multimer paper. Looking toward innovation in biology and medicineIn this guide, we covered how to get started with AlphaFold using Vertex AI, enabling a secure, scalable, and configurable environment for research in the Cloud. If you would like to learn more about AlphaFold, the scientific paper and source code are both openly accessible. We hope that insights you and others in the scientific community make will unlock many exciting future advances in our understanding of biology and medicine.Related ArticleVertex AI NAS: higher accuracy and lower latency for complex ML modelsHow Google Cloud’s Vertex AI Neural Architecture Search (NAS) accelerates time-to-value for sophisticated ML workloads.Read Article
Quelle: Google Cloud Platform

Understanding Firestore performance with Key Visualizer

Firestore is a serverless, scalable, NoSQL document database. It is ideal for rapid and flexible web and mobile application development, and uniquely supports real-time client device syncing to the database.To get the best performance out of Firestore, while also making the most out of Firestore’s automatic scaling and load balancing features, you need to make sure the data layout of your application allows requests to be processed optimally, particularly as your user traffic increases. There are some subtleties to be aware of when it comes to what could happen when traffic ramps up, and to help make this easier to identify, we’re announcing the General Availability of Key Visualizer, an interactive, performance monitoring tool for Firestore.Key Visualizer generates visual reports based on Firestore documents accessed over time, that will help you understand and optimize the access patterns of your database, as well as troubleshoot performance issues. With Key Visualizer, you can iteratively design a data model or improve your existing application’s data usage pattern.Tip: While Key Visualizer can be used with production databases, it’s best to identify performance issues prior to rolling out changes in production. Consider running application load tests with Firestore in a pre-production environment, and using Key Visualizer to identify potential issues.Viewing a visualizationThe Key Visualizer tool is available to all Firestore customers. Visualizations are generated at every hour boundary, covering data for the preceding two hours. Visualizations are generated as long as overall database traffic during a selected period meets the scan eligibility criteria.To get an overview of activity using Key Visualizer, first select a two-hour time period and review the heatmap for the “Total ops/s” metric. This view estimates the number of operations per second and how they are distributed across your database. Total ops/s is an estimated sum of write, lookup, and query operations averaged by seconds.Firestore automatically scales using a technique called range sharding. When using Firestore, you model data in the form of documents stored in hierarchies of collections. The collection hierarchy and document ID is translated to a single key for each document. Documents are logically stored and ordered lexicographically by this key. We use the term “key range” to refer to a range of keys. The full key range is then automatically split up as-needed, driven by storage and traffic load, and served by many replicated servers inside of Firestore.The following example of Key Visualizer visualization shows a heatmap where there are some major differences in the usage pattern across the database. The X-axis is time, and the Y-axis is the key range for your database, broken down into buckets by traffic.Ranges shown in dark colors have little or no activity.Ranges in bright colors have significantly more activity. In the example below, you can see the “Bar” and “Qux” collections going beyond 50 operations per second for some period of time.Additional methods of interpreting Key Visualizer visualizations are detailed in our documentation.Besides the total number of operations, Key Visualizer also provides views with metrics for ops per second, average latency, and tail latency, where traffic is broken down for writes and deletes, lookups, and queries. This capability allows you to identify issues with your data layout or poorly balanced traffic that may be contributing to increased latencies.Hotspots and heatmap patternsKey Visualizer gives you insight into how your traffic is distributed, and lets you understand if latency increases correlate with a hotspot, thus providing you with information to determine what parts of your application need to change. We refer to a “hotspot” as a case where traffic is poorly balanced across the database’s keyspace. For the best performance, requests should be distributed evenly across a keyspace. The effect of a hotspot can vary, but typically hotspotting causes higher latency and in some cases, even failed operations.Firestore automatically splits a key range into smaller pieces and distributes the work of serving traffic to more servers when needed. However, this has some limitations. Splitting storage and load takes time, and ramping up traffic too fast may cause hotspots while the service adjusts. The best practice is to distribute operations across the key range, while ramping up traffic on a cold database with 500 operations per second, and then increasing traffic by up to 50% every 5 minutes. This is called the “500/50/5″ rule, and allows you to rapidly warm up a cold database safely. For example, ramping to 1,000,000 ops/s can be achieved in under two hours.Firestore can automatically split a key range until it is serving a single document using a dedicated set of replicated servers. Once this threshold is hit, Firestore is unable to create further splits beyond a single document. As a result, high and sustained volumes of concurrent operations on a single document may result in elevated latencies. You can observe these high latencies using Key Visualizer’s average and tail latency metrics. If you encounter sustained high latencies on a single document, you should consider modifying your data model to split or replicate the data across multiple documents.Key Visualizer will also help you identify additional traffic patterns:Evenly distributed usage: If a heatmap shows a fine-grained mix of dark and bright colors, then reads and writes are evenly distributed throughout the database. This heatmap represents an effective usage pattern for Firestore, and no additional action is required.Sequential Keys: A heatmap with a single bright diagonal line can indicate a special hotspotting case where the database is using strictly increasing or decreasing keys (document IDs). Sequential keys are an anti-pattern in Firestore, which will result in elevated latency especially at higher operations per second. In this case, the document IDs that are generated and utilized should be randomized. To learn more, see the best practices page.Sudden traffic increase: A heatmap with a key range that suddenly changes from dark to bright indicates a sudden spike in load. If the load increase isn’t well distributed across the key range, and exceeds the 500/50/5 rule best practice, the database can experience elevated latency in the operations. In this case, the data layout should be modified to reflect a better distribution of usage and traffic across the keyspace.Next stepsFirestore Key Visualizer is a performance monitoring tool available to administrators and developers to better understand how their applications interact with Firestore. With this launch, Firestore joins our family of Cloud-native databases, including Cloud Spanner and Cloud Bigtable, in offering Key Visualizer to its customers. You can get started with Firestore Key Visualizer for free, from the Cloud Console.AcknowledgementSpecial thanks to Minh Nguyen, Lead Product Manager for Firestore, for contributing to this post.
Quelle: Google Cloud Platform

How can demand forecasting approach real time responsiveness? Vertex AI makes it possible

Everyone wishes they had a crystal ball—especially retailers and consumer goods companies looking for the next big trend, or logistics companies worried about the next big storm. With a veritable universe of data now at their fingertips (or at least at their keyboards), these companies can now get closer to real-time forecasting across a range of areas when they leverage the right AI and machine learning tools.For retailers, supply chain, and consumer goods organizations, accurate demand forecasting has always been a key driver of efficient business planning, inventory management, streamlined logistics and customer satisfaction. Accurate forecasting is critical to ensure that the right products, in the right volumes, are delivered to the right locations. Customers don’t like to see items out of stock, but too much inventory is costly and wasteful. Retailers lose over a trillion dollars a year in mismanaged inventory, according to IHL Group, whereas a 10% to 20% improvement in demand forecasting accuracy can directly produce a 5% reduction in inventory costs and a 2% to 3% increase in revenue (Notes from the AI Frontier, McKinsey & Company).Yet, inventory management is only one of the applications among many that demand forecasting can support—retailers need to also staff their stores and their support centers for busy periods, plan promotions and evaluate different factors that can impact store or online traffic. As retailers’ product catalog and global reach broaden, the available data becomes more complex and more difficult to forecast accurately. Unconstrained activities through the pandemic have only accentuated supply chain bottlenecks and forecasting challenges as the pace of change has been so rapid. Retailers can now infuse machine learning into their existing demand forecasting to achieve high forecast accuracy, by leveraging Vertex AI Forecast. This is one of the latest innovations born of Google Brain researchers and being made available to enterprises within an accelerated time frame. Top performing models within two hoursVertex AI Forecast can ingest datasets of up to 100 million rows covering years of historical data for many thousands of product lines from BigQuery or CSV files. The powerful modeling engine would automatically process the data and evaluate hundreds of different model architectures and package the best ones into one model which is easy to manage, even without advanced data science expertise. Users can include up to 1,000 different demand drivers  (color, brand, promotion schedule, e-commerce traffic statistics, and more) and set budgets to create the forecast. Given how quickly market conditions change, retailers need an agile system that can learn quickly. Teams can build demand forecasts at top-scoring accuracy with Vertex AI Forecast within just two hours of training time and no manual model tuning.The key part of the Vertex AI Forecast is model architecture search, where the service evaluates hundreds of different model architectures and settings. This algorithm allows Vertex AI Forecast to consistently find the best performing model setups for a wide variety of customers and datasets. Google has effectively built the brain that is applied towards demand forecasting in a non-intrusive and contextual way, to merge the art and (data) science of accurate demand forecasting. In benchmarking tests based on Kaggle datasets, Vertex AI Forecast performed in the highest 3% of accuracy in M5, the World’s Top Forecasting Competition. Leading retailers are already transforming their operations and reaping the benefits of highly accurate forecasting. ​​”Magalu has deployed Vertex AI Forecast to transform our forecasting predictions, by implementing distribution center level forecasting and reducing prediction errors simultaneously” said Fernando Nagano, director of Analytics and Strategic Planning at Magalu. “Four-week live forecasting showed significant improvements in error (WAPE) compared to our previous models,” Nagano added. “This high accuracy insight has helped us to plan our inventory allocation and replenishment more efficiently to ensure that the right items are in the right locations at the right time to meet customer demand and manage costs appropriately.”From weather to leather, Vertex AI can handle all kind of inputsWith the hierarchical forecast capabilities of Vertex AI Forecast, retailers can generate a highly accurate forecast that works on multiple levels (for example, tying together the demand at the individual item, store level, and regional levels) to minimize challenges created by organizational silos. Hierarchical models can also improve overall accuracy when historical data is sparse. When the demand for individual items is too random to forecast, the model can still pick up on patterns at the product category level.Vertex AI can ingest large volumes of structured and unstructured data, allowing planners to include many relevant demand drivers such as weather, product reviews, macroeconomic indicators, competitor actions, commodity prices, freight charges, ocean shipping carrier costs, and more. Vertex AI Forecast explainability features can show how each of these drivers contributes to the forecast and help the decision makers understand what drives the demand to take the corrective action early.The demand driver attributions are available not only for the overall forecast but for each individual item at every point. For instance, planners may discover that promotions are the main drivers of demand in the clothing category on weekdays, but not during the holidays. These kinds of insights can be invaluable when decisions are made on how to act on forecasts.Vertex AI Forecast is already helping Lowe’s with a range of models at the company’s more than 1,700 stores, according to Amaresh Siva, senior vice president for Innovation, Data and Supply Chain Technology at Lowe’s.“At Lowe’s, our stores and operations stretch across the United States, so it’s critical that we have highly accurate SKU-level forecasts to make decisions about allocating inventory to specific stores and replenishing items in high demand,” Siva said. “Using Vertex AI Forecast, Lowe’s has been able to create accurate hierarchical models that balance between SKU and store-level forecasts. These models take into account our store-level, SKU-level, and region-level inventory, promotions data and multiple other signals, and are yielding more accurate forecasts.”Key retail and supply chain partners, including o9 Solutions and Quantiphi, are already integrating Vertex AI Forecast into to provide value added services to customers. To learn more about demand forecasting with Vertex AI, please contact your Field Sales Representative, or try Vertex AI for free here.Related ArticleGoogle Cloud unveils Vertex AI, one platform, every ML tool you needGoogle Cloud launches Vertex AI, a managed platform for experimentation, versioning and deploying ML models into production.Read Article
Quelle: Google Cloud Platform

How Macy’s enhances the customer experience with Google Cloud services

Editor’s note: Learn from Mohamed Nazeemudeen, Director of software engineering at Macy’s, about Macy’s strategy regarding choosing cloud databases and how Macy’s pricing services leverage Cloud Bigtable under the hood. You can also find Mohamed’s Google Cloud Next ‘21 session on this topic on YouTube.At Macy’s we lead with our aim of fostering memorable shopping experiences for our customers. Our transition from on-premises operations to the Google Cloud Platform (GCP) cloud-first managed service databases is an extension of this dedication. Our mutual commitment to innovation in customer service led to the acceleration of our digital transition at an uncertain time for our industry and our company. As one of the nation’s premier omnichannel fashion retailers, Macy’s has 727 stores and operates in 43 states in the US. By leveraging Google’s databases, we’ve emerged from the COVID-19 pandemic with newfound scalability, flexibility, customer growth, and a vision that consistently challenges and inspires us to enhance the customer experience. Through our Google partnership, we succeeded at bolstering our e-commerce platform, optimizing internal operational efficiency, and enhancing every critical component of our services by choosing the appropriate database tools. How Macy’s leveraged GCP services to optimize efficiencyCommon Services is a strategic initiative at Macy’s that leverages GCP-managed services. The goal of Common Services is to provide a single source of truth for all internal clients of Macy’s selling channels. This centralization of our operations allows us to provide an integrated customer experience across the various channels of our company (digital, stores, enterprise, call centers, etc.).How Bigtable and Spanner support pricing and inventory managementThe SLA for Common Services is a 99.99% uptime, with cross-regional availability, supporting more than tens of thousands of queries per second at single digit latency at the 95th percentile. We decided to use GCP-managed services to lower our operational overhead.To store data from our catalog and support our inventory management, we leveraged Spanner. Our catalog service requires low latency and is tolerant to slightly stale data, so we used stale reads from Spanner with about 10 seconds exact staleness to keep latency low (single digit).We utilized Bigtable on Google Cloud as the backing database for our pricing system as it entails a very intensive workload and is highly sensitive to latency. BigTable allows us to get the information we need, with latency under 10ms at p99, regardless of the scale and size of the data. Our access pattern entails finding an item’s ticket price based on a given division, location, and the universal price code (UPC) which identifies the item. The system on BigTable supports a time that spans from multiple days in the past to multiple days in the future.We have millions of UPCs and more are added every day. With 700+ stores, and potentially multiple  price points per item, we create billions of data points. Our calculations, therefore, show that we will require  dozens of terabytes of storage. The storage available on GCP supports all our extensive storage needs while optimizing speed, functionality, and efficiency.How we designed our BigTable schemaWe wanted to access the information with one row key lookup to keep the overall latency low. For the row key, we use the location and the UPC. In order to avoid key range scans, and to be mindful of storage requirements, for the timestamp price values, we chose to use a protobuf inside a cell. Our performance testing showed that the cost of deserializing the protobuf was negligible and with GCP, our latency remained in single digit milliseconds.The Cloud Bigtable schema design for the price common serviceOur price systems involve heavy batch writes while processing price adjustment instructions, we have isolated the read and write workloads using Bigtable app profiles. The app profile is configured with multi-cluster routing so that Bigtable does the high availability for us.Our ability to enhance the performance of our operations and deliver a better experience for our customers is a direct reflection of GCP-managed services. The success of our partnership with Google reflects a mutual commitment to embracing innovation and imagination. We enjoyed this opportunity to expand Macy’s reach and streamline the shopping experience for our customers. We are excited to bring a new standard of personalization, accessibility, and comfort to today’s retail industry. 
Quelle: Google Cloud Platform

Quantum Metric explores retail big data use cases on BigQuery

Editor’s note: To kick off the new year, we invited partners from across our retail ecosystem to share stories, best practices, and tips and tricks on how they are helping retailers transform during a time that has seen tremendous change. The original version of this blog was published by Quantum Metric. Please enjoy this updated entry from our partner.If you had access to 100% of the behavioral data on the visitors to your digital properties, what would you change? The key to any digital intelligence platform is adoption. For this to happen, you need data – big data. Our most advanced customers are using Quantum Metric data outside the walls of the UI and exploring big data use cases for experience data.As such, Quantum Metric is built on Google Cloud BigQuery which enables our customers, many of which are retailers, to have access to their raw data. They can leverage this data directly in BigQuery or stream it to any data lake, cloud, or other system of their choosing. Through the Quantum Metric and BigQuery integration, customers can start leveraging experience data in more ways than you might realize. Let’s explore three ways enterprises are leveraging Quantum Metric data in BigQuery to enhance the customer experience. Use Case 1: Retargeting consumers when they don’t complete an online purchaseFirst, we look at retargeting. Often, when a shopping cart is abandoned or an error occurs during a consumer’s online shopping experience, you may not know why the situation occurred nor how to fix it in real-time.  With Quantum Metric data in Google BigQuery, you can see user behavior, including what happens when a cohort of users don’t convert. As a result, enterprises can leverage those insights to retarget and win the consumer over. Use Case 2: Enable real-time decision making with a customer data platformNext, consider how you can inform a customer data platform (CDP) to enable real-time decision making – the holy grail of data analytics. Imagine you are an airline undergoing digital transformation. Most airlines offer loyalty status or programs, and this program is usually built in tandem with a CDP, which allows airlines to get a 360-degree view of their customer from multiple sources of data and from different systems. With Quantum Metric on Google Cloud, you can combine customer data with experience data, empowering you to better understand how users are experiencing your products, applications or services, and enabling you to take action as needed in real-time.For example, you can see when loyalty members are showing traits of frustration and deploy a rescue via chat, or even trigger a call from a special support agent. You can also send follow-up offers like promos to drive frustrated customers back to your website. The combined context of behavior data and customer loyalty status data allows you to be more pragmatic and effective with your resources. This means taking actions that rescue frustrated customers and drive conversion rates.Use Case 3: Developing impactful personalizationThe above CDP example is just the beginning of what you can achieve with the Quantum Metric and BigQuery integration. To develop truly impactful personalization programs, you need a joint dataset that is informed by real-time behavioral data. With Quantum Metric and BigQuery, customers can access real-time behavioral data, such as clicks, view time, and frustrations, which allows you to develop impactful personalized experiences. Let’s think about this through an example. Imagine a large retailer that specializes in selling commodities and needs to perform well on Black Friday. Through the Quantum Metric and BigQuery integration, they have real-time data on product engagement, such as clicks, taps, view time, frustration, and other statistics. When they combine these insights with products available by region and competitive pricing data, they have a recipe for success when it comes to generating sales on Black Friday. With these data insights, retailers can create cohorts of users (by age, device, loyalty status, purchase history, etc.). These cohorts receive personalized product recommendations based on the critical sources of data. These recommendations are compelling for consumers, since they are well priced, popular products that shoppers know are in stock. This approach to personalization will become more important as supply chain inventory challenges continue into 2022.Quantum MetricWith Quantum Metric and BigQuery, you can explore these three big data use cases. The exciting part is, this is just the beginning of what you can accomplish when you combine real-time experience analytics data with critical business systems. Read the companion piece to learn more about how companies are making the most of Quantum Metric and BigQuery today.Related ArticleFaster time to value with Data Analytics Design PatternsDesign Patterns provide customers with tools they need to accelerate time to value and implement common use cases so they can focus on in…Read Article
Quelle: Google Cloud Platform