Now generally available: BigQuery BI Engine supports any BI tool or custom application

Customers who work with data warehouses, running BI on large datasets used to have to pick low latency but trading off freshness of data. With BigQuery BI Engine, they can accelerate their dashboards and reports that connect to BigQuery without having to sacrifice freshness of the data. Using the latest insights helps them make better decisions for the business. BI Engine enables customers to be able to get “formula one” performance for their queries across all BI tools that connect with BigQuery, thereby helping them leverage existing investments. Last year, we launched a preview of BigQuery BI Engine, a fast in-memory analysis service that accelerates and provides sub-second query performance for dashboards and reports that connect to BigQuery. BI Engine works with any BI or custom dashboarding tool. This was designed to help analysts identify trends faster, reduce risk, match the pace of customer demand, and improve operational efficiency in an ever-changing business climate. With this launch, customers were able to build fast, interactive dashboards using any of the popular tools like Looker, Tableau, Sheets, PowerBI, Qlik or even any custom application.And our customers have realized this value quickly. “We have seen significant performance improvements within BigQuery after implementing BI Engine. Our views and materialized views have been especially improved after implementing BI Engine.” says Yell McGuyer, Data Architect at Keller Williams Realty.Today, we are very excited to announce the general availability of BigQuery BI Engine for all BI and custom applications that work with BigQuery! BI Engine Acceleration works seamlessly with BigQuery Native Integration with the BigQuery API. BI Engine natively integrates with the BigQuery API, which means that if your dashboards use standard interfaces like SQL, BigQuery APIs or JDBC/ODBC drivers to connect to BigQuery, then BI Engine is automatically supported. No changes are required for applications or dashboards to get sub-second, scalable dashboards up and running. If you run a query with BigQuery and if it can be accelerated, it will be accelerated with BI Engine.Intelligent Scaling. Customers do not have to worry about efficiently using the memory reservation, BI Engine does it for you based on the access patterns. BI Engine leverages advanced techniques like vectorized processing, advanced data encodings, and adaptive caching to maximize performance while optimizing memory usage. It can also intelligently create replicas of the same data to enable concurrent access.Simple Configuration. The only configuration needed when using BI Engine is to set up memory reservation, which is provided in a fine-grained increment of 1GB each. Full Visibility. Monitoring and logging are critical for running applications in the cloud and to gain insight into performance and opportunities for optimization. BI Engine integrates with familiar tools such as Information Schema for job details (e.g. aggregate refresh time, cache hit ratios, query latency etc) and Stackdriver for monitoring of usage. Getting started with BI EngineBI Engine is now available in all regions where BigQuery is available. You can sign up for a BigQuery sandbox here and enable BI Engine for your project. Feel free to read through the documentation and quick-starts guides for popular BI tools. You can also watch the demo from Data Cloud Summit to see how BI Engine works with BI tools like Looker, Data Studio and Tableau. If you’re a partner with an integration to BigQuery, consider joining the Google Cloud Ready – BigQuery initiative. You can find more details about the program here.
Quelle: Google Cloud Platform

How Google Cloud and partners can accelerate your migration success

As enterprises accelerate their migration to the cloud, they experience more notable mid- and late-phase migration challenges. Specifically, 41% face challenges when optimizing apps in the cloud post-migration, and 38% struggle with performance issues on workloads migrated to the cloud. Further, organizations have also increased reliance on outside consultants and other service providers for early-stage cloud migration tasks to ongoing management post-implementation.1To help customers through these challenges with a simple, quick path to a successful cloud migration, Google Cloud created our comprehensive Rapid Assessment & Migration Program (RAMP). And we’ve got some exciting developments to share with our customers and partners: Expanded focus on post-migration TCO/ROIGiven the complex nature of cloud migrations, we are committed to meeting our customers where they’re at in their cloud journeys and partnering with them to achieve their business goals — be it building customer value through innovation, driving cost efficiencies, or increasing competitive differentiation and productivity. RAMP is a holistic framework based on tangible customer TCO and ROI analyses, that supports our customers’ journeys all the way through: from assessing their digital landscapes across multiple sources including on-prem and other clouds, and identifying prioritized target workloads to building a comprehensive migration and modernization plan. Accelerate positive outcomes with expert partnersCustomers can also now expect a more streamlined migration experience through our ecosystem of partners who have completed their cloud migration specialization. Last week, we announced industry-leading updates to our partner funding programs with new assessment and consumption packages that simplify and accelerate our customers’ journey to Google Cloud, at little-to-no cost. These packages offer prescriptive pathways for infrastructure and application modernization initiatives, empowering our partners to support our customers at every stage — from discovery and planning to migration and modernization. Through our partner ecosystem, our customers can expect:Distinct funding packages for assessment, planning, and migrationFaster approval processes for accelerated deploymentsMore partners eligible to participate in RAMP and access these new funding packagesSustainability through migrationAnother major focus area for RAMP is helping enterprises optimize their migration planning and maximize their ROI by including their business and technical considerations early in the process and including any sustainability goals they may have. To aid with their sustainability efforts, we are excited to share that customers can now receive a Digital Sustainability Report along with their IT assessments – enabling sustainability to be built into their migration strategies. The report provides actionable insights to measure and reduce their environmental impact, and is based on some of Google Cloud’s own best practices, having been carbon-neutral for decades and looking to run on carbon-free energy by 2030. We are committed to solving complex problems for our customers and partners, and these updates are a reflection of the feedback we receive. Simplify your cloud migration strategy today by requesting your free assessment, finding a partner to work with, or talking to your existing partner to get started.1. Forrester Consulting, State Of Public Cloud Migration; A study commissioned by Google, 2022Related ArticleIs a cloud migration on your to do list? Our top stories from 2021 can helpThinking about migrating to Google Cloud in 2022? Here’s what to catch up on from 2021!Read Article
Quelle: Google Cloud Platform

Introducing new Google Cloud manufacturing solutions: smart factories, smarter workers

Today, manufacturers are advancing on their digital transformation journey, betting on innovative technologies like cloud and AI to strengthen competitiveness and deliver sustainable growth. Nearly two thirds of manufacturers already use cloud solutions, according to McKinsey. The actual work of scaling digital transformation projects from proof of concept to production, however, still remains a challenge for the majority of them, according to analysts.We believe the scalability challenges revolve around two factors—the lack of access to contextualized operational data and the skills gap to use complex data science and AI tools on the factory floor.To ensure manufacturers can scale their digital transformation efforts into production, Google Cloud is announcing new manufacturing solutions, specifically designed for manufacturers’ needs. The new manufacturing solutions from Google Cloud give manufacturing engineers and plant managers access to unified and contextualized data from across their disparate assets and processes.Let’s take a look at the new solutions as we follow the data journey, from the factory floor to the cloud:Manufacturing Data Engine is the foundational cloud solution to process, contextualize and store factory data. The cloud platform can acquire data from any type of machine, supporting a wide range of data, from telemetry to image data, via a private, secure, and low cost connection between edge and cloud. With built-in data normalization and context-enrichment capabilities, it provides a common data model, with a factory-optimized data lakehouse for storage. Manufacturing Connect is the factory edge platform co-developed with Litmus Automation that quickly connects with nearly any manufacturing asset via an extensive library of 250-plus machine protocols. It translates machine data into a digestible dataset and sends it to the Manufacturing Data Engine for processing, contextualization and storage. By supporting containerized workloads, it allows manufacturers to run low-latency data visualization, analytics and ML capabilities directly on the edge.Built on the Manufacturing Data Engine are a growing set of data analytics and AI use cases, enabled by Google Cloud and our partners:Manufacturing analytics & insights: An out-of-the-box integration with Looker templates that delivers a dashboarding and analytics experience. As an easy-to-use, no-code data and analytics model, it empowers manufacturing engineers and plant managers to quickly create and modify custom dashboards, adding new machines, setups, and factories automatically. The solution enables drill down into the data against KPIs, or on-demand to uncover new insights and improvement opportunities throughout the factory. Shareable insights unlock collaboration across the enterprise and with partners.Predictive maintenance: Pre-built predictive maintenance machine learning models allow manufacturers to deploy in weeks without compromising on prediction accuracy. Manufacturers can continuously improve their models and refine them in collaboration with Google Cloud engineers. Machine-level anomaly detection: A purpose-built integration that leverages Google Cloud’s Time Series Insights API on real-time machine and sensor data to identify anomalies as they occur and provide alerts. “The growing amount of sensor data generated on our assembly lines creates an opportunity for smarter analytics around product quality, production efficiency, and equipment health monitoring, but it also means new data intake and management challenges,” said Jason Ryska, director of manufacturing technology development at Ford Motor Company. “We worked with Google Cloud to implement a data platform now operating on more than 100 key machines connected across two plants, streaming and storing over 25 million records per week. We’re gaining strong insights from the data that will help us implement predictive and preventive actions and continue to become even more efficient in our manufacturing plants.”“With the tight integration of a powerful factory edge solution with Google Cloud, it is easier than ever for factories to tap into cloud capabilities,” said Masaharu Akieda, general manager for the Digital Solutions Division at KYOCERA Communication Systems Company. “Google Cloud’s solutions enable a broader group of users beyond data scientists to quickly access, analyze and use data in a variety of use cases. We are excited to partner with Google Cloud as we implement new manufacturing solutions to optimize production operations and consistently increase quality.”“As the global innovator of solid state cooling and heating technology, we’ve developed a sustainable manufacturing platform that uses less water, less electricity, and less chemical waste,” says Jason Ruppert, chief operations officer of Phononic. “This partnership with Google Cloud allows us to contextualize data across all of our manufacturing processes – ultimately providing us the analytics and insights to optimize our operations and continue to bring to the world products that cool sustainably, reducing greenhouse gas (GhG) emissions and improving the environment.”A growing number of partners are extending Google Cloud’s manufacturing solutions, from connectors, to AI-driven use cases. Take a look at what our partners are saying about the Manufacturing Data Engine and Manufacturing Connect at our upcoming Google Cloud Manufacturing Spotlight.With Google cloud’s new manufacturing solutions, three critical pieces of smart manufacturing operations are strengthened and integrated: factory-floor engineers, data, and AI. Empowering factory-floor engineers to be the hub of smart manufacturingOver the last few years, the manufacturing industry contributed more than 10% of the U.S. gross domestic product, or 24% of GDP with indirect value (i.e. purchases from other industries) included. This is also the sector that employs approximately 15 million people, representing 10% of total U.S. employment. However, more than 20% of manufacturers’ workforce in the US is older than 55 years, and an average age of 44 years old – with similar patterns seen across the world. Finding new talent to replace the retiring workforce is getting increasingly harder for manufacturers.Companies therefore need to both enable their existing workforce, while making it more attractive to new talent to join. This balance requires making critical technology such as Cloud and AI accessible, easier to use, and deeply embedded in manufacturers’ day-to-day operations.Google Cloud’s manufacturing solutions are designed with this end in mind. Combining fast implementation and ease-of-use, powerful digital tools are put directly into the hands of the manufacturers’ workforce to uncover new insights and optimize operations in entirely new ways.Key parts of the solution are low- to no-code in setup and use, and therefore are suitable for a large variety of end users. Built for scale, the solutions allow for template-based rollouts and encourage reuse through standardization. Designed with best practices in mind, manufacturers are enabled to focus precious resources on use cases, instead of the underlying infrastructure.Manufacturing engineers can visualize and drill down into data using Manufacturing Analytics & Insights, built on Looker’s business intelligence engine. Being integrated with the Manufacturing Data Engine, its automatic configuration provides an up-to-date view into any aspect of manufacturing operations.  From the COO to plant managers and factory engineers, users are enabled to easily browse and explore factory data on the enterprise, factory, line machine, and sensor level.Besides designing manufacturing solutions from the ground up for ease-of-use, Google Cloud and partners are actively helping manufacturers in upskilling their workforce capabilities with a dedicated enablement service.Making every data point accessible and actionableData is the backbone of digital manufacturing transformation and manufacturers have a potential abundance of data: performance logs from a single machine can generate 5 gigabytes of data per week, and a typical smart factory can produce 5 petabytes per week.However, this wealth of data and the insights contained within it remain largely inaccessible for many manufacturers today: data is often only partially captured, and then locked away in a variety of disparate and proprietary systems.Manufacturing Connect, co-developed with Litmus Automation, provides an industry-leading breadth of 250-plus native protocol connectors to quickly connect to and acquire data from nearly any production asset and system with a few clicks. Integrated analytics features and support for containerized workloads provide manufacturers with the option for on-premise processing of data.A complementary cloud component allows manufacturers to centrally manage, configure, standardize and update edge instances across all their factories for roll-outs on a global scale. Integrated in the same UI, users can also manage downstream processing of data sent to the cloud by configuring Google Cloud’s Manufacturing Data Engine solution.The Manufacturing Data Engine provides structure to the data, and allows for semantic contextualization. Doing so, data is made universally accessible and useful across the enterprise. By abstracting away the underlying complexity of manufacturing data, manufacturers and partners are enabled to develop high value, repeatable, scalable, and quick to implement analytics and AI use cases.AI for smart manufacturing demands a broad partner ecosystemManufacturers recognize the value of AI solutions in driving cost and production optimizations. So much so that several of them have active patents on AI initiatives. In fact, according to research from Google in June, 2021, 66% of manufacturers that use AI in their day-to-day operations report their reliance on AI is increasing. Google Cloud helps manufacturers put cloud technology and artificial intelligence to work helping factories run faster and smoother. Customers using the Manufacturing Data Engine from Google Cloud can directly access Google Cloud’s industry-leading Vertex AI platform, which offers integrated AI/ML tools ranging from AutoML for manufacturing engineers, to advanced AI tools for experts to fine-tune results. With Google Cloud, AI/ML use case development has never been more accessible for manufacturers.Crossing the scalability chasm for using the power of cloud and AI in manufacturingOur mission is to accelerate your digital transformation by bridging data silos, and to help make every engineer into a data scientist with easy-to-use AI technologies and an industry data platform. Join us at the Google Cloud Manufacturer Spotlight to learn more.The new manufacturing solutions will be demonstrated in person for the first time at Hannover Messe 2022, May 30–June 2. Visit us at Stand E68, Hall 004, or schedule a meeting for an onsite demonstration with our experts.Related ArticleLeading with Google Cloud & Partners to modernize infrastructure in manufacturingLearn how Google Cloud Partner Advantage partners help customers solve real-world business challenges in manufacturing.Read Article
Quelle: Google Cloud Platform

CIS hardening support in Container-Optimized OS from Google

At Google, we follow a security-first philosophy to make safeguarding our clients’ and users’ data easier and more scalable, with strong security principles built into multiple layers of Google Cloud. In line with this philosophy, we want to make sure that our Container-Optimized OS adheres to industry-standard security best practices. To this end, we released a CIS benchmark for Container-Optimized OS that codifies the recommendations for hardening and security measures we have been using. Our Container-Optimized OS  97 releases now support CIS Level 1 compliance, with an option to enable support for CIS Level 2 hardening.CIS benchmarks help define the security recommendations for various software systems, including various operating systems. In the past, Google had developed a CIS benchmark for Kubernetes as part of the continued contributions to the container orchestration space. We decided to build a CIS benchmark for Container-Optimized OS because they are well recognized across the industry, are created and reviewed in open source, and can provide a good baseline when it comes to hardening your operating systems. Our benchmarks for Container-Optimized OS are based on the CIS benchmarks defined by their security community for distribution-independent Linux OSes. In addition to applying some of the security recommendations for generic Linuxes—such as making file permissions more strict—we included measures to support hardening specific to Container-Optimized OS, such as verifying that the OS has the capabilities for checking filesystem integrity with dm-verity or that logs can be exported to Cloud Logging. We also removed some checks that don’t apply to Container-Optimized OS due to its minimal OS footprint that can reduce the attack surface. Container-Optimized OS 97 and later versions come with support for CIS Level 1 and can allow users to optionally apply support for Level 2 hardening as well.Compliance is not just about a one-time hardening effort, however. You will need to ensure that the deployed OS images stay within compliance throughout their life. At Google, we continually run scans on our Google Cloud projects to help verify that our VMs and container images are kept up-to-date with the latest CIS security guidelines. To help scan a wide range of products with a low resource usage overhead, we developed Localtoast, our own open-source configuration scanner.Localtoast is highly customizable and can be used to detect insecure OS configurations on local and remote machines, VMs, and containers. Google uses Localtoast internally to help verify CIS compliance on a wide range of Container-Optimized OS installations and other OSes. Its configuration and scan results are stored in the same Grafeas format that deploy-time security enforcement systems such as Kritis use, which can make it easier to integrate with existing supply chain security and integrity tooling. See this video for a showcase of how you can use this Localtoast scanner on COS.Included in the Localtoast repo is a set of scan configuration files that help scan Container-Optimized OS’ CIS benchmarks. For other Linux OSes, we include a fallback config which supports and is based on the distribution-independent Linux CIS benchmarks and aims to help provide relevant security findings for a wide range of Linuxes—with support for more OSes coming in the future.Apart from the configs for scanning live instances, we also released modified configs for scanning container images.Container-Optimized OS 97 and above comes with Localtoast and the Container-Optimized OS-specific scanning config that supports CIS compliance pre-installed. We welcome you to try out our user-guide, and hope that the provided tools will help you get a step further in your journey toward keeping your cloud infrastructure secure. If you have any questions, don’t hesitate to reach out to us.Related Article4 new ways Citrix & Google Cloud can simplify your Cloud MigrationCitrix and Google Cloud simplify your cloud migration. The expanding partnership between Citrix and Google Cloud means that customers con…Read Article
Quelle: Google Cloud Platform

Solving for food waste with data analytics in Google Cloud

With over ⅓ of the food in the USA ending up as waste according to the USDA, it is a compelling challenge to address this travesty.  What will happen to hunger, food prices, trash reduction, water consumption, and overall sustainability when we stop squandering this abundance?Beginning with the departure from the farm to the back of the store, the freshness clock continues to run.  Grocers work very hard to purchase high quality produce items for their customers and the journey to the shelf can take a toll in both quality and remaining shelf life.  Suppliers focus on delivering their items through the arduous supply chain journey to the store with speed and gentle handling.  The baton is then passed to the store to unload and present the items to customers with care to sell through each lot significantly before the expiration or sell by date.  This is to ensure that the time spent in the customer’s home is ample to ensure a great eating experience as well. Food waste is a farm to fork problem with opportunity at every step of the chain, but today we will focus on the segment that the grocery industry oversees.With the complexities of weather, geopolitical issues, distribution, sales variability, pricing, promotions, and inventory management, it seems daunting to impact waste.  Fortunately, data analytics and machine learning in the cloud is a powerful weapon in the fight against food waste. Data Scientists harness knowledge to draw meaning from data turning that data into decision driving information. One key Google has been working on to accelerate value is to break down data silos and leverage machine learning to realize better outcomes, using our Google Data Cloud platform. This enables better planning through demand forecasting, Inventory management, assortment planning, and dynamic pricing and promotions.That sounds great but how does it work?  Let’s walk through a day in the life journey to see how the integrated Google Data Cloudplatform can change the game for good. Our friendly fictitious grocer FastFreshFood is committed to selling high quality perishable items to their local market. Their goal is to minimize food waste and maximize revenue by selling as much perishable fresh food as possible before the sell by date. Our fictitious grocer in partnership with Google Cloud could build a solution that will take a significant bite out of their food waste volume and better satisfy customers. Sales through the register and online are processed in real time with Datastream, Dataflow to keep an accurate perpetual inventory by minute of every single item.A Demand forecasting model using machine learning algorithms in BigQuery then identifies needs for back room replenishment, so Direct Store Delivery and daily store Distribution Centers manage ordering more efficiently to ensure just the right amount of each product each day.Realtime reporting dashboards in Looker with alerting capabilities enable the system to operate with strong associate support and understanding. The reporting suite shows inventory levels into the future, daily orders, and at risk items.The pricing algorithm could also alert store leadership concerning any items that will not sell through and suggest real time in store specials resulting in zero waste at shelf and maximized revenue.This approach is not just for perishable categories and is a pattern that works well for in-store produced items and center store items.  The key point is that by bringing ML/AI to difficult business problems grocers are reinventing what is possible for both their profitability and sustainability.The technical implementation of this design pattern in Google Cloud leverages Datastream, Dataflow, BigQuery and Looker products, it is detailed in a technical tutorial accompanying this blog post.In partnership with Google Cloud, retailers can solve complex problems with innovative solutions to achieve higher quality, lower cost, and provide great customer experiences. To learn more from this and other use cases, please visit our Design Patterns website.Curious to learn more? We’re excited to share what we know about tackling food waste at Google, a topic we’ve been working on in the last decade as we’ve embarked on reducing our own food waste in our operations in over 50 countries in the world. The Google Food for Good team works exclusively on Google Cloud Platform with our partners on this topic. Two additional articles below. Silos are for food, not for data – tackling food waste with technologyThis business Cloud blog directly addresses information silos that currently exist across many nodes in the food system and how to break down cultural and organizational barriers to sharing. “Unsiloing” data to work toward solving food waste and food insecurity This follow-on technical Cloud blog articulates the path to setting up data pipelines, translating between data sets (not everyone calls a tomato a tomato!) and making sense of emergent insights.Related ArticleSilos are for food, not data—tackling food waste with technologySee how Kroger, Feeding America, St. Mary’s and other food banks joined forces to solve the problems of food waste and food insecurity us…Read Article
Quelle: Google Cloud Platform

Optimize and scale your startup on Google Cloud: Introducing the Build Series

We understand that at each stage of the startup journey, you need different levels of support and resources to start, build and grow. To help with your journey, we created the Google Cloud Technical Guide for Startups to help your organization across these different milestones.Technical Guides for Startups to support your startup journeyThe Google Cloud Technical Guides for Startups series includes a video series and handbooks, consisting of three parts optimized for different stages of a startup’s journey.The Start Series: Begin by building, deploying and managing new applications on Google Cloud from start to finish.The Build Series: Optimize and scale existing deployments to reach your target audiences.The Grow Series:  Grow and attain scale with deployments on Google Cloud.The Start Series – is fully available on this playlist. In this series,  we introduced topics to get you started on Google Cloud. This included setting up your project, choosing the right compute option, configuring databases, networking, as well as understanding support and billing.Now that you have applications running on Google Cloud, it is time to take the next step to optimize and scale these deployments.Kicking off the Build SeriesWith our Start Series complete, we are happy to announce the second program in the series – the Build Series! The Build Series focuses on optimizing deployments and scaling your business, enabling you to build a foundation to accelerate your startups’ growth in the future. We will dive into many exciting topics, ranging from startup programs to Google Cloud’s data analytics and pipelines solutions, machine learning, API management and more. You will learn to gain insights from your data and to better manage and secure your applications, which will accelerate scale and understanding of your end user. Our first episode shares an overview of these topics, and features our new website which has many useful startup resources and technical handbooks. Watch our kick off video to find out more.Embark on the journey togetherWe hope that you will join us on this journey, as we Start, Build, and Grow together. Get started by checking out our website and our full playlist on the Google Cloud Tech channel. Don’t forget to subscribe to stay up to date. See you in the cloud!Related ArticleBootstrap your startup with the Google Cloud Technical Guides for Startups : A Look into the Start SeriesAnnouncing the summary of the first phase of the Google Cloud Technical Guides for Startups, a video series for technical enablement aime…Read Article
Quelle: Google Cloud Platform

Advancing systems research with open-source Google workload traces

With rapid expansion of internet and cloud computing, warehouse-scale computing (WSC) workloads (search, email, video sharing, online maps, online shopping, etc.) have reached planetary scale and are driving the lion’s share of growth in computing demand. WSC workloads also differ from others in their requirements for on-demand scalability, elasticity and availability. Many studies (e.g., Profiling a warehouse-scale computer) and books (e.g., The Datacenter as a Computer: Designing Warehouse-Scale Machines) have pointed out that WSC workloads have fundamentally different characteristics than traditional benchmarks and require changes to modern computer architecture to achieve optimal efficiency. Google workloads have data and instruction footprints that go beyond the capacity of modern CPU caches, such that the CPU spends a significant portion of its time waiting for code and data. Simply increasing memory bandwidth would not solve the problem, as many accesses are in the critical path for application request processing; it is just as important to reduce memory access latency as it is to increase memory bandwidth.Over the years, the computer architecture community has expressed the need for WSC workload traces to perform architecture research. Today, we are pleased to announce that we’ve published select Google workload traces. These traces will help systems designers better understand how WSC workloads perform as they interact with underlying components, and develop new solutions for front-end and data-access bottlenecks.We captured these workload traces using DynamoRIO on computer servers running Google workloads — you can find more details at https://dynamorio.org/google_workload_traces.html. To protect user privacy, these traces only contain instruction and memory addresses. We have found these traces useful for understanding WSC workloads and seeding internal research on processor front-ends, on-die interconnects, caches and memory subsystems, etc. — all areas that greatly impact WSC workloads. For example, we used these traces to develop AsmDB. Likewise, we hope these traces will enable  the computer architecture community to develop new ideas that improve performance and efficiency of other WSC workloads.
Quelle: Google Cloud Platform

Are your SLOs realistic? How to analyze your risks like an SRE

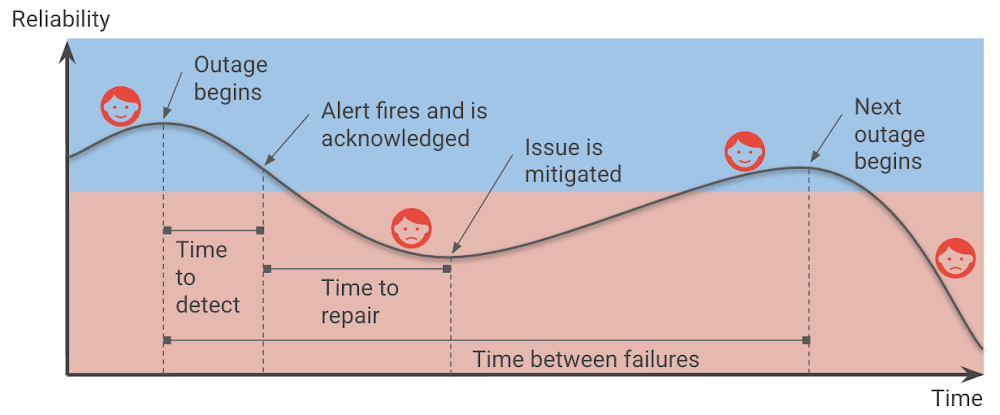
Setting up Service Level Objectives (SLOs) is one of the foundational tasks of Site Reliability Engineering (SRE) practices, giving the SRE team a target against which to evaluate whether or not a service is running reliably enough. The inverse of your SLO is your error budget — how much unreliability you are willing to tolerate. Once you’ve identified those targets and learned how to set SLOs, the next question you should ask yourself is whether your SLOs are realistic, given your application architecture and team practices? Are you sure that you can meet them? And what’s most likely to spend the error budget?At Google, SREs answer these questions up front when they take on a new service, as part of a Production Readiness Review (PRR). The intention of this risk analysis is not to prompt you to change your SLOs, but rather to prioritize and communicate the risks to a given service, so you can evaluate whether you’ll be able to actually meet your SLOs, with or without any changes to the service. In addition, it can help you identify which risks are the most important to prioritize and mitigate, using the best available data.You can make your service more reliable by identifying and mitigating risks.Risk analysis basicsBefore you can evaluate and prioritize your risks, though, you need to come up with a comprehensive list of things to watch out for. In this post, we’ll provide some guidelines for teams tasked with brainstorming all the potential risks to an application. Then, with that list in hand, we’ll show you how to actually analyze and prioritize the risks you’ve identified. What risks do you want to consider?When brainstorming risks, it’s important to try to map risks in different categories — risks that are related to your dependencies, monitoring, capacity, operations, and release process. And for each of those, imagine what will happen if specific failures happen, for example, if a third party is down, or if you introduce an application or configuration bug. Thus, when thinking about your measurements, ask yourself: Are there any observability gaps? Do you have alerts for this specific SLI? Do you even currently collect those metrics? Also be sure to also map any monitoring and alerting dependencies. For example, what happens if a managed system that you use goes down?Ideally, you want to identify the risks associated with each failure point for each critical component in a critical user journey, or CUJ. And after identifying those risks, you will want to quantify them:What percentage of users was affected by the failure?How often do you estimate that failure will occur?How long did it take to detect the failure? It’s also helpful to gather information about any incidents that happened in the last year that affected CUJs. Compared with gut feelings, relying on historical data can provide more accurate estimates and a good starting point for actual incidents. For example, you may want to consider incidents such as:A configuration mishap that reduces capacity, causing overload and dropped requestsA new release that breaks a small set of requests; the failure is not detected for a day; quick rollback when detected.A cloud provider’s single-zone VM/network outageA cloud provider’s regional VM/network outageThe operator accidentally deletes a database, requiring a restore from backupAnother aspect to think about is risk factors; these are global factors that affect the overall time to detection (TTD) and time to repair (TTR). These tend to be operational factors that can increase the time needed to detect outages (for example when using log-based metrics) or alert the on-call engineers. Another example could be a lack of playbooks/documentation or lack of automatic procedures. For example, you have:  Estimated time to detection (ETTD) of +30m due to operational overload such as noisy alertingA 10% greater frequency of a possible failure, due to lack of postmortems or action item follow-upBrainstorming guidelines: Recommendation for the facilitatorBeyond the technical aspects of what to look for in a potential risk to your service, there are some best practices to consider when holding a brainstorming session with your team. Start the discussion with a high-level block diagram of the service, its users, and its dependencies. Get a set of diverse opinions in the room — different roles that intersect with the product differently than you do. Also, avoid having only one party speak. Ask participants for the ways in which each element of the diagram could cause an error to be served to the user. Group similar root causes together into a single risk category, such as “database outage”.Try to avoid spending too long discussing things where the estimated time between a given failure is longer than a couple of years, or where the impact is limited to a very small subset of users.Creating your risk catalog You don’t need to capture an endless list of risks; seven to 12 risks per Service Level Indicator (SLI) are sufficient. The important thing is that the data capture high probability and critical risks. Starting with real outages is best. Those can be as simple as unavailability of <depended service or network>.Capture both infrastructure- and software-related issues. Think about risks that can affect the SLI, the time-to-detect and time-to-resolve, and frequency — more on those metrics below.Capture both risks in the risk catalog and risk factors (global factors). For example, the risk of not having a playbook adds to your time-to-repair; not having alerts for the CUJ adds to the time-to-detection; the risk of a log sync delay of x minutes increases your time-to-detection by the same amount. Then, catalog all these risks and their associated impacts to a global impacts tab.Here are a few examples of risks: A new release breaks a small set of requests; not detected for a day; quick rollback when detected.A new release breaks a sizable subset of requests; and no automatic rollback.A configuration mishap reduces capacity / Unnoticed growth in usage hits max.Recommendation: Examining the data/result of implementing the SLI will give you a good indication of where you stand in regard to achieving your targets. I recommend starting with creating one dashboard for each CUJ — ideally a dashboard that includes metrics that will also allow us to troubleshoot and debug problems in achieving the SLOs.Analyzing the risksNow that you’ve generated a list of potential risks, it’s time to analyze them, in order to prioritize their likelihood, and potentially find ways to mitigate against them. It’s time, in other words, to do a risk analysis. Risk analysis provides a data-driven approach to address and prioritize the needed risks, by estimating four key dimensions: the above-mentioned TTD and TTR, as well as time-between failures (TBF), and their impact on users.In Shrinking the impact of production incidents using SRE principles, we introduced a diagram of the production incident cycle. Blue represents when users are happy, and red represents when users are unhappy. The time that your services are unreliable and your users are unhappy consists of the time-to-detect and the time-to-repair, and is affected by the frequency of incidents (which can be translated to time-between-failures).Therefore, we can improve reliability by increasing the time between failures, decreasing the time-to-detect or time-to-repair, and of course, reducing the impact of the outages in the first place.Engineering your service for resiliency can reduce the frequency of total failures. You should avoid single points of failure in your architecture, whether it be an individual instance, availability zone, or even an entire region, which can prevent a smaller, localized outage from snowballing into global downtime.You can reduce the impact on your users by reducing the percentage of infrastructure or users affected or the requests (e.g., throttling part of the requests vs. all of them). In order to reduce the blast radius of outages, avoid global changes and adopt advanced deployments strategies that allow you to gradually deploy changes. Consider progressive and canary rollouts over the course of hours, days, or weeks, which allow you to reduce the risk and to identify an issue before all your users are affected.Further, having robust Continuous Integration and Continuous Delivery (CI/CD) pipelines allows you to deploy and roll back with confidence and reduce customer impact (See: SRE Book: Chapter 8 – Release Engineering). Creating an integrated process of code review and testing will help you find the issues early on before users are affected. Improving the time to detect means that you catch outages faster. As a reminder, having an estimated TTD expresses how long until a human being is informed of the problem. For example, imagine someone receives and acts upon a page. TTD also includes any delays until the ‘detection’ like data processing. For example, if I’m using a log-based alert, and my log system has an ingestion time of 5 minutes, this increases the TTD for every alert by 5 minutes.ETTR (estimated time-to-repair) is the time between the time a human sees the alert and the time your users are happy. Improving time-to-repair means that we fix outages quicker, in principle. That said, our focus should still be “does this incident still affect our users?” In most cases mitigations like rolling back new releases or diverting traffic to unaffected regions can reduce or eliminate the impact of an ongoing outage on users much faster than trying to roll forward to a new, patched build. The root cause isn’t yet fixed, but the users don’t know or care — all they see is that the service is working again. While it takes the human out of the loop, using automation can reduce the TTR and can be crucial to achieving higher reliability targets. However, it doesn’t eliminate the TTR altogether, because even if a mitigation such as failing over to a different region is automated, it still takes time for it to have an impact.A note about “estimated” values: At the beginning of a risk analysis, you might start with rough estimates for these metrics. But as you collect more data from incidents data you can update these estimates based on data from prior outages. Risk analysis process at a high level The risk analysis process starts by brainstorming risks for each of your SLOs, and more correctly for each one of your SLIs, as different SLIs will be exposed to different risks. In the next phase, build a risk catalog and iterate on it.Create a risk analysis sheet for two or three SLIs, using this template. Read more at How to prioritize and communicate risks.Brainstorm risks internally, considering the things that can affect your SLOs, and gathering some initial data. Do this first with the engineering team and then include the product team.The risk analysis sheets for each of your SLIs should include ETTD, ETTR, impact, and frequency. Include global factors and suggested risks and whether these risks are acceptable or not.Collect historical data and consult with the product team regarding the SLO-business needs. Iterate and update data based on incidents in production.Accepting risksAfter building the risk catalog and capturing the risk factors, finalize the SLOs according to business need and risk analysis. This step means you need to evaluate whether your SLO is achievable given the risks, and if it isn’t — what do you need to do to achieve your targets? It is crucial that PMs be part of this review process especially as they might need to prioritize engineering work that mitigates or eliminates any unacceptable risks.In how to prioritize and communicate risks, we introduce how to use the ‘Risk Stack Rank’ sheet to see how much a given risk may “cost” you, and which risks you can accept (or not) for a given SLO. For example, in the template sheet, you could accept all risks and achieve 99.5% reliability, some of the risks to achieve 99.9% and none of them to achieve 99.99%. If you can’t accept a risk because you estimate that it will burn more error budget than your SLO affords you, that is a clear argument for dedicating engineering time to either fixing the root cause or building some sort of mitigation.One final note: similar to SLOs, you will want to iterate on your risk refining your ETTD based on actual TTD observed during outages, and similarly for ETTR. After incidents, you need to update the data and see where you stand regarding those estimates. In addition, revisit those estimates periodically to evaluate whether your risks are still relevant, if your estimates are correct, or if there are any additional risks that you need to account for. Like the SRE principle of continuous improvement, it’s work that’s never truly done, but that is well worth the effort!For more on this topic, check out my upcoming DevOpsDays 2022 talk, taking place in Birmingham on May 6 and in Prague on May 24.   Further reading and resourcesSite Reliability Engineering: Measuring and Managing Reliability (Coursera course)Google Cloud Architecture Framework: ReliabilityThe Calculus of Service AvailabilityKnow thy enemy: how to prioritize and communicate risks—CRE life lessonsIncident Metrics in SRE – Google – Site Reliability EngineeringSRE on Google CloudRelated ArticleKnow thy enemy: How to prioritize and communicate risks—CRE life lessonsHow to effectively communicate and stack-rank risks in your system.Read Article
Quelle: Google Cloud Platform

Orchestrate Looker data transformations with Cloud Composer

Today, we are announcing that Looker’s new Google Cloud operators for Apache Airflow are available in Cloud Composer, Google Cloud’s fully managed service for orchestrating workflows across cloud, hybrid, and multi-cloud environments. This integration gives users the ability to orchestrate Looker persistent derived tables (PDTs) alongside the rest of their data pipeline.Looker PDTs are the materialized results of a query, written to a Looker scratch schema in the connected database and rebuilt on a defined schedule. Because they are defined within LookML, PDTs reduce friction and speed up time to value by putting the power to create robust data transformations in the hands of data modelers. But administration of these transformations can be difficult to scale. By leveraging this new integration, customers can now get greater visibility into and exercise more granular control over their data transformations. Using Looker with Cloud Composer enables customers to:Know exactly when PDTs are going to rebuild by directly linking PDT regeneration jobs to the completion of other data transformation jobs. This insight ensures that PDTs are always up to date without using Looker datagroups to repeatedly query for changes in the underlying data and enables admins to closely control job timing and resource consumption.Automatically kick off other tasks that leverage data from PDTs, like piping transformed data into a machine learning model or delivering transformed data to another tool or file store. Quickly get alerted of errors that occur for more proactive troubleshooting and issue resolution.Save time and resources by quickly identifying any points of failure within a chain of cascading PDTs and restarting the build process from there rather than from the beginning. Within Looker, there are only options to rebuild a specific PDT or to rebuild the entire chain.Easily pick up any changes in your underlying database by forcing incremental PDTs to reload in full on a schedule or on an ad-hoc basis with the click of a button.Pairing Looker with Cloud Composer provides customers with a pathway for accomplishing key tasks like these, making it easier to manage and scale PDT usage.What’s NewThere are two new Looker operators available that can be used to manage PDT builds using Cloud Composer:LookerStartPdtBuildOperator: initiates materialization for a PDT based on a specified model name and view name and returns the materialization ID.LookerCheckPdtBuildSensor: checks the status of a PDT build based on a provided materialization ID for the PDT build job.These operators can be used in Cloud Composer to create tasks inside of a Directed Acyclic Graph, or DAG, with each task representing a specific PDT build. These tasks can be organized based on relationships and dependencies across different PDTs and other data transformation jobs.Getting StartedYou can start using Looker and Cloud Composer together in a few steps:Within your connection settings in your Looker instance, turn on the Enable PDT API Control toggle. Make sure that this setting is enabled for any connection with PDTs that you’d like to manage using Cloud Composer.Set up a Looker connection in Cloud Composer. This connection can be done through Airflow directly, but for production use, we’d recommend that you use Cloud Composer’s Secret Manager.Create a DAG using Cloud Composer.Add tasks into your DAG for PDT builds.Define dependencies between tasks within your DAG.To learn more about how to externally orchestrate your Looker data transformations, see this tutorial in the Looker Community. Data Transformations at ScaleThis integration between Looker and Cloud Composer pairs the speed and agility of PDTs with the added scalability and governance of Cloud Composer. By managing these Looker data transformations using Cloud Composer, customers can:Define and manage build schedules to help ensure that resourcing is allocated efficiently across all ongoing processesSee the jobs that are running, have errored, or have completed, including Looker data transformations, in one placeLeverage the output of a PDT within other automated data transformations taking place outside of LookerThanks to this integration with Cloud Composer, Looker is giving customers the ability to empower modelers and analysts to transform data at speed, while also tapping into a scalable governance model for transformation management and maintenance.  Looker operators for Cloud Composer are generally available to customers using an Airflow 2 environment. For more information, check out the Cloud Composer documentation or read this tutorial on setting up Looker with Apache Airflow.Acknowledgements: Aleks Flexo, Product ManagerRelated ArticleWhat is Cloud Composer?What is Cloud Composer? A fully managed workflow orchestration service built on Apache Airflow that helps author, schedule, and monitor p…Read Article
Quelle: Google Cloud Platform

Introducing Topaz — the first subsea cable to connect Canada and Asia

There’s a new subsea cable in town: Topaz, the first-ever fiber cable to connect Canada and Asia. Once complete, Topaz will run from Vancouver to the small town of Port Alberni on the west coast of Vancouver Island in British Columbia, and across the Pacific Ocean to the prefectures of Mie and Ibaraki in Japan. We expect the cable to be ready for service in 2023, not only delivering low-latency access to Search, Gmail and YouTube, Google Cloud, and other Google services, but also increasing capacity to the region for a variety of network operators in both Japan and Canada. Google is spearheading construction of the project, joined by a number of local partners in Japan and Canada to deliver the full Topaz subsea cable system. Other networks and internet service providers will be able to benefit from the cable’s additional capacity, whether for their own use or to provide to third parties. And, similar to other cables we’ve built, with Topaz we will exchange fiber pairs with partners who have systems along similar routes. This is a longstanding practice in the industry that strengthens the intercontinental network lattice for network operators, for Google, and for users around the world.Network infrastructure investments like Topaz bring significant economic activity to the regions where they land. For example, according to a recent Analysys Mason study, Google’s historical and future network infrastructure investments in Japan are forecasted to enable an additional $303 billion (USD) in GDP cumulatively between 2022 and 2026. The width of a garden hose, the Topaz cable will house 16 fiber pairs, for a total capacity of 240 Terabits per second (not to be confused with TSPs). It includes support for Wavelength Selective Switch (WSS), an efficient and software-defined way to carve up the spectrum on an optical fiber pair for flexibility in routing and advanced resilience. We’re proud to bring WSS to Topaz and to see the technology is being implemented widely across the submarine cable industry.  While Topaz is the first trans-Pacific fiber cable to land on the West Coast of Canada, it’s not the first communication cable to connect to Vancouver Island. In the 1960s, the Commonwealth Pacific Cable System (COMPAC) was a copper undersea cable linking Vancouver with Honolulu (United States), Sydney (Australia), and Auckland (New Zealand), expanding high-quality international phone connectivity. Today, COMPAC is no longer in service but its legacy lives on. The original cable landing station in Vancouver — the facility where COMPAC made landfall on Canadian soil — has been upgraded to fit the needs of modern fiber optics and will house the eastern end of the Topaz cable.Traditional and treaty rights, and local communities, are deeply important to our infrastructure projects. The Topaz cable is built alongside the traditional territories of the Hupacasath, Maa-nulth, and Tseshaht, and we have consulted with and partnered with these First Nations every step of the way. “Tseshaht is very proud of this collaboration and our partnership with Google, who has been very respectful and thoughtful in its engagement with our Nation. That’s how we carry ourselves and that’s how we want business to carry themselves in our territory.“ — Tseshaht First Nation – Elected Chief Councillor-Ken Watts “The five First Nations of the Maa-nulth Treaty Society are pleased that we have concluded an agreement with Google Canada and have consented to the installation of a new, high-speed fiber optic cable through our traditional territories. This agreement, in which both Google Canada and our Nations benefit, is based on respect for our constitutionally protected treaty and aboriginal rights and enhances the process of reconciliation. We would also like to acknowledge the sensitivity that Google Canada expressed during our talks in regard to the pain and trauma experienced by our people as a result of residential school experience. We look forward to a long and mutually beneficial relationship with Google Canada.” —Chief Charlie Cootes, President of the Maa-nulth Treaty Society“Google’s respect towards our Nation is appreciated and has good energy behind it.” —Hupacasath First Nation – Elected Chief Councilor – Brandy Lauder With the addition of Topaz today, we have announced investments in 20 subsea cable projects. This includes Curie, Dunant, Equiano, Firmina and Grace Hopper, and consortium cables like Blue, Echo, Havfrue and Raman — all connecting 29 cloud regions, 88 zones, 146 network edge locations across more than 200 countries and territories. Learn about Google Cloud’s network and infrastructure on our website and in the below video.
Quelle: Google Cloud Platform