Enterprise DevOps Guidebook – Chapter 1

The Google Cloud DORA team has been hard at work releasing our yearly Accelerate State of DevOps report. This research provides an independent view into the practices and capabilities that organizations, irrespective of their size, industry, and region, can employ to drive better performance. Year over year, the State of DevOpsreport helps organizations benchmark themselves against others in the industry as elite, high, medium, or low performers and provides recommendations for how organizations can continually improve. The table below highlights elite, high, medium, and low performers at a glance from the last report.To give more prescriptive advice on how to successfully implement DORA best practices with Google Cloud, we are excited to announce the DevOps Enterprise Guidebook. The guidebook will be your resource providing a concrete action plan for implementing recommendations using Google Cloud’s DORA research to initiate performance improvements.We will release the guidebook in chapter increments. The goal of this first chapter is to give your organization a better understanding of how to use DORA’s resources to measure your performance and to begin your first DevOps team experiment. Some resources include the DevOps Quick check, where you can measure your teams’ software delivery performance in less than a minute with just five multiple choice questions, or a more indepthcapabilities assessment, an assessment we deploy in your organization that gives us a robust measurement of your organization’s capabilities as they pertain to software delivery.Future chapters will touch on other main topics we have identified in the State of DevOps reports such as shifting left on security, cloud adoption, and easy to use DevOps tools. We want to make it easy for your organization to get the most out of investing in DevOps and with the launch of the guidebook we believe the focused recommendations will help more organizations successfully implement DevOps practices that will lead to business and organizational success.2022 State of DevOps SurveyFor the 2022 State of DevOps report we will be focusing on a topic that has been top of mind recently: security. This year we are doing a deeper investigation into how security practices and capabilities predict overall software delivery and operations performance. We invite you to join the over 32,000 professionals worldwide who have participated in the DORA reports by completing our 2022 State of DevOps survey.The survey will remain open until midnight PDT on July 22, 2022. Please help us encourage more voices by sharing this survey with your network, especially with your colleagues from underrepresented parts of our industry. We look forward to hearing from you and your teams!Related Article2021 Accelerate State of DevOps report addresses burnout, team performanceThe SODR is continually one of the most downloaded assets on the GCP website. We are releasing the updated version of the report with new…Read Article
Quelle: Google Cloud Platform

Discover our new edge concepts at Hannover Messe that bring smart factories to life

The typical smart factory is said to produce around 5 petabytes of data per week. That’s equivalent to 5 million gigabytes, or roughly 20,000 smartphones.Managing such vast amounts of data in one facility, let alone a global organization, would be challenging enough. Doing so on the factory floor, in near-real-time, to drive insights, enhancements, and particularly safety, is a big dream for leading manufacturers. And for many, it’s becoming a reality, thanks to the possibilities unlocked with edge computing.Edge computing brings computation, connectivity, and data closer to where the information is generated, enabling better data control, faster insights, and actions. Taking advantage of edge computing requires the hardware and software to collect, process, and analyze data locally to enable better decisions and improve operations. At Hannover Messe 2022, Intel and Google Cloud will demonstrate a new technology implementation that combines the latest generation of Intel processors with Google Cloud’s data and AI expertise to optimize production operations from edge to cloud. This proof-of-concept project is powered by the Edge Insights for Industrial platform (EII), an industry-specific platform from Intel; and a pair of Google Cloud solutions: Anthos, Google Cloud’s managed applications platform, and the newly-launched Manufacturing Data Engine.Edge computing exploits the untapped gold mine of data sitting on-site and is expected to grow rapidly. The Linux Foundation’s “2021 State of the Edge” predicts that by 2025, edge-related devices will produce roughly 90 zettabytes of data. Edge computing can help provide greater data privacy and security, and can accomodate the reduced bandwidth needs between local storage and the cloud.Imagine a world in which the power of big data and AI-driven data analytics is available at the point where the data is gathered to inform, make, and implement decisions in near real-time.This could be anywhere on the factory floor, from a welding station to a painting operation or more. Data would be collected by monitoring robotic welders, for example, and analyzed by industrial PCs (IPCs) located at the factory edge. These edge IPCs would detect when the welders are starting to go off spec, predicting increased defect rates even before they appear, and adding preventive maintenance to correct the errors without any direct intervention. Real time, predictive analytics using AI could substantially prevent defects before they happen. Or the same IPCs could use digital cameras for visual inspection to monitor and identify defects in real-time, allowing them to be addressed quickly.Edge computing has powerful potential applications in assisting with data gathering, processing, storage and analysis in many manufacturing sectors, including automotive, semiconductor and electronics manufacturing, and consumer packaged goods. Whether modeling and analysis is done and stored locally or in the cloud, or is predictive, simultaneous, or lagged, technology providers are aligning to meet these needs. This is the new world of edge computing. The joint Intel and Google Cloud proof of concept aims to extend the Google Cloud capabilities and solutions to the edge. Intel’s full breadth of industrial solutions, hardware and software, are coming together in this edge-ready solution, encompassing Google Cloud industry-leading tools. The concept shortens the time to insights, streamlining data analytics and AI at the edge.Intel’s Edge Insight for Industrial and FIDO Device Onboarding (FDO) at the edge running Google Anthos on Intel® NUCs.The Intel-Google Cloud proof of concept demonstrates how manufacturers can gather and analyze data from over 250 factory devices using Manufacturing Connect from Google Cloud, providing a powerful platform to run data ingestion and AI analytics at the edge. In this demonstration in Hannover, Intel and Google Cloud show how manufacturers can capture time-series data from robotic welders to inspect welding quality and show how predictive analytics can benefit the factory operators. In addition, the video and image data is captured from a factory camera to show how visual inspection can highlight anomalies on plastic chips with model scoring. The demo also features zero-touch device onboarding using FIDO Device Onboard (FDO) to illustrate the ease with which additional computers could be added to the existing Anthos cluster.By combining Google Cloud’s expertise in data, AI/ML and Intel’s Edge Insight’s for Industrial platform that was optimized to run on Google Anthos, manufacturers can run and manage their containerized applications at the edge, in on-premise data center, or in public clouds using an efficient and secure connection to the Manufacturing Data Engine from Google Cloud. It forges a complete edge-to-cloud solution.Simplified device onboarding is available using Fido Device Onboard (FDO)—an open IoT protocol that brings fast, secure, and scalable zero-touch onboarding of new IoT devices to the edge. FDO allows factories to easily deploy automation and intelligence in their environment without introducing complexity into their OT infrastructure.The Intel-Google Cloud implementation can analyze that data using localized Intel or third-party AI and machine learning algorithms.  Applications can be layered on the Intel hardware and Anthos ecosystem, allowing customized data monitoring and ingestion, data management and storage, modeling, and analytics. This joint PoC facilitates and support improved decision making and operations, whether automated or triggered by the engineers on the front lines. Intel collaborates with a vibrant ecosystem of leading hardware partners to develop solutions for the industrial market by using the latest generation of Intel processors.  These processors can run data intensive workloads at the edge with ease.Intel Industrial PC Ecosystem PartnersPutting data and AI directly into the hands of manufacturing engineers can improve quality inspection loops,  customer satisfaction, and ultimately the bottom line. The new manufacturing solutions will be demonstrated in person for the first time at Hannover Messe 2022, May 30–June 2, 2022. Visit us at Stand E68, Hall 004, or schedule a meeting for an onsite demonstration with our experts.Related ArticleIntroducing new Google Cloud manufacturing solutions: smart factories, smarter workersGoogle Cloud Manufacturing Solutions Announcement.Read Article
Quelle: Google Cloud Platform

Monitoring transaction ID utilization using Cloud SQL for PostgreSQL metrics

PostgreSQL uses transaction IDs (also called TXIDs or XIDs) to implement Multi-Version Concurrency Control semantics (MVCC). The PostgreSQL documentation explains the role of XIDs as follows:PostgreSQL’s MVCC transaction semantics depend on being able to compare transaction ID (XID) numbers: a row version with an insertion XID greater than the current transaction’s XID is “in the future” and should not be visible to the current transaction. But since transaction IDs have limited size (32 bits), a cluster that runs for a long time would suffer transaction ID wraparound: the XID counter wraps around to zero, and all of a sudden transactions that were in the past appear to be in the future – which means their output becomes invisible. In short, catastrophic data loss. (…) The maximum time that a table can go unvacuumed is two billion transactions (…). If it were to go unvacuumed for longer than that, data loss could result.To prevent transaction ID wraparound, PostgreSQL uses a vacuum mechanism, which operates as a background task called autovacuum (enabled by default), or it can be run manually using the VACUUM command. A vacuum operation freezes committed transaction IDs and releases them for further use. You can think of this mechanism as “recycling” of transaction IDs that keeps the database operating despite using a finite number to store the transaction ID. Vacuum can sometimes be blocked due to workload patterns, or it can become too slow to keep up with database activity. If transaction ID utilization continues to grow despite the freezing performed by autovacuum or manual vacuum, the database will eventually refuse to accept new commands to protect itself against TXID wraparound. To help you monitor your database and ensure that this doesn’t happen, Cloud SQL for PostgreSQL introduced three new metrics:transaction_id_utilizationtransaction_id_countoldest_transaction_ageUnderstanding the transaction metricsGuidance provided in this section applies to PostgreSQL databases running with default vacuum settings. You might observe different TXID utilization patterns if your database is deliberately configured to delay vacuum operations e.g. for performance reasons.Recommendations regarding the detection and mitigation of TXID utilization issues should apply to all databases regardless of configuration.Transaction ID utilization and countA transaction ID is assigned when the transaction starts, and it is frozen when the transaction is vacuumed. With that, TXID utilization is the number of unvacuumed transactions  (“assigned” minus “frozen”) expressed as a fraction of the 2-billion maximum.Under the default PostgreSQL settings, with vacuum processes performing optimally and without interruption, most databases experience TXID utilization in the region of ~10%. Higher utilization levels can be observed in busy databases where vacuum frequently yields to regular workloads. If the utilization trends towards very high values (80% or more), the database might be at risk of TXID exhaustion unless vacuum is allowed to make quicker progress.Cloud SQL provides two metrics to describe TXID usage:database/postgresql/transaction_id_utilization records the number of unvacuumed transactions as a fraction of the 2-billion maximum. You can use this metric for monitoring or alerting to ensure that the database isn’t experiencing a shortage of transaction IDs.database/postgresql/transaction_id_count records the number of TXIDs assigned and frozen. You can use this metric to learn more about your TXID allocation and vacuum patterns e.g. how many TXIDs are allocated each second/minute/hour during peak load.ExampleThe chart below shows the transaction_id_count metric with a ~200 million difference between the “assigned” and “frozen” TXID. This might seem like a large number, but it’s only ~10% of the 2-billion maximum, and the pattern remains stable with no sign of long-term divergence. This is a happy database!On the other hand, the chart below shows a database that continues to allocate TXIDs to new transactions, but doesn’t appear to be freezing any TXIDs. This indicates that the vacuum is blocked. The difference between “assigned” and “frozen” XIDs has already grown to ~1 billion (~50% of maximum), and this database could run out of transaction IDs if the situation persists.Here is the transaction_id_utilization metric for the same database:Oldest transaction agePostgreSQL can only vacuum committed transactions. This means that old (long-running) uncommitted transactions will block vacuum, which may eventually lead to TXID exhaustion.The database/postgresql/vacuum/oldest_transaction_age metric tracks the age of the oldest uncommitted transaction in the PostgreSQL instance, measured in the number of transactions that started since the oldest transaction.There’s no single recommended value or threshold for this metric, but you can use it to gain additional insight in your workload, and determine whether transaction age may contribute to a vacuum backlog.ExampleAssume that the oldest transaction age is 50 million, which means that vacuum won’t be able to process the 50 million transactions that started after the oldest one. The value itself is neither good nor bad: 50 million transactions might be a lot on a database that’s mostly idle, or it might be just over an hour’s worth of workload on a busy server that runs 13k transitions per second. The metric value does indicate the presence of a long-running transaction, but a backlog of 50 million TXIDs is a very small portion of the 2-billion maximum, so the transaction doesn’t create a high risk of TXID exhaustion. You could optimize the transaction for performance and efficiency reasons, but there’s no immediate reason for concern regarding vacuum.However, what if the oldest transaction age is 1.5 billion? It not only indicates that a transaction has been running for a very long time, but the transaction also prevents vacuum from freezing 75% of the total TXID range. This situation warrants a closer investigation, because the transaction has a major impact on vacuum, and might push the database towards TXID exhaustion.Working with metricsYou can interact with the transaction metrics through the familiar Cloud SQL tools and features:Use Metrics Explorer to view and chart the metrics.Access the metrics programmatically with the Cloud Monitoring API.Use dashboards for convenient manual monitoring.Create alerting policies for automated notifications on the key metrics.This section provides examples using the transaction_id_utilization metric. You can follow similar steps for the other metrics.Charting transaction ID utilization in Metrics ExplorerFollow these instructions to chart transaction_id_utilization using Metrics Explorer. Note that Metrics Explorer displays the values as a percentage between 0% and 100%, but the underlying metric is a number on the scale of 0.0 to 1.0. When accessing the metric programmatically, you can calculate percentages by multiplying the raw value by 100%.To  chart the transaction ID utilization metric, do the following:In the Cloud Console, select Monitoring. You can also use this direct link: Go to MonitoringIn the navigation menu on the left, Metrics Explorer.Select the Explorer tab, and the Configuration dialog. They might be pre-selected by default.Under the “Resource & Metric” section, expand the Select a metric drop-down menu.Choose the Transaction ID utilization metric under “Cloud SQL Database” resource,  “Database” category. You’ll be able to find the metric more easily after typing “transaction” into the search box:You should now see the transaction ID utilization metric for all the instances in the project:Optionally, you can add a filter to see the metric for a specific instance instead of all instances:Under the “Filters” section, click Add Filter. A filter form will appear.In the Label field, select database_id.In the Comparison field, select (= equals).Type your instance name in the Value field.Confirm by clicking Done.The filtered chart should now contain only one line depicting transaction ID utilization for a single instance:As a useful exercise, you can view this metric for a number of your instances and try to explain any spikes or trends using your knowledge about the instance’s workload patterns.Creating an alerting policy on transaction ID utilizationAs explained previously, if the transaction id utilization reaches 100%, the database would no longer allow write operations to protect itself against XID wraparound. It’s therefore important to monitor the transaction ID utilization metric on mission-critical PostgreSQL databases.You can create an alerting policy to receive an automatic notification if the metric breaches a pre-configured threshold. A well-chosen threshold should serve two purposes:Indicate that the database is experiencing unusual workload patterns, even if TXID wraparound is not imminent.If the database is indeed trending towards XID wraparound, give you enough time to remedy the situation. The following example shows how to create an alert on transaction ID utilization for the threshold value of 70%, which may be appropriate for most databases.To create an alerting policy, do the following:In the Cloud Console, select Monitoring. You can also use this direct link: Go to MonitoringIn the navigation menu on the left, select Alerting.Click Create Policy near the top of the page, which will take you to the Create alerting policy dialog.In the Select a metric drop-down menu, find the Transaction ID utilization metric.Leave settings under Transform data unchanged for this demonstration. You can learn more about data transformations here.Optionally, you can add filters to set up the alarm on selected instances instead of all instances.Click the Next button at the bottom of the page, which will take you to the Configure alert trigger dialog.Use the following settings:Condition type: Threshold.Alert trigger: Any time series violates.Threshold position: Above threshold.Threshold value: 70 (or a different value of your choice).Optionally, provide a custom name for the condition under Advanced Options e.g. “Transaction ID Utilization High”.Click the Next button at the bottom of the page, which will take you to the Configure notifications and finalize alert dialog.Select your notification channel. If there are no notification channels to choose from, follow steps here to configure a notification channel.Give the alert an easily recognizable name e.g. “Transaction ID Utilization crossed 70%”. Optionally, provide additional notes or documentation that will help you react to a notification.Click the Create policy button at the bottom of the page.When the alert triggers, you will receive a notification similar to this:If none of your instances are currently experiencing TXID utilization high enough to trigger the notification, you can temporarily use a lower threshold for test purposes.ConclusionIn this blog post, we demonstrated how you can explore and interpret transaction ID utilization metrics on your database instances using Cloud SQL for PostgreSQL. We also learned how to create an alert policy for transaction ID utilization on a Cloud SQL instance.Related ArticleMigrate databases to Google Cloud VMware Engine (GCVE)Processes and tools used to migrate databases to Google Cloud VMware Engine (GCVE).Read Article
Quelle: Google Cloud Platform

AlloyDB for PostgreSQL under the hood: Columnar engine

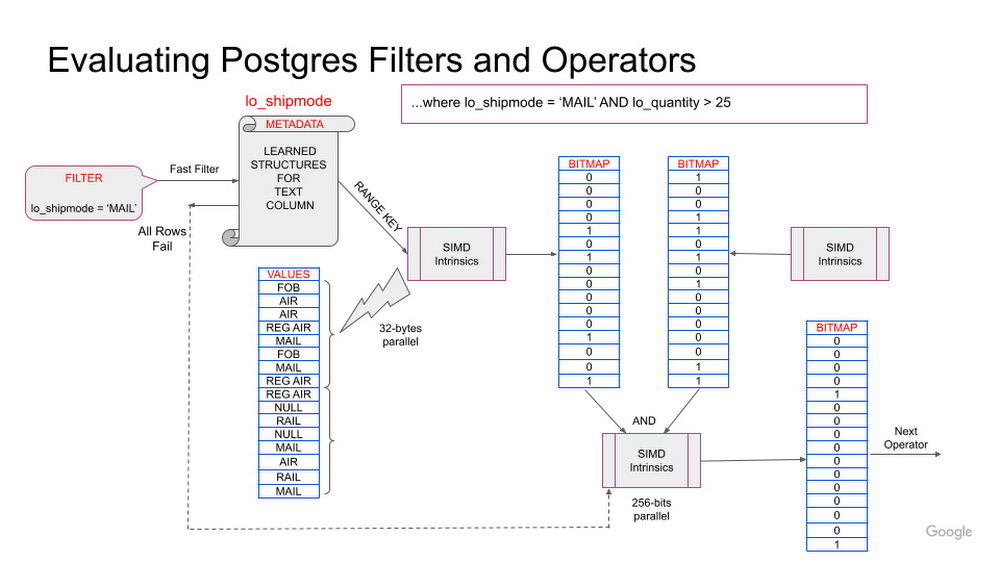
Recently, at Google I/O, we announced AlloyDB for PostgreSQL, a fully-managed, PostgreSQL-compatible database for demanding, enterprise-grade transactional and analytical workloads. Imagine PostgreSQL plus the best of the cloud: elastic storage and compute, intelligent caching, and AI/ML-powered management. Further, AlloyDB delivers unmatched price-performance: In our performance tests, it’s more than 4x faster on transactional workloads, and up to 100x faster on analytical queries than standard PostgreSQL, all with simple, predictable pricing. Designed for mission-critical applications, AlloyDB offers extensive data protection and an industry leading 99.99% availability SLA, inclusive of maintenance. Multiple innovations underpin the performance, and availability gains of AlloyDB for PostgreSQL. In the first part of our “AlloyDB for PostgreSQL under the hood” series, we discussed AlloyDB’s intelligent storage layer, and today, we are covering AlloyDB’s vectorized columnar execution engine, which enables analytical acceleration. PostgreSQL and hybrid workload patternsGeneral-purpose databases like PostgreSQL often support a wide variety of workloads. Some of those workloads are purely transactional in nature, and in the previous post, we discussed how our intelligent storage layer contributes to making AlloyDB more than 4x faster than standard PostgreSQL for such workloads based on our performance tests. However, PostgreSQL also has rich querying functionality that many users leverage both inside and outside of their applications. Analytical queries, i.e., queries involving scans, joins, and aggregations over a large amount of data, are a core part of many relational database workloads. These can include:Queries within an application that serves end-users, for example: an ecommerce application that shows most popular products segmented by region based on recent sales across multiple propertiesReal-time business insights for analysis that requires access to the most up-to-date data. For example: a recommendation engine in a retail application that shows suggested add-on purchases based on what the user has in their cart, the time of day, and historical purchase behaviorAd-hoc querying, where a developer or user might need to query the database directly to answer a question, for example, running an audit on recent transactions for a regulatorTuning operational databases to perform well in these varying use cases can be difficult. Historically, users with these types of workloads have had to create indexes and optimize schemas to ensure sufficient query performance. This not only increases management complexity, but can also impact transactional performance. Slow query performance can also constrain what developers are able to deliver to their end users, and deter development of real-time business insights.AlloyDB provides a better way. Powered by a columnar engine, AlloyDB performed up to 100x faster than standard PostgreSQL for analytical queries based on our performance tests, with no schema changes, application changes, or ETL required. This technology keeps frequently queried data in an in-memory, columnar format for faster scans, joins, and aggregations. The embedded machine learning in AlloyDB makes accessing this technology easier than ever. AlloyDB automatically organizes your data between row-based and columnar formats, choosing the right columns and tables based on learning your workload, and converting them to columnar format automatically. The query planner smartly chooses between columnar and row-based execution plans, so transactional performance is maintained. This allows AlloyDB to deliver excellent performance for a wide range of queries, with minimal management overhead.A refresher on column-oriented data representationTraditional databases are row-oriented and store data in fixed-sized blocks. This organization is optimal for access patterns that request information across a whole row, for example, when an application needs to look up information pertaining to a particular user. Row-oriented storage is optimized for these types of access patterns. Analytical queries require different access patterns. In order to answer analytical queries from a row-oriented data store, whole tables need to be scanned, reading through every column of every row, even though much of the data stored in the table is not relevant to answering the questions. Column-oriented data representation enables answering analytical questions faster, by keeping the values in a single column together. By focusing access to only the relevant columns, column-oriented databases can deliver faster responses to analytical queries.AlloyDB columnar engine Google has a long history of innovation in large-scale data analytics, especially with services like BigQuery. These services offer fast, scalable query processing through the use of optimized, columnar data layouts, state-of-the-art query processing techniques, and hardware acceleration. AlloyDB embeds some of the same technological advancements directly into a PostgreSQL-compatible operational database. It combines a row-based format for transactional processing and storage with a columnar format and execution engine to provide the best of both worlds.The columnar engine is a modern, vectorized query processing engine that efficiently processes chunks of columnar data by making optimal use of the system caches and vector processing instructions provided by today’s CPUs.Beyond leveraging the capabilities of modern hardware, the columnar engine includes several algorithmic optimizations to further speed up query processing. It makes use of column-specific metadata, such as minimum and maximum values, to speed up scans, and can perform other operations like aggregation directly on the relevant columns without materializing the results of a scan. Finally, hybrid execution combines both columnar and row-oriented query processing techniques where beneficial.Columnar data formatThe columnar engine intelligently determines the data format and metadata for each column; it learns from both the content of the column and the type of query operations that are executed. Learned metadata is used both to encode the data values efficiently and to accelerate query processing. For example, when a string column that has a small number of distinct values is used in filters, the columnar engine may decide to generate a list of the distinct values as metadata. This can then be used to accelerate both equality and range-based filters. As another example, the columnar engine may keep minimum and maximum values of a date column (for a given range of rows) as metadata; this may then be used to skip that range of rows when processing certain filters. In addition, the columnar engine may also use compression techniques to make efficient use of memory and speed up query processing. Query accelerationThe columnar engine transforms queries into a series of operations on columns and their metadata. Typically this involves first looking up the metadata to determine the most efficient type of operation to perform on an array of column values. These operations on column values, called vectorized operations, are designed to be executed using hardware-accelerated vectorized (SIMD) instructions that are available on modern CPUs.The columnar engine can also perform table scan operations efficiently without fully materializing the result of the table scan; for example, if an aggregation operation needs to be performed after a table scan, it may use the result of evaluating the filters to directly perform vectorized aggregation operations on the relevant columns. Join operations are transparently accelerated using bloom filters, depending on selectivity; this optimization uses the power of vectorized filtering to reduce the number of rows that need to be processed by the join operation.Let’s take a look at how some of these optimizations apply to a simple query involving a table scan based on a schema similar to the Star Schema benchmark. This query scans the list of sales, filtering by shipping mode and date. The following figure illustrates how the table scan with two filters is executed. For the filter lo_shipmode = ‘MAIL’, the columnar engine first checks the column’s metadata to see if the value ‘MAIL’ is present in this dataset. If ‘MAIL’ does occur, the columnar engine proceeds by searching using SIMD instructions. The resulting bitmap of passing rows is further filtered using the result set from the next filter. Alternatively, if the value ‘MAIL’ had not occured in the column metadata, the columnar engine could have skipped searching a large number of values. Similarly, the columnar engine may also use min/max metadata on the lo_quantity column to skip some rows based on the range filter on that column.Figure 1: Example query operation with table scans with two filtersAutomatic, intelligent data populationWe designed AlloyDB with automation in mind, given that workloads vary widely and workload characteristics change over time. AlloyDB uses machine learning (ML) techniques along with analytical models to intelligently select  the best tables/columns to keep in columnar format, and provides mechanisms to automatically maintain this data in memory. It also determines the best format to use for the columnar data representation, and what metadata would be most useful for each column, based on the values in the column and the query operations performed on it. This allows end users to take advantage of columnar technology immediately, without evaluating the details of their queries. It also means that the columnar engine will continue to optimize performance as query patterns change.Query plan executionAfter the data is initially loaded into memory, AlloyDB monitors changes to the data and ensures that it is refreshed automatically. Depending on the data changes as well as the query operations being performed, it may be best to execute queries fully on columnar data, fully on row-oriented data, or a hybrid of the two. The AlloyDB query planner uses a costing model to automatically choose the best mode of execution for each node in the query plan.Figure 2: Hybrid scans can scan multiple columnar tables, and access the row-store at the same timeQuery performanceWhile we expect the columnar engine to significantly improve the performance of analytic queries in general, the magnitude of improvement will depend on the specific query.  The largest improvements from the columnar engine can be seen for queries with selective filters on wide tables (tables with a large number of columns — as is typical in many analytic use cases) that access a small fraction of the columns in the table. Selective joins, especially with small tables, will also benefit significantly from the columnar engine, through the use of efficient bloom filtering. We are continuously innovating in this area and building new capabilities to broaden the performance impact of the columnar engine on different query patterns. To illustrate how the magnitude of the performance improvement varies based on the above factors, we compared performance with and without the columnar engine for a few example queries. These queries are based on the Star Schema benchmark, and were run with Scale factor = 10 on a 16-vCPU AlloyDB instance:Example 1: Get the total revenue from sales with a specific discount and quantity; this query has a highly selective (0.18%) filter, along with aggregation on one column117x improvementcode_block[StructValue([(u’code’, u’select sum(lo_revenue) as revenuernfrom lineorderrnwhere lo_discount = 1rnand lo_quantity = 1′), (u’language’, u”)])]Example 2: For each ship mode, get the total revenue from sales where the discount and quantity were within a specific range; this query has a less selective (13%) filter, group by and aggregation on one column19x improvementcode_block[StructValue([(u’code’, u’select lo_shipmode, sum(lo_revenue) as revenuernfrom lineorderrnwhere lo_discount between 1 and 3 and lo_quantity < 25rngroup by lo_shipmode’), (u’language’, u”)])]Example 3: Get the total revenue from sales in a given year for which the discount and quantity were within a specific range; this query has a selective join (join selectivity = 14%) and the columnar engine uses a bloom filter to accelerate it. 8x improvementcode_block[StructValue([(u’code’, u’select sum(lo_revenue) as revenuernfrom lineorderrn left join date on lo_orderdate = d_datekeyrnwhere d_year = 1993 and lo_discount between 1 and 3rn and lo_quantity < 25′), (u’language’, u”)])]Example 4: Get the total revenue from sales in or before a given year for which the discount and quantity were within a specific range; this query has a much less selective join (join selectivity = 90%).2.6x improvementcode_block[StructValue([(u’code’, u’select sum(lo_revenue) as revenuernfrom lineorderrn left join date on lo_orderdate = d_datekeyrnwhere d_year <= 1997 and lo_discount between 1 and 3rn and lo_quantity < 25′), (u’language’, u”)])]We do not guarantee the same results illustrated by these examples because your results will be dependent on your data sets, database configurations and the queries that you run.Query plan exampleThe plan of a query executed using the columnar engine shows additional statistics that help identify various columnar optimizations that were invoked in order to make the query run faster. Key parts of the plan of example query 1:code_block[StructValue([(u’code’, u’Aggregate (cost=1006.43..1006.44 rows=1 width=8) (actual time=8.219..8.220 rows=1 loops=3)rn -> Parallel Append (cost=0.00..883.88 rows=49017 width=4) (actual time=0.221..8.208 rows=1 loops=3)rn -> Parallel Custom Scan (columnar scan) on lineorder (cost=20.00..879.88 rows=49016 width=4) (actual time=0.220..8.205 rows=36230 loops=3)rn Filter: ((lo_discount = 1) AND (lo_quantity = 1))rn Rows Removed by Columnar Filter: 19959121rn Rows Aggregated by Columnar Scan: 21216rn CU quals: ((lo_quantity = 1) AND (lo_discount = 1))rn Columnar cache search mode: nativern -> Parallel Seq Scan on lineorder (cost=0.00..4.01 rows=1 width=4) (never executed)rn Filter: ((lo_discount = 1) AND (lo_quantity = 1))’), (u’language’, u”)])]Understanding the query plan nodes:Custom Scan: This node is the Columnar Scan node that applies filters on the column store. It shows 19959121 rows removed by the Columnar Filter and 21216 rows aggregated by the columnar engine.Seq Scan: This node is the traditional Postgres row-store Sequential Scan node that is invoked only when the query planner decides to use hybrid execution mode, which it did not use in this case.Append: This node merges the results from Columnar Scan node (Custom Scan) and Row-store Sequential Scan node.ConclusionOur columnar engine enables analytical queries to run up to 100x faster than the traditional PostgreSQL engine based on our performance tests. This query processing technology enables you to run analytics and reporting directly against your operational database for real-time insights. Powered by ML-driven auto-population and management, the columnar engine automatically optimizes to your applications, completely transparently on each instance and with minimal management overhead, delivering fine-tuned performance with refreshing ease of use. To try AlloyDB out for yourself, visit cloud.google.com/alloydb.The AlloyDB technical innovations described in this and subsequent posts would not have been possible without the exceptional contributions of our engineering team.Related ArticleIntroducing AlloyDB for PostgreSQL: Free yourself from expensive, legacy databasesAlloyDB for PostgreSQL combines the best of Google with full PostgreSQL compatibility to achieve superior performance, availability, and …Read Article
Quelle: Google Cloud Platform

Introducing Network Analyzer: One stop shop to detect service and network issues

With networking at the foundation of all cloud deployments and business processes, proactively maintaining network health is mission-critical. The cloud is powerful and dynamic, but can sometimes feel complex, as customers often encounter network issues from unintentionally deploying suboptimal or error-prone configurations.  For example, organizations may deploy changes that unknowingly introduce misconfigurations, contradict best practices, exceed IP address utilization quotas, or suboptimally allocate unused external IPs.  To mitigate such network issues, teams often rely on reactive workflows – manually running time-consuming diagnostics to troubleshoot and resolve issues after a service disruption.  Google Cloud Networking developed a solution to prevent manual, time-intensive, reactive status quo – which is why we are excited to introduce Network Intelligence Center (NIC)’s  newest module: Network Analyzer.  With Network Analyzer, customers can transform reactive workflows into proactive processes and reduce network and service downtime. Network Analyzer empowers you by auto-detecting failures caused by the underlying network, surfacing  root cause analyses, and suggesting  best practices to improve the availability, performance, and security of services. Network Analyzer offers an out-of-the-box  suite of always-on analyzers that continuously monitor GCE and GKE network configuration. These analyzers run in the background, monitoring network services like load balancers, hybrid connectivity, and connectivity to Google services like Cloud SQL. As users continually push out config changes or the metrics for their deployment changes, the relevant analyzers will  automatically surface failure conditions or suboptimal configurations.Get automatic, proactive notification of service and network issuesNetwork Analyzer detects failures that can be caused by misconfigurations like setup errors or regressions caused by unintended changes. Customers can automatically detect if Google services like Cloud SQL are not reachable, or if network services like load balancing are not functioning as intended. Network Analyzer also detects the root cause for this failure, such as an invalid route or firewall rule blocking the service reachability.For example, Network Analyzer can detect:Connectivity issues to Google Services like Cloud SQL. This issue could be  due to an egress firewall rule or a routing issue. Common misconfigurations with load balancer health checks like firewall is not configured on the VPC network to allow health check probes used by the load balancer, or user-configured firewall rule is blocking the health check IP address rangeInvalid next hop of a route due to misconfigurations like stopped or deleted VM instance, VM instance with IP forwarding disabled, deleted Internal Load Balancer, deleted VPN tunnelDynamic routes shadowed by a subnet or static routes as a result of which the dynamic route is not effectiveGKE networking misconfigurations like connectivity between GKE nodes and their control plane is blocked by misconfigured firewall or routing issues.Improve availability and efficiency of your servicesNetwork Analyzer codifies Google Cloud’s best practice guidelines for improved availability and performance and helps you optimize usage of Google Cloud resources. It offers best practice recommendations that are relevant to your deployment.For example, Network Analyzer surfaces suggestions like:External IP address is reserved but not allocated to a resourceGKE cluster needs additional authorized network after expanding IP address rangeEnabling Private Google Access for a private GKE cluster’s subnet after the cluster has been createdPredict resource and capacity issuesNetwork Analyzer detects suboptimal configurations and capacity trends which may lead to network issues in the future. For example, it can detect high IP address utilization of a subnet, which can prevent automatically creating VMs or upgrading GKE clusters.Surfacing insights through Network AnalyzerNetwork Analyzer prioritizes and proactively surfaces insights to users at a project level or across multiple projects.It identifies the root cause of the surfaced insight and provides a link to the documentation with recommendations to fix the insight.You can refer to the complete list of analyzers here. We are continuously adding new analyzers to this module.Moving towards Proactive OperationsWe are excited to see customers use Network Intelligence Center’s Network Analyzer to adopt a more proactive, event-driven approach to network health and automatically detect and predict network and service issues. View insights for your organization in the Google Cloud Console. Learn more about Network Analyzer and view our complete list of analyzers in our documentationAnd as always, please feel free to reach out to the Network Intelligence Center team with your questions and feedback.Related ArticleIntroducing Media CDN—the modern extensible platform for delivering immersive experiencesWe’re excited to announce the general availability of Media CDN — a content and media distribution platform with unparalleled scale.Read Article
Quelle: Google Cloud Platform

Eliminate hotspots in Cloud Bigtable

We’ve recently improved Cloud Bigtable’s observability by allowing customers to monitor and observe hot tablets. We now provide customers access to real-time hot tablets data through the Cloud Bigtable Admin API and gcloud command-line tool. In this post, we’ll present how hot tablets observability can be used in real world use cases to help customers understand better design choices based on access patterns and provide insight into performance-related problems.What are hot tablets?A Cloud Bigtable table is sharded into blocks of contiguous rows, called tablets, to help balance the workload of queries. Each tablet is associated with a Bigtable node (or “tablet server” in the original Bigtable paper), and operations on the rows of the tablet are performed by this node. To optimize performance and scale, tablets are split and rebalanced across the nodes based on access patterns such as read, write, and scan operations.A hot tablet is a tablet that uses a disproportionately large percentage of a node’s CPU compared to other tablets associated with that node. This unbalanced usage can happen due to unanticipated high volume of requests to a particular data point, or uneven table modeling during the initial schema design. This imbalanced node usage can cause higher latencies and replication delays called “hotspots” or “hotspotting.” Unlike cluster-level CPU overutilization, which can often be mitigated by horizontally scaling the number of nodes, hotspotting may require other mitigation techniques, some of which are discussed in this blog.Use cases for hot tablets data1) Use Case: Identify HotspotsHot tablets can help to diagnose if elevated latencies are due to a large amount of traffic made to a narrow range of row keys. In this example, a customer observed that P99 latencies have been elevated for the past few hours by monitoring query latencies on the Bigtable Monitoring page in the Google Cloud Console:This might be attributed to CPU overutilization, which means that the workload exceeds the recommended usage limits of a cluster. Overutilization typically means that the cluster is under- provisioned, which can be resolved by manually adding more nodes to the cluster or by using autoscaling to automatically add nodes. To identify if this is the underlying issue, the customer looks at the CPU utilization of this cluster and sees that the average CPU utilization of the cluster is at a healthy ~60%, which is below the recommended limit of 70%. However, the hottest node is running at nearly ~100% CPU utilization; this large difference in CPU usage between the average and hottest node is a strong indication of hotspots.The customer wants to understand the root cause of the hotspots, and runs the gcloud hot-tablets list (or the Bigtable API method) to investigate further:code_block[StructValue([(u’code’, u’$ gcloud bigtable hot-tablets list my-cluster –instance=my-instancernNAME TABLE CPU_USAGE START_TIME END_TIME START_KEY END_KEYrntablet1 test-data 89.3 2021-12-14T01:19:57+00:00 2021-12-14T01:20:57+00:00 user432958 user433124rntablet2 test-data 22.8 2021-12-14T01:04:59+00:00 2021-12-14T01:06:59+00:00 user312932 user312932{$content}rntablet3 test-data 20.9 2021-12-14T01:18:56+00:00 2021-12-14T01:20:56+00:00 user592140 user592192 rntablet4 test-data 16.5 2021-12-14T01:18:56+00:00 2021-12-14T01:20:56+00:00 user491965 user492864′), (u’language’, u”)])]The hot tablets output confirms that there are hotspots, as there are three tablets with more than 20% CPU usage. In the output, CPU usage refers to the amount of CPU that a single node (tablet server) has used for a single tablet from start time to end time for reads and writes. Remember that a tablet server has tasks other than serving tablets, including:ReplicationRebalancingCompactionGarbage collectionLoading and unloading tabletsOther background tasks A tablet server can be responsible for hundreds or thousands of tablets, so spending more than 20% of CPU on a single tablet is a relatively large allocation.The hot tablets method also provides the start and end keys of the tablets; this information can be used to identify the source of the hotspots downstream. In the example above, the customer designed their schema so that the row key is the user ID (<user-id>). That is, all reads and writes for a single user ID are made to a single row. If that user sends requests in bursts or if there are multiple workloads, this row key design would likely be mismatched with access patterns, resulting in a high amount of read and writes to a narrow range of keys.To resolve the hotspot, the customer can opt to isolate or throttle traffic associated with the users that correspond to the row keys in tablet1 (from user432958 to user433124). In addition, the output shows that tablet2 is a tablet that contains only a single row from a start key of user312932 to an end key of user31293200, which is the smallest possible tablet size. Heavily writing/reading on a single row key will lead to a single-row tablet. To resolve this problem, the customer can opt to isolate or throttle traffic associated with user312932.The customer can also decide to redesign the row key so that table queries are more evenly spread across the row key space, allowing better load balancing and tablet splitting. Using user ID as the row key stores all user-related information in a single row. This is an anti-pattern that groups unrelated data together, and potentially causes multiple workflows to access the same row. Alternative row key designs to consider are <workload-type>:<user-id> or <workload-type>:<user-id>:<timestamp>.In summary, the customer decides to resolve the hotspots by either:Redesigning the row key schema, orIdentifying downstream user(s) or workload(s) to isolate or throttle2) Use Case: Identify short-lived CPU hotspots (<15 min)Burst CPU usage in a narrow key range can cause short-lived hotspots and elevated P99 latencies. This type of hotspot can be difficult to diagnose because Key Visualizer has a minimum granularity of 15 minutes, and may not display any hotspots that are ephemeral. While Key Visualizer is an excellent tool at identifying persistent and long-lived hotspots, it may not be able to identify more granular burst usage. In our example, a customer notices that there are spikes in P99 read latencies in the Bigtable monitoring page:The customer further debugs these latency spikes by looking at the CPU utilization of the hottest node of the cluster:The CPU utilization of the hottest node is less than the recommended limit of 90%, but there are spikes in the CPU utilization that correspond to the latency spikes. While this suggests that there are no long-lived hotspots, it could indicate ephemeral hotspots within a key range. The customer investigates this possibility by viewing the Key Visualizer Heatmap:The Key Visualizer heatmap doesn’t indicate any clear hotspotting key ranges, but Key Visualizer aggregates metrics into 15 min buckets. If hotspots did occur over the course of 5 minutes, this usage would be averaged across 15 minutes, and may not show up as a high usage in the heatmap. The new hot tablets method can help customers diagnose these short-lived hotspots with more granular key space and minute-level usage metrics. Running the hot tablets command in gcloud, the customer is able to identify hotspots that lasted for only 2 minutes, but correspond to one of the latency spikes:code_block[StructValue([(u’code’, u’$ gcloud bigtable hot-tablets list my-cluster –instance=my-instancernNAME TABLE CPU_USAGE START_TIME END_TIME START_KEY END_KEYrntablet1 test-data 45.7 2022-01-04T12:43:32+00:00 2022-01-04T12:45:32+00:00 user719304 user725103′), (u’language’, u”)])]It’s possible with the new hot tablets method to identify the key ranges and tablets that have high CPU usage during the P99 tail latencies. This finer-grained reporting can help customers make more informed application design choices and help improve latency and throughput performance.Similar to the previous use case, the customer can decide if the ephemeral hotspots are problematic enough to warrant a row key redesign or isolate the offending user(s) and/or workload(s).3) Use Case: Identify noisy tables in a multi-table clusterMany customers use a single cluster for multiple workflows and tables. While this option is a reasonable and recommended way to get started with Cloud Bigtable, multiple workflows could potentially interfere with each other. For example, a customer has two tables on a cluster: table-batch and table-serve. As their names suggest, table-batch contains data to process batch workflows and table-serve contains data to serve requests. While throughput is prioritized for the batch workflows, latency is critical for serving requests. The customer notices that there is high cluster CPU utilization and periodic latency spikes from 3 pm to 6 pm. The customer wants to know if the batch workflows are interfering with request serving and causing the elevated latencies. Running the hot tablets command for this time period:code_block[StructValue([(u’code’, u’$ gcloud bigtable hot-tablets list my-cluster –instance=my-instance –start-time=”2021-12-14 15:00:00″ –end-time=”2021-12-14 18:00:00″rnrnNAME TABLE CPU_USAGE START_TIME END_TIME START_KEY END_KEYrntablet53 table-batch 43.2 2021-12-14T16:01:27+00:00 2021-12-14T16:03:27+00:00 user505921 user523452rntablet20 table-batch 28.1 2021-12-14T15:54:21+00:00 2021-12-14T15:56:21+00:00 user402934 user403923rntablet41 table-batch 19.3 2021-12-14T17:22:46+00:00 2021-12-14T17:24:46+00:00 user105932 user105990 rntablet32 table-serve 17.7 2021-12-14T17:18:05+00:00 2021-12-14T17:20:05+00:00 user930218 user942049rntablet77 table-batch 17.2 2021-12-14T16:37:11+00:00 2021-12-14T16:39:11+00:00 user773476 user783174′), (u’language’, u”)])]From the results, the customer sees that most of the tablets that exhibited high CPU usage during this time period are from the table-batch table. The output helped discover independent workflows that interfere with each other in a multi-table cluster. By identifying the table that exhibits the largest hotspots, the customer can move table-batch to a separate cluster.Likewise, if there are multiple workflows on the same table, the customer can decide to set up replication to isolate the batch workflow. Another approach to understand the breakdown of CPU usage among different workflows is to use custom app profiles.SummaryWe’ve walked through a few use cases on how the hot tablets method can be used to identify and troubleshoot performance problems. This additional observability can help resolve hotspots and reduce latency. To try this on your own Google Cloud project, see documentation about how to use the hot tablets method with the Cloud Bigtable API and the gcloud command.Related ArticleGoogle Cloud and MongoDB Atlas expand their partnershipNew integrations with Google Cloud will simplify discoverability, subscription, onboarding, and management of MongoDB Atlas when running …Read Article
Quelle: Google Cloud Platform

Google is named a Leader in the 2022 Gartner® Magic Quadrant™for Cloud AI Developer Services report

Gartner® named Google as a Leader in the 2022 Magic Quadrant™ for Cloud AI Developer Services report. This evaluation covered Google’s language, vision and structured data products including AutoML, all of which we deliver through Google Cloud. We believe this recognition is a reflection of the confidence and satisfaction that customers have in our language, vision, and AutoML products for developers. Google remains a Leader for the third year in a row, based upon the completeness of our vision and our ability to execute.  Developers benefit in many ways by using Cloud AI services and solutions. Customers recognize the advantages of Google’s AI and ML services for developers, such as Vertex AI, BigQuery ML, AutoML and AI APIs. In addition, customers benefit from  the pace of progress in the field of Responsible AI and actionable ethics processes applied to all customer and partner solutions leveraging Google Cloud technology, as well as our core architecture including the Vertex AI platform, vision, conversational AI, language and structured data, and optimization services and key vertical industry solutions. We believe that our ‘Leader’ placement validates this vision for AI developer tools. Let’s take a closer look at some of the report findings.ML tools purpose-built for developersGoogle’s machine learning tools have been built by developers, for developers, based on the groundbreaking research generated from Google Research and DeepMind. This developer empathy drives product development, which supports the developer community to achieve deep value from Google’s AI and ML services. An example of this is the unification of all of the tools needed for building, deploying and managing ML models into one ML platform, Vertex AI, resulting in accelerated time to production. They also cite BigQuery ML, AutoML for language, vision video and tabular data) and prebuilt ML APIs (such as speech and translation) as having high utility for developers at all levels of ML expertise to build custom AI and quickly infuse AI into their applications. Leading organizations like OTOY, Allen Institute for AI and DeepMind (an Alphabet subsidiary) choose Google for ML, and enterprises like Twitter, Wayfair and The Home Depot shared more about their partnership with Google in their recent sessions at Google Next 2021.Responsible AI principles and practicesResponsible AI is a critical component of successful AI. A 2020 study commissioned by Google Cloud and the Economic Intelligence Unit highlighted that ethical AI does not only prevent organizations from making egregious mistakes, but that the value of responsible AI practices for competitive edge, as well as talent acquisition and retention are notable. At Google, we not only apply our ethics review process to first party platforms and solutions, to ensure that our services design-in responsible AI from the outset, we also consult with customers and partners based on AI principles to deliver accountability and avoid unfair biases. In addition, our best-in-class tools provide developers with the functionality  they need to evaluate fairness and biases in datasets and models. Our Explainable AI tools such as model cards provide model transparency in a structured, accessible way, and the What-If Tool is essential for developers and data scientists to evaluate, debug and improve their ML models. Clear and understandable product architectureGoogle Cloud’s investment in our ML product portfolio has led to a comprehensive, integrated and open offering that spans breadth (across vision, conversational AI, language and structured data, and optimization services) and depth (core AI services, with features such as Vertex AI Pipelines and Vertex Explainable AI built on top). Industry-specific solutions tailored by Google for retail, financial services, manufacturing, media and healthcare customers, such as Recommendations AI, Visual Inspection AI, Media Translation, Healthcare Data Engine, add another layer leveraging this foundational platform to help organizations and users adopt machine learning solutions more easily.        At Google Cloud, we refuse to make developers jump through hoops to derive value out of our technology; instead, we bring the value directly to them by ensuring that all of our AI and ML products and solutions work seamlessly together. To download the full report, click here. Get started on Vertex AI and talk with our sales team.Disclaimer:Gartner, Magic Quadrant for Cloud AI Developer Services, Van Baker, Arun Batchu, Erick Brethenoux, Svetlana Sicular, Mike Fang, May 23, 2022.Gartner and Magic Quadrant are registered trademarks of Gartner, Inc. and/or its affiliates in the U.S. and internationally and is used herein with permission. All rights reserved. Gartner does not endorse any vendor, product or service depicted in its research publications, and does not advise technology users to select only those vendors with the highest ratings or other designation. Gartner research publications consist of the opinions of Gartner’s research organization and should not be construed as statements of fact. Gartner disclaims all warranties, expressed or implied, with respect to this research, including any warranties of merchantability or fitness for a particular purpose.Related ArticleForrester names Google Cloud a leader in AI InfrastructureGoogle Cloud named a Leader in The Forrester Wave™: AI Infrastructure, Q4 2021 reportRead Article
Quelle: Google Cloud Platform

Cloud on Spain’s terms: New Google Cloud region in Madrid now open

We’re continuing to expand our global footprint — and we’re doing it rapidly. In 2020, we announced our plans to launch a new cloud region to help accelerate the economic recovery and growth of Spain. Today, we’re excited to announce that our new Google Cloud region in Madrid is officially open. Designed to help meet the growing technology needs of Spanish businesses, the new Madrid region (europe-southwest1) provides low-latency, highly available cloud services with high international security and data protection standards — all on the cleanest cloud in the industry. The new Madrid region joins our network of 33 regions throughout the globe, helping local Spanish businesses connect with users everywhere. You can join us at our region celebration on May 25 here. A cloud built for SpainGoogle Cloud’s global network of regions is the cornerstone of our cloud infrastructure, enabling us to deliver high-performance, low-latency, sustainable cloud-based services and products to support our customers across the globe.Built in partnership with Telefónica, the new Madrid region offers Google Cloud’s unique global infrastructure locally, creating new opportunities for digital transformation across various industries and making it easier for organizations at any stage of their cloud journey to securely deliver faster, more reliable customer experiences. Accelerating digital transformation also requires cloud services that meet regulatory compliance and digital governance requirements. In particular, highly regulated sectors like government, healthcare, and financial services need additional controls to store data and run workloads locally. “We welcome the Cloud capabilities that the Google Cloud region is bringing to Spain. It is especially important for the alignment with the security levels that public sector organizations demand and as required in the National Security Scheme. They must take advantage of a cloud that is offered locally with the highest security guarantees. The collaboration with hyperscalers is key. It is also essential to continue advancing with best practices adoption, training, security configurations and supervision” Luis Jimenez, Subdirector del Centro Criptológico NacionalHaving a new region in Madrid helps remove these barriers to cloud adoption, allowing both Spanish businesses and government entities to meet their availability, data residency, and sustainability needs in Spain while also accelerating their digital transformation. The Madrid region is launching with three cloud zones to prevent service interruptions, and our standard set of products, including Compute Engine, Google Kubernetes Engine, Cloud Storage, Persistent Disk, CloudSQL, and Cloud Identity. . Customers will also get access to smarter analytics capabilities, AI and ML solutions, and application modernization tools that allow them to unleash the full potential of cloud computing. At the same time, customers will benefit from controls that enable them to maintain the highest security, data residency, and compliance standards, especially those that deal with specific data storage requirements. “In DIA Group we have always been committed to seeking innovative solutions to improve our customers’ experience while respecting the trust they place on us every day. For this reason we have decided to rely on the new Google Cloud region in Madrid for some of our most critical workloads like our store operations (orders, inventory, product stock, etc). This will guarantee our customers a low-latency service while managing their data within the national borders, as well as optimized performance.” – Carlos Valero, Chief Information Officer, Grupo DIA”Offering our customers low-latency services while keeping workloads and data management safe, is vital for us. The availability of the new Google Cloud region in Madrid represents a great step forward that will allow us to achieve our goals and meet the expectations of our customers by offering them a premium user experience without neglecting data security and residency.” – Carmen Lopez Herranz, CTO, BBVAGoing beyond with a transformation cloudAt Google Cloud, we’re constantly working to help customers across various industries achieve what was once considered impossible, reinvent themselves, and transform the way they serve their customers using digital technology — all on the cleanest cloud in the industry.Our transformation cloud is helping businesses become: Smarter: Google Cloud lets you leverage data for deeper insights with a unified platform that makes it easy to get value from structured or unstructured data, regardless of where it resides. Open: Google Cloud’s commitment to multicloud, hybrid cloud, and open source provides the freedom to choose the right solutions, allowing developers to build and innovate faster, in any environment. Connected: Digital transformation isn’t just about technology — it’s about people and culture. In an era where work can happen anywhere, Google Cloud provides the tools needed to be more innovative, productive, and make faster decisions, together. Trusted: Google Cloud offers strong security capabilities and a zero-trust architecture to help protect data, applications, and infrastructure against potential threats. We also provide specific offerings and work closely with local partners to help address digital sovereignty requirements emerging from both customers and policymakers.In addition to the launch of our new Madrid cloud region, we’re making other commitments that will pave the way for new business innovations and development in Spain. TheGrace Hopper subsea cable landed in September 2021 in Bilbao, connecting Spain and the UK with the United States for increased performance and greater support using the same network that powers Google infrastructure and products. We’re also helping people develop new skills that will enable society to champion cloud technology and growth in the future. Google has already helped to train more than 1 million people with our Grow with Google program in Spain, and we have future plans to open a center of excellence for cybersecurity in Malaga and support the creation of theAI Lab Granada, in collaboration with Indra Minsait in the coming years. For more details about the Madrid region, head to our cloud locations page, where you’ll find updates on the availability of additional services and regions.Related ArticleThe new Google Cloud region in Columbus, Ohio is openGoogle Cloud’s Columbus, Ohio region is now open, bringing a second region to the midwest, for a total of 33 regions across the globe.Read Article
Quelle: Google Cloud Platform

Introducing high-performance Confidential Computing with N2D and C2D VMs

We’re excited to announce Confidential Computing on the latest Google Compute Engine N2D and C2D Virtual Machines. At Google Cloud, we’re constantly striving to deliver performance improvements and feature enhancements. Last November, we announced the general availability of general-purpose N2D machine types running on 3rd Gen AMD EPYC™ processors. Then, in February, we announced the general availability of compute-optimized C2D machine types running on the same 3rd gen processors. Today, we are excited to announce that both of these new N2D and C2D machine types now offer Confidential Computing. By default, Google Cloud keeps all data encrypted, in-transit between customers and our data centers, and at rest. We believe the future of computing will increasingly shift to private, encrypted services where users can be confident that their data is not being exposed to cloud providers or their own insiders. Confidential Computing helps make this future possible by keeping data encrypted in memory, and elsewhere outside the CPU, while it is being processed – all without needing any code changes to applications.General Purpose Confidential VMs on N2DThe first product in Google Cloud’s Confidential Computing portfolio was Confidential VM. A Confidential VM is a type of Compute Engine VM that helps ensure that your data and applications stay private and encrypted even while in use.Today, Confidential VMs are available in Preview on general-purpose N2D machine types powered by 3rd Gen AMD EPYC processors. We worked closely with the AMD Cloud Solution engineering team to help ensure that the VM’s memory encryption doesn’t interfere with workload performance. N2D VMs are a great option for both general-purpose workloads and workloads that require larger VM sizes and memory ratios. General-purpose workloads that require a balance of compute and memory, like web applications and databases, can benefit from N2D’s performance, price, and wide array of features. Compute-Optimized Confidential VMs on C2DWe’re also optimizing Confidential Computing for more types of workloads. Today, Confidential VMs are also available in Preview on compute-optimized C2D machine types. C2D instances provide the largest VM sizes within the compute-optimized VM family and are optimized for memory-bound workloads such as high-performance databases and high-performance computing (HPC) workloads. Adding the compute-optimized machine family to our Confidential Computing portfolio gives you the ability to optimize performance-intensive workloads while maintaining confidentiality and can expand which of your workloads can easily switch to be confidential. Early FindingsYellowDog, a cloud workload management company, is an early user of the new Confidential VMs in the C2D VM family.“At YellowDog, we believe there should be no barriers to adopting secure cloud computing. YellowDog tested workloads across tens of thousands of cores using the new Google C2D VMs running on 3rd Gen AMD EPYC processors.We were truly impressed to discover that the Confidential VMs’ provisioning times were fantastic and the C2D VMs ran with no discernible difference in performance when enabling and disabling Confidential Computing,” said Simon Ponsford, CTO at YellowDog. “We at YellowDog recommend that anyone running secure workloads in Google Cloud enable the Confidential Computing feature by default.”Expanding Confidential Computing availabilityWe are expanding the availability of Confidential Computing, and Confidential VMs are now available in more regions and zones than before, anywhere N2D or C2D machines are available. Confidential N2D VMs and Confidential C2D VMs are available today in regions around the globe including us-central1 (Iowa), asia-southeast1 (Singapore), us-east1 (South Carolina), us-east4 (North Virginia), asia-east1 (Taiwan), and europe-west4 (Netherlands). The underpinnings of Confidential VMsConfidential N2D and C2D VMs with 3rd Gen AMD EPYC processors utilize AMD Secure Encrypted Virtualization (SEV). With the AMD SEV feature, Confidential VMs offer high performance for demanding computational tasks, while keeping VM memory encrypted with a dedicated per-VM instance key that is generated and managed by the processor. These keys are generated by the processor during VM creation and reside solely within it, making them unavailable to Google or other VMs running on the host. We’re currently supporting SEV on 3rd Gen AMD EPYC processors but will bring more advanced capabilities in the future.PricingConfidential N2D and C2D VMs with 3rd Gen AMD EPYC processors are offered at the same price as the previous generation Confidential N2D VMs. You can also take advantage of cost savings with spot pricing. To learn more, visit Confidential VM pricing. Ongoing Confidential Computing InvestmentToday’s announcement comes off the heels of the review that the Google Cloud Security team, Google Project Zero, and the AMD firmware and product security teams collaborated on of the technology and firmware that powers AMD Confidential Computing technology. Google Cloud and AMD are committed to securing sensitive workloads and shaping future Confidential Computing innovations. Getting StartedUpgrading your existing Confidential N2D VMs to use 3rd Gen AMD EPYC processors is easy. If you already use Confidential N2D machines or are just getting started, you can use the latest hardware by simply selecting “AMD Milan or later” as the CPU platform.To create a Confidential C2D VM, choose the C2D option when creating a new VM and check the box under “Confidential VM service” in the Google Cloud Console.With Confidential Computing, you can protect your data and run your most sensitive applications and services on N2D and C2D VMs.Related ArticleN2D VMs with latest AMD EPYC CPUs enable on average over 30% better price-performanceCompute Engine N2D VMs with 3rd Generation AMD EPYC processors deliver, on average, over 30% better price-performance compared to prior g…Read Article
Quelle: Google Cloud Platform

How Google Cloud monitors its Quality Management System

As a provider of software and services for global enterprises, Google Cloud understands that the quality and security of products is instrumental in maintaining trust among our customers. We are committed to providing products and services that help our customers meet their quality management objectives, ultimately helping organizations to meet their regulatory and customer requirements. At the heart of this commitment is our robust quality management system (QMS), a process-based approach that aims to achieve high standards of quality in all stages of the product or service lifecycle and which leverages our ISO 9001:2015 certification.In our new Quality Management System paper, we share the quality management principles and practices we follow that help us establish a defined and consistent process to continually monitor, manage, and improve the quality of our products and services. As with ISO 9001, Google Cloud’s QMS is predicated on seven quality management principles. These principles include: Customer focus: Through feedback collected from our customers, we have noted that they value security, speed, reliability, and productivity. At Google, we believe this is achieved by following defined practices for effective software development processes and customer communications. Therefore, Google focuses on Systems Development Lifecycle (SDLC) and Cloud Platform Support (CPS) as key components of our QMS.Leadership: Google’s quality policy is the foundation of its quality management program and is managed by Google’s Vice President of Security Engineering. The policy commits to controlling and maintaining the quality of Google Cloud products and related software development processes, limiting Google’s exposure to the risks arising from product quality issues, promoting continual improvement, and maintaining compliance with customer, legal and regulatory requirements.Engaging with people: We believe that for an effective and efficient QMS, it is important to involve people with diverse perspectives and different backgrounds, including our customers and our employees, and to respect and support them as individuals through recognition, empowerment, and learning opportunities. Google involves them from the first stage of the QMS context setting by gathering their requirements and feedback. Process approach: Google Cloud’s QMS uses the Plan-Do-Check-Act (PDCA) approach to process planning. We have defined four key process groups to achieve our quality management objectives, which are: Leadership and planning processes, Operational processes for software design and development, Evaluation and monitoring processes, and Improvement processes. By managing the inputs, activities, controls, outputs, and interfaces of these processes, we can establish and maintain system effectiveness.Improvement: Our proactive approach to quality management can help improve quality and expand business opportunities, enabling entire organizations to optimize operations and enhance performance. Evidence-based decision making: To help align our QMS with our business strategy, we collate and analyze pertinent information from internal and external sources to determine the potential impact on our context and subsequent strategy. Relationship management: Google directly conducts the data processing activities that are behind providing our services. However, we may engage some third-party suppliers to provide services related to customer and technical support. In such cases, our vendor onboarding processes (which includes consideration of the vendor’s requirements of Google) can facilitate streamlined supply chain integration.In a highly competitive, rapidly changing, and increasingly regulated environment, where quality is an integral part of top management agenda, Google holds its products and services to the highest standards of quality, enabling customers to transform their business through quality and become the quality leaders of tomorrow. You can learn more about Google Cloud’s quality management system by downloading the whitepaper.Related ArticleAnnouncing PSP’s cryptographic hardware offload at scale is now open sourceWe’re making the PSP Security Protocol for offloading encryption to network interface cards open source today. Here’s why.Read Article
Quelle: Google Cloud Platform