No more normal? No problem when you build supply chains with data and AI

What if, after all the upheavals and innovations of the past two years, we’re not headed for some new normal but instead an era of no more normal?“There are big, big challenges that need to be solved every single day by supply chain professionals,” Hans Thalbauer, Google Cloud’s managing director for supply chain and logistics, pointed out during our recent Supply Chain & Logistics Spotlight event. Among the issues Thalbauer ticked off were changes from the pandemic, consumer demand, labor shortages, the climate crisis, geopolitical instability, and energy shortages.“And the thing is, it’s not just a short term issue, we think it’s a long-term and systemic issue,” Thielbauer said. “There’s a big question out there, which is: How will global trade change? Is it really transforming and translating into something new? Will global trade continue to work as is?”Even experts at the White House are asking these very questions at this very time. The same day as the Supply Chain & Logistics Spotlight, the president’s Council of Economic Advisors released their annual report with an entire chapter dedicated to supply chain. In it, they noted that once-obscure, and ideally invisible, supply chains had “entered dinner table conversations.” And for good reason. “Because of outsourcing, offshoring, and insufficient investment in resilience, many supply chains have become complex and fragile,” the economists wrote. Nor are they alone in worrying about the future of logistics.Whatever the outcomes—more global or local, more automated or disintermediated, more agile or fragile—one of the likeliest results is a greater reliance on technology, and especially data, to help handle all the disruptions and interruptions on the horizon. Leaders in the field, including at The Home Depot, Paack, and Seara Foods, are discovering opportunities in a few key areas: connecting data from end to end; the power of platforms to access and share information; and the importance of predictive analytics to mitigate issues as, or even before, they arise.“We need to create visibility, flexibility, and innovation,” Thalbauer said. “Too often companies just focus on their orders, forecasts, and inventory, but typically they ignore the rest of the world. We need to bring in the public information, the traffic, weather, climate, and financial risks, connect that with the enterprise data, and we need to actually enable community data to create collaboration between business partners at every tier.”End-to-end dataCompanies have always sought visibility from the factory to the warehouse to the store and now the front door, and all the points in between. Both the challenge and necessity of seeing into all these is that as the data has grown, and our capabilities along with it, so has the complexity. It’s at a scale no humans can manage, which makes the importance not only of data but analytics and AI all the more essential.Home Depot has had a front row seat to these growing interdependencies—especially when it comes to serving competing yet complimentary clienteles. The pandemic presented its share of unexpected opportunities, as the combination of soaring home values, disposable income, and DIYers looking for (stay at) home projects led to runs on everything from lumber to sheds-turned-offices to garage doors. Empty shelves can lead to angry customers. And in this case, it wasn’t just homeowners and renters Home Depot was contending with, explained Chris Smith, vice president of IT Supply Chain at Home Depot, but also an increasingly important base of contractors and even large-scale developers. Both tended to need different materials, at different scales, and shopped in different ways, and these demands have only expanded during the pandemic.Whatever the future of logistics look like—more global or local, more automated or disintermediated, more agile or fragile—one of the likeliest results is a greater reliance on technology.“We really have what we call an omnichannel algorithm.” Chris Smith, VP of IT Supply Chain at The Home Depot. “It’s really marrying up the customer’s preferences with our understanding of capacity, assortment, inventory availability, taking all that together, and saying: How do we best meet the customer promise and do it with the most efficient use of our supply chain? So where do we fulfill it from, where is the inventory available, and how do we do that in a way that’s most economical for us while still meeting the promise of the customer,” Smith said. Paack, a last-mile delivery start-up serving the UK, Spain, France, Portugal, and Italy, is similarly pushing the envelope on fulfillment. The company focuses on combining a wealth of data—from drivers, customers, sensors, weather, and more—to ensure guaranteed delivery. So far, their success rate is approaching 98% of on-time delivery, with special scheduling tools to ensure customers are available to receive their packages.Using solutions like the Last Mile Fleet Solution from Google Maps Platform, Paack can manage drivers and customers in real-time.“The granularity of information we can collect in terms of which routes are being effectively followed by the driver’s route versus planned routes, the ability for them to change directions, because we might know locally of better ways to go, notifications from the customer as to their availability—these really allows us to build a better experience for everyone,” Olivier Colinet, chief product and technology officer for Paack, said. “We want first-time drivers to be the most productive drivers, and this first step allows us to do so.”Power of platformsPaack’s success exemplifies the power of building a strong platform for customers and workers, as well as tapping existing platforms, like Google Maps, to bolster your own.On the other side of the globe, the world’s largest meat supplier is seeking to empower thousands of ranchers and farmers with a platform of their own. Seara, a Brazil-based supplier of pork, chicken and eggs that is part of the globe-spanning JBS conglomerate, launched its SuperAgroTech platform in July 2021. Though in development for years, the program could hardly have come at a more critical time for the global food supply. The food industry was already coping with pandemic-related shortages and shutdowns, and then came the spillover effects from the war in Ukraine.“In general, the entire supply chain was affected and the operation had to adapt to new working conditions,” Thiago Acconcia, the director of innovation and strategy at Seara, said. “So in the farms, in the field, the same situations are repeated, and the creation of this digital online platform enters as a facilitator when it gives autonomy to the farmer, providing them with the data input and digital communication.” It’s a level of connectivity the farmers never had with Seara before—and vice versa.The technology has been deployed to more than 9,000 farms at launch. Through a range of IoT sensors, monitoring devices, and data inputs from farmers, operators and Seara data, teams can track a host of results. These include yields, animal health, profits, and even environmental and social impacts, which are becoming increasingly important features for consumers.The eventual goal is to reach 100% digital management of the farm.“So today, we are able to activate any producer in a few seconds, regardless of the location,” Acconcia said. With SuperAgroTech, the platform “doesn’t mind if it’s in the very south of the country, if it’s in the central part. It’s strengthening the relationships with our producers and also promoting a level of personalized attention they’ve never had.”Such platforms also provide a level of visibility and connectivity rarely enjoyed before, as well as a virtuous cycle between data collection, analysis, and insights put back into action on the platform. In an unpredictable world, this kind of integration is becoming essential.Stacks of containersPredictive AnalyticsAs a company’s digital strategies evolve through integrated data and robust platforms, one of the most exciting opportunities arises around predictive analytics.While seeing into the future remains science fiction (at least for now), AI, cloud, and even emerging quantum computing are providing robust ways to better reveal trends, make connections, and anticipate both opportunities and interruptions.Home Depot has looked at ways to quickly adapt its digital stores using consumer data and AI to create better experiences, as well as smoothing out supply chain issues. Home Depot’s Chris Smith pointed to a listing for an out-of-stock appliance or tool, for example, that will quickly offer other locations or items for sale as a convenient alternative.“We can apply machine learning in many different ways to make better, faster decisions, both in how we support moving inventory through our supply chain or how we understand available capacity to support our customers,” Smith said. “And with automation, from our distribution centers to our forecasting and replenishment systems, we’re going to continue to look at places where we can optimize and automate to make better decisions.”For Paack, predictions could come in the form of traffic or storms or even the likelihood that a repeat customer will be available or not, without having to prompt them.And at Seara, the role of data and analytics is not just vital to the business but the very vitality of the world. As climate, supply chains, global conflicts, migration, and other issues continue to constrain the food supply, anticipating issues could be the difference between salvaging a crop or not. “We started creating advanced analytics by means of AI tools to not only notify real-time problems but also to predict what’s going to happen in the near and long future,” Acconcia said. “We are talking about the world’s food, and SuperAgroTech has the role to feed the world, and to overcome these biggest challenges.”
Quelle: Google Cloud Platform

Introducing granular instance sizing for Cloud Spanner, now run production workloads for as low as $40/month

Cloud Spanner is a relational database service that offers industry leading 99.999% availability, and near unlimited scale to handle even the most demanding of workloads. For these reasons, customers in various industries trust Spanner for their workloads with significant throughput requirements. We have heard from our customers that they would like to standardize on Spanner for all their workloads – big and small as they value the manageability,  scale-insurance, and consistent performance that Spanner offers.Therefore, last year we launched granular instance sizing in preview so that you can run your workloads on Spanner starting at approximately $65/month. Today, we are excited to announce the general availability of granular instance sizing. With granular instance sizing, at a much lower cost you can still get all of the Spanner benefits like transparent replication across zones and regions, high-availability, resilience to different types of failures, and the ability to scale up and down as needed without any downtime. And with Committed Use Discounts,  the entry price for production workload further reduces to less than $40/month as you receive a 40% discount for a 3-year commitment. How granular instances workWith granular instance sizing, we are introducing a new unit for provisioning resources in Spanner – “Processing Units (PUs)” in addition to “Nodes”. One Spanner node is equal to 1,000 PUs; so you can start with a 100 PUs instance and provision in batches of 100 PUs, and get a proportional amount of compute and storage resources. All Spanner instances including the instances with less than 1,000 PUs or 1 node have the same availability SLA of 99.99% for regional instances and 99.999% for multi-regional instances. You can use this feature to cost-effectively run workloads of all sizes on Spanner and scale seamlessly as needed. With granular instance sizing you get proportional resources for proportional price, for example, a 100 PUs Spanner instance can support a maximum of 10 databases with up to ~410 GB of data storage. The limit for number of databases per Spanner instance scales proportionally with the provisioned compute capacity in the instance to a maximum of 100 databases per instance. Additionally, a Spanner instance can store unlimited data as long as sufficient compute capacity is provisioned in the instance as there is a limit of 4TB of data per 1,000 PUs (1 node).You can easily use granular instance sizing by selecting the instance configuration, Processing Units (PUs) as the unit of compute capacity and then providing their quantity. The summary on the right side of the console-page displays the per-hour compute cost based on the number of Processing Units; it also lists the maximum storage which is available for the instance.Making Spanner more accessible for every developer and workload Our mission is to democratize access to Spanner so that developers can easily get started with a familiar interface and low entry cost, and seamlessly scale their workloads without downtime.  In addition to reducing the cost of entry for production workloads with granular instance sizing, we also recently introduced Committed Use Discounts (CUDs)for you. With CUDs, you make hourly spend based usage commitments for a year or longer for Spanner compute capacity and get discounted prices for it. Spend based commitment offers maximum flexibility as the discount is automatically applied on compute capacity of instances in any instance-configuration (regional or multi-regional) across projects. You can reduce your costs by purchasing either a one-year CUD that provides a 20% discount or a three-year CUD that provides a 40% discount. So if a three-year committed-use-discount of 40% is applied to a 100 PUs regional Spanner instance for example in us-central1, your monthly bill will be less than $40/month. We also announced the preview of the PostgreSQL interface for Spanner at Google Cloud Next ‘21. With this capability, you can build transformative applications with Spanner while using the familiar PostgreSQL dialect. You can leverage the core subset of capabilities that PostgreSQL offers with the scale, consistency and high-availability of Spanner. We will soon be announcing the General Availability of the PostgreSQL interface of Spanner. With granular instance sizing, CUDs and PostgreSQL interface for Spanner our goal is to address the popular demand from developers to make the best in class experience on Spanner more accessible and cost effective. For example, a two-person game development startup developed their first game on a 100 PUs Spanner instance that they plan to launch soon. This gaming startup aspires their gaming title to have the same success as PokemonGo (also built on Spanner) and when it does, they won”t have to worry about re-architecting their database because Spanner offers them seamless scaling to support their millions of users.Learn moreWe invite you to build your applications on Spanner and scale as your business grows.  To get started with Spanner, create an instanceor try it out with a Spanner QwiklabRelated ArticleEliminate hotspots in Cloud BigtableLearn how hotspots can impact the performance of your Cloud Bigtable database. Debugging hot tablets can reduce P99 latencies and increas…Read Article
Quelle: Google Cloud Platform

Change streams for Cloud Spanner: now generally available

At this year’s Google Data Cloud Summit, we announced Cloud Spanner change streams. Today, we are thrilled to announce the general availability of change streams. With change streams, Spanner users are now able to track and stream out changes (inserts, updates, and deletes) from their Cloud Spanner database in near real-time.Change streams provides a wide range of options to integrate change data with other Google Cloud services. Common use cases include:Analytics: Send change events to BigQuery to ensure that BigQuery has the most recent data available for analytics.  Event triggering: Send data change events to Pub/Sub for further processing by downstream systems. Compliance: Save the change events in Google Cloud Storage for archiving purposes. Getting started with change streamsThis section walks you through a simple example of creating a change stream, reading its data, and sending the data to BigQuery for analytics.If you haven’t already done so, get yourself familiar with Cloud Spanner basics with the Spanner Qwiklab.Creating a change streamSpanner change streams are created with DDL, similar to creating tables and indexes. Change stream DDL requires the same IAM permission as any other schema change (spanner.databases.updateDdl).A change stream can track changes on a set of columns, a set of tables, or an entire database. Each change stream can have a retention period of anywhere from one day to seven days, and you can set up multiple change streams to track exactly what you need for your specific objectives.  Learn more about creating and managing change streams.Suppose you have a table Orders like this:code_block[StructValue([(u’code’, u’CREATE TABLE Orders (rn OrderID INT64 NOT NULL,rn CustomerID INT64 NOT NULL,rn ProductId INT64 NOT NULL,rn OrderDate DATE,rn Price INT64,rn) PRIMARY KEY(OrderID);’), (u’language’, u”)])]The DDL to create a change stream that tracks the entire Orders table with a (implicit) default retention of 1 day would be defined as:code_block[StructValue([(u’code’, u’CREATE CHANGE STREAM OrdersStream FOR Orders;’), (u’language’, u”)])]Creating change streams is a long running operation. You can check the progress on the change streams page in the Cloud console:Once created, you can click on the change stream name to view more details:Your database DDL should look something like:Now that the change stream has been created, you can process the change stream data.Streaming data to BigQueryThere are several ways to process change stream data. The easiest way is to use the Spanner connector for Apache Beam which allows you to build scalable data processing pipelines for Google Cloud Dataflow. We provide Dataflow templates for processing and writing change data to BigQuery or Google Cloud Storage respectively. Learn more about how Cloud Spanner change streams work with Dataflow.In this example, we will use the Spanner change streams to BigQuery template to write change stream data to BigQuery. First, navigate to your project’s Dataflow Jobs page in the Google Cloud Console. Click on CREATE JOB FROM TEMPLATE, choose the Change streams to BigQuery template, then fill in the required fields:Click RUN JOB, and wait for Dataflow to build the pipeline and launch the job. Once your Dataflow pipeline is running, you can view the job graph, execution details, and metrics on the Dataflow Jobs page:Now let’s write some data into the tracked table Orders:Under the hood, when Spanner detects a data change in a data set tracked by a change stream, it writes a data change record synchronously with that data change, within the same transaction. Spanner co-locates both of these writes so they are processed by the same server, minimizing write processing. Learn more about how Spanner writes and stores change streams.Finally, when you view your BigQuery dataset, you will see the row that you just inserted, with some additional information from the change stream records.You are all set! As long as your Dataflow pipeline is running, the data changes to the tracked tables will be seamlessly streamed to your BigQuery dataset. Learn more about monitoring your pipeline.More ways to process change stream dataInstead of using the Google-provided Dataflow templates for BigQuery and Google Cloud Storage, you can choose to build a custom Dataflow pipeline to process change data with Apache Beam. For this case, we provide the SpannerIO Dataflow connector that outputs change data as an Apache Beam PCollection of DataChangeRecord objects. This is  a great choice if you want to define your own data transforms, or want a different sink than BigQuery or Google Cloud Storage. Learn more about how to create custom Dataflow pipelines that consume and forward change stream data. Alternatively, you can process change streams with the Spanner API. This approach, which is particularly well-suited for more latency-sensitive applications, does not rely on Dataflow. The Spanner API is a powerful interface that lets you read directly from a change stream to implement your own connector and stream changes to the pipeline of your choice. With the Spanner API, a change stream is divided into multiple partitions, each of which can be used to query a change stream in parallel for higher throughput. Spanner dynamically creates these partitions based on load and size. Each partition is associated with a Spanner database split, allowing change streams to scale as effortlessly as the rest of Spanner. Learn more about using the change stream query API.What’s nextSpanner change streams is available to all customers today at no additional cost –  you’ll pay only for any extra compute and storage of the change stream data at the regular Spanner rates. Since change streams are built right into Spanner, there’s no software to install, and you get external consistency, industry-leading availability, and effortless scale with the rest of the database. Start exploring change streams from the change stream overview today!Related ArticleBoost the power of your transactional data with Cloud Spanner change streamsChange streams track changes in your Spanner database and integrate this data with other systems for analytics, event triggering, and com…Read Article
Quelle: Google Cloud Platform

Application Rationalization through Google Cloud’s CAMP Framework

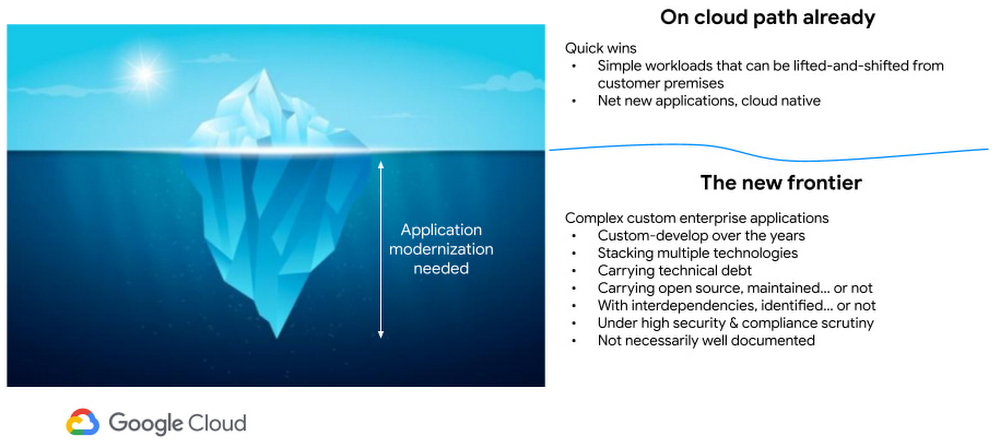
On April 6th, 2022, Google Cloud established a new partnership with CAST, to help accelerate the migration and application modernization programs of customers worldwide, complementing the Google capabilities already available through the Google Cloud Application Modernization Program (CAMP).Application Rationalization (App Rat) is the first step towards a cloud adoption or migration journey, through which you go over the application inventory to determine which applications should be Retired, Retained, Refactored, Replatformed, or Reimagined.Why is this important to you?Have the majority of your in-house applications still not moved to the cloud? How much time does your development team spend on support (bug fix, tickets, etc.) versus feature(s) development? Have Infrastructure/Platform dependencies ever delayed product rollout? Would an auto-scalable, managed cloud, increase stakeholder buy-in? Can Google simplify this journey?Google Cloud Application Modernization Program (CAMP) has been designed as an end-to-end framework to help guide organizations through their modernization journey by assessing where they are today, and provide a path forward. When it comes to App Rationalization, this depends on what your role is. Step 1 (Assess): Who is the target audience? The Platform team (or) the Application team?This determines what kind of challenges we are trying to solve. For e.g. the centralized platform team wants to set some guardrails on how the App teams deploy their apps. Streamlining this would allow the platform team to mature themselves into the SRE territory. The application team, on the other hand, loves flexibility, and the ability to perform Continuous Delivery.These examples are only the tip of the iceberg. Most of the enterprise customers have a majority of their applications in the legacy world. Unless we move those business critical applications to the cloud, it’s impossible to mature as an enterprise. For more information, check State of DevOps 2021 report.Step 2 (Analyze): Google Cloud offers the tooling and the framework to analyze your legacy applications.Platform Owner (persona), usually have very little information on which workloads are a good fit for modernization. Google’s StratoZone® SaaS platform provides customers with a data-driven cloud decision framework. The StratoProbe® Data Collector Application delivers the ability to easily deploy and scale the discovery of a customer’s IT environment for Private, Public, or Hybrid-cloud planning. To ease and accelerate the VM migration journey, Google Cloud offers assistance and guidance in making the right decisions when deciding to go to cloud.Google’s mFit aims at unblocking customers in their transformation by providing workload selection for successful on-boarding, at scale, to Anthos, GKE and Cloud Run , in both pre-sales (e.g. proof-of-concept/proof-of-value) and post-sales (e.g. pilot and at scale execution) scenarios.App and/or Business Owners (persona), get involved in a 1-week workshop, using CAST Highlight, which would provide rapid portfolio assessment through automated source code analysis for Cloud Readiness, Open Source risks, Resiliency, and Agility.Step 3 (Plan & execute): Each organization is different. Some may follow the “Migration Factory” approach, and some may follow “Modernization Factory”, and some may follow both. Irrespective of which approach you choose to follow, it is important to plan just enough, so that you can start your execution. Ensure to set the OKRs, that would help with the right measurements, before you start the execution. The actual learning from the execution helps the team(s) to learn more about the cloud migration process, and refine it based on their organization.Using CAST Highlight in the assessment step previously, we get the recommendation for the analyzed applications. From there, for certain workloads, we can use Migrate to Containers, to automate the containerization of suitable workloads. However, there are certain applications that require manual code changes. You have a few options for that,Our experts can help you get started. Our partners can help youStep 4 (Measure & reiterate): Measure the progress using the predefined metrics in the previous step. Celebrate the wins. Consistently share the learnings and best practices with the developer community. Pick the next challengeTake the next stepTell us what you’re solving for. A Google Cloud expert will help you find the best solution.Related ArticleGoogle Cloud Application Modernization Program: Get to the future fasterThe Google Cloud App Modernization Program (CAMP) can help you accelerate your modernization process and adopt DevOps best practicesRead Article
Quelle: Google Cloud Platform

Why IT leaders choose Google Cloud certification for their teams

As organizations worldwide move to the cloud, it’s become increasingly crucial to provide teams with confidence and the right skills to get the most out of cloud technology. With demand for cloud expertise exceeding the supply of talent, many businesses are looking for new, cost-effective ways to keep up.When ongoing skills gaps stifle productivity, it can cost you money. In Global Knowledge’s 2021 report, 42% of IT decision-makers reported having “difficulty meeting quality objectives” as a result of skills gaps, and, in an IDC survey cited in the same Global Knowledge report, roughly 60% of organizations described a lack of skills as a cause for lost revenue. In today’s fast-paced environment, businesses with cloud knowledge are in a stronger position to achieve more. So what more could you be doing to develop and showcase cloud expertise in your organization?Google Cloud certification helps validate your teams’ technical capabilities, while demonstrating your organization’s commitment to the fast pace of the cloud.What certification offers that experience doesn’t is peace of mind. I’m not only talking about self-confidence, but also for our customers. Having us certified, working on their projects, really gives them peace of mind that they’re working with a partner who knows what they’re doing. Niels Buekers, managing director at Fourcast BVBAWhy get your team Google Cloud certified?When you invest in cloud, you also want to invest in your people. Google Cloud certification equips your teams with the skills they need to fulfill your growing business. Speed up technology implementation Organizations want to speed up transformation and make the most of their cloud investment.Nearly 70% of partner organizations recognize that certifications speed up technology implementation and lead to greater staff productivity, according to a May 2021 IDC Software Partner Survey. The same report also found that 85% of partner IT consultants agree that “certification represents validation of extensive product and process knowledge.”Improve client satisfaction and successGetting your teams certified can be the first step to improving client satisfaction and success. Research of more than 600 IT consultants and resellers in a September 2021 IDC study found that “fully certified teams met 95% of their clients’ objectives, compared to a 36% lower average net promoter score for partially certified teams.”Motivate your team and retain talentIn today’s age of the ongoing Great Resignation, IT leaders are rightly concerned about employee attrition, which can result in stalled projects, unmet business objectives, and new or overextended team members needing time to ramp up. In other words, attrition hurts.But when IT leaders invest in skills development for their teams, talent tends to stick around. According to a business value paper from IDC, comprehensive training leads to 133% greater employee retention compared to untrained teams. When organizations help people develop skills, people stay longer, morale improves, and productivity increases. Organizations wind up with a classic win-win situation as business value accelerates. Finish your projects ahead of scheduleWith your employees feeling supported and well equipped to handle workloads, they can also stay engaged and innovate faster with Google Cloud certifications. “Fully certified teams are 35% more likely than partially certified teams to finish projects ahead of schedule, typically reaching their targets more than two weeks early,” according to research in an IDC InfoBrief.Certify your teamsGoogle Cloud certification is more than a seal of approval – it can be your framework to increase staff tenure, improve productivity, satisfy your customers, and obtain other key advantages to launch your organization into the future. Once you get your teams certified, they’ll join a trusted network of IT professionals in the Google Cloud certified community, with access to resources and continuous  learning opportunities.To discover more about the value of certification for your team, download the IDC paper today and invite your teams to join our upcoming webinar and get started on their certification journey.Related ArticleHow to become a certified cloud professionalHow to become a certified cloud professionalRead Article
Quelle: Google Cloud Platform

Built with BigQuery: Gain instant access to comprehensive B2B data in BigQuery with ZoomInfo

Editor’s note: The post is part of a series highlighting our partners, and their solutions, that are Built with BigQuery.To fully leverage the data that’s critical for modern businesses, it must be accurate, complete, and up to date. Since 2007, ZoomInfo has provided B2B teams with the accurate firmographic, technographic, contact, and intent data they need to hit their marketing, sales, and revenue targets. While smart-analytics teams have used ZoomInfo data sets in Google BigQuery to integrate them with other sources to deliver reliable and actionable insights powered by machine learning, Google Cloud and ZoomInfo recently have partnered to give organizations even richer data sets and more powerful analytics tools. Today, customers now have instant access to ZoomInfo data and intelligence directly within Google BigQuery. ZoomInfo is available as a virtual view in BigQuery, so analysts can explore the data there even before importing it. Once ZoomInfo data has been imported into BigQuery, data and operations teams will be able to use it in their workflows quickly and easily, saving their sales and marketing teams time, money, and resources. ZoomInfo data sets include: Contact and company. Capture essential prospect and customer data — from verified email addresses and direct-dial business phone and mobile numbers, to job responsibilities and web mentions. Get B2B company insights, including organizational charts, employee and revenue growth rates, and look-alike companies.Technographics and scoops. Uncover the technologies that prospects use — and how they use them — to inform your marketing and sales efforts. Discover trends to shape the right outreach messaging and determine a buyer’s needs before making the first touch. Buyer intent. ZoomInfo’s buyer intent engine captures real-time buying signals from companies researching relevant topics and keywords related to your business solution across the web.Website IP traffic. Enrich data around traffic from your digital properties, so your customer-facing teams can take immediate action and turn traffic into sales opportunities.In the future, ZoomInfo data sets will be available in the Google Cloud Marketplace as well as Google Cloud Analytics Hub (now in preview) alongside popular Google and third-party data sets including Google Trends, Google Analytics, and Census Bureau data. The new features will help ZoomInfo and Google Cloud customers such as Wayfair Professional, one of the world’s largest home retailers. Wayfair Professional is a long-time user of ZoomInfo’s Company Data Brick, API, and enrichment services. Wayfair Professional has historically accessed ZoomInfo data through file transfer, which involved shuffling encrypted CSVs back and forth over SFTP and manual file processing to ingest it into Google BigQuery. Ryan Sigurdson, senior analytics manager at Wayfair Professional, shared that moving their monthly offline company enrichment workflow to BigQuery could save them weeks of manual work and maintenance every month. Built with BigQueryZoomInfo is one of over 700 tech companies powering their products and businesses using data cloud products from Google, such as BigQuery, Looker, Spanner, and Vertex AI. Recently at the Data Cloud Summit, Google Cloud announced Built with BigQuery, which helps ISVs like ZoomInfo get started building applications using data and machine learning products. By providing dedicated access to technology, expertise, and go to market programs, this initiative can help tech companies to accelerate, optimize, and amplify their success.ZoomInfo’s SaaS solutions have been built on Google Cloud for years. By partnering with Google Cloud, ZoomInfo can leverage an all-in-one cloud platform to develop its data collection, data processing, data storage, and data analytics solutions. “Enabling customers to gain superior insights and intelligence from data is core to the ZoomInfo strategy. We are excited about the innovation Google Cloud is bringing to market and how it is creating a differentiated ecosystem that allows customers to gain insights from their data securely, at scale, and without having to move data around,” says Henry Schuck, ZoomInfo’s chief executive officer. “Working with the Built with BigQuery team enables us to rapidly gain deep insight into the opportunities available and accelerate our speed to market.”Google Cloud provides a platform for building data-driven applications like ZoomInfo, from simplified data ingestion, processing, and storage to powerful analytics, AI/ML, and data sharing capabilities, all integrated with the open, secure, and sustainable Google Cloud platform. With a diverse partner ecosystem and support for multicloud, open source tools, and APIs, Google Cloud provides technology companies the portability and extensibility they need to avoid data lock-in. To learn more about ZoomInfo on Google Cloud, visit https://www.zoominfo.com/offers/google-bigquery.To learn more about Built with BigQuery, visit https://cloud.google.com/solutions/data-cloud-isvsRelated ArticleGet value from data quickly with Informatica Data Loader for BigQueryWith Informatica’s Data Loader on Google Cloud, accelerate data uploads and keep data flowing to get insights and answers faster.Read Article
Quelle: Google Cloud Platform

Take the 2022 Accelerate State of DevOps Survey

The State of DevOps report by Google Cloud and the DORA research team is the largest and longest running research of its kind with inputs from over 32,000 professionals worldwide. It provides an independent view into the practices and capabilities that organizations, irrespective of their size, industry, and region, can employ to drive better performance.  Today, Google Cloud and the DORA research team are excited to announce the launch of the 2022 State of DevOps survey. For the 2022 State of DevOps report we will be focusing on a topic that has been top of mind recently: security. As technology teams continue to accelerate and evolve, so do the quantity and sophistication of security threats. Security can no longer be an afterthought or the final step before delivery, it must be integrated throughout the software development process. Shift LeftThe industry must shift from reactive practices to proactive and diagnostic measures, where software teams should assume that their systems are already compromised and build security into their supply chain. In the 2021 State of DevOps report we found that elite performers who met or exceeded their reliability targets were twice as likely to have shifted their security practices left, i.e., implemented security practices earlier on in the software development lifecycle, and deliver reliable software quickly, and safely. Not only that, but teams who integrate security best practices throughout their development process are 1.6 times more likely to meet or exceed their organizational goals.But how do companies know where to start when it comes to getting security right? In last year’s report we found that companies can integrate security, improve software delivery and operational performance, and improve organizational performance by leveraging the following practices:2022 State of DevOps SurveyLike the past six research reports, our goal this year is to perform detailed analysis to help teams benchmark their performance against the industry and provide strategies that teams can employ to improve their performance. For the first time in last year’s report, high and elite performers make up two-thirds of respondents. We can confidently say that as the industry continues to accelerate its adoption of DevOps principles teams see meaningful benefits as a result.This year we are doing a deeper investigation into how security practices and capabilities predict overall software delivery and operations performance. Achieving elite performance is a team endeavor and diverse, inclusive teams drive the best performance. The research program benefits from the participation of a diverse group of people. Please help us encourage more voices by sharing this survey with your network, especially with your colleagues from underrepresented parts of our industry. This survey is for everyone. No matter where you are on your DevOps journey, the size of your organization, your organization’s industry, or how you identify. There are no right or wrong answers, in fact we often hear feedback that questions in the survey prompt ideas for improvement.  The survey will remain open until midnight PDT on July 22, 2022. We look forward to hearing from you and your teams!Related Article2021 Accelerate State of DevOps report addresses burnout, team performanceThe SODR is continually one of the most downloaded assets on the GCP website. We are releasing the updated version of the report with new…Read Article
Quelle: Google Cloud Platform
Enterprise DevOps Guidebook – Chapter 1

The Google Cloud DORA team has been hard at work releasing our yearly Accelerate State of DevOps report. This research provides an independent view into the practices and capabilities that organizations, irrespective of their size, industry, and region, can employ to drive better performance. Year over year, the State of DevOpsreport helps organizations benchmark themselves against others in the industry as elite, high, medium, or low performers and provides recommendations for how organizations can continually improve. The table below highlights elite, high, medium, and low performers at a glance from the last report.To give more prescriptive advice on how to successfully implement DORA best practices with Google Cloud, we are excited to announce the DevOps Enterprise Guidebook. The guidebook will be your resource providing a concrete action plan for implementing recommendations using Google Cloud’s DORA research to initiate performance improvements.We will release the guidebook in chapter increments. The goal of this first chapter is to give your organization a better understanding of how to use DORA’s resources to measure your performance and to begin your first DevOps team experiment. Some resources include the DevOps Quick check, where you can measure your teams’ software delivery performance in less than a minute with just five multiple choice questions, or a more indepthcapabilities assessment, an assessment we deploy in your organization that gives us a robust measurement of your organization’s capabilities as they pertain to software delivery.Future chapters will touch on other main topics we have identified in the State of DevOps reports such as shifting left on security, cloud adoption, and easy to use DevOps tools. We want to make it easy for your organization to get the most out of investing in DevOps and with the launch of the guidebook we believe the focused recommendations will help more organizations successfully implement DevOps practices that will lead to business and organizational success.2022 State of DevOps SurveyFor the 2022 State of DevOps report we will be focusing on a topic that has been top of mind recently: security. This year we are doing a deeper investigation into how security practices and capabilities predict overall software delivery and operations performance. We invite you to join the over 32,000 professionals worldwide who have participated in the DORA reports by completing our 2022 State of DevOps survey.The survey will remain open until midnight PDT on July 22, 2022. Please help us encourage more voices by sharing this survey with your network, especially with your colleagues from underrepresented parts of our industry. We look forward to hearing from you and your teams!Related Article2021 Accelerate State of DevOps report addresses burnout, team performanceThe SODR is continually one of the most downloaded assets on the GCP website. We are releasing the updated version of the report with new…Read Article
Quelle: Google Cloud Platform

Discover our new edge concepts at Hannover Messe that bring smart factories to life

The typical smart factory is said to produce around 5 petabytes of data per week. That’s equivalent to 5 million gigabytes, or roughly 20,000 smartphones.Managing such vast amounts of data in one facility, let alone a global organization, would be challenging enough. Doing so on the factory floor, in near-real-time, to drive insights, enhancements, and particularly safety, is a big dream for leading manufacturers. And for many, it’s becoming a reality, thanks to the possibilities unlocked with edge computing.Edge computing brings computation, connectivity, and data closer to where the information is generated, enabling better data control, faster insights, and actions. Taking advantage of edge computing requires the hardware and software to collect, process, and analyze data locally to enable better decisions and improve operations. At Hannover Messe 2022, Intel and Google Cloud will demonstrate a new technology implementation that combines the latest generation of Intel processors with Google Cloud’s data and AI expertise to optimize production operations from edge to cloud. This proof-of-concept project is powered by the Edge Insights for Industrial platform (EII), an industry-specific platform from Intel; and a pair of Google Cloud solutions: Anthos, Google Cloud’s managed applications platform, and the newly-launched Manufacturing Data Engine.Edge computing exploits the untapped gold mine of data sitting on-site and is expected to grow rapidly. The Linux Foundation’s “2021 State of the Edge” predicts that by 2025, edge-related devices will produce roughly 90 zettabytes of data. Edge computing can help provide greater data privacy and security, and can accomodate the reduced bandwidth needs between local storage and the cloud.Imagine a world in which the power of big data and AI-driven data analytics is available at the point where the data is gathered to inform, make, and implement decisions in near real-time.This could be anywhere on the factory floor, from a welding station to a painting operation or more. Data would be collected by monitoring robotic welders, for example, and analyzed by industrial PCs (IPCs) located at the factory edge. These edge IPCs would detect when the welders are starting to go off spec, predicting increased defect rates even before they appear, and adding preventive maintenance to correct the errors without any direct intervention. Real time, predictive analytics using AI could substantially prevent defects before they happen. Or the same IPCs could use digital cameras for visual inspection to monitor and identify defects in real-time, allowing them to be addressed quickly.Edge computing has powerful potential applications in assisting with data gathering, processing, storage and analysis in many manufacturing sectors, including automotive, semiconductor and electronics manufacturing, and consumer packaged goods. Whether modeling and analysis is done and stored locally or in the cloud, or is predictive, simultaneous, or lagged, technology providers are aligning to meet these needs. This is the new world of edge computing. The joint Intel and Google Cloud proof of concept aims to extend the Google Cloud capabilities and solutions to the edge. Intel’s full breadth of industrial solutions, hardware and software, are coming together in this edge-ready solution, encompassing Google Cloud industry-leading tools. The concept shortens the time to insights, streamlining data analytics and AI at the edge.Intel’s Edge Insight for Industrial and FIDO Device Onboarding (FDO) at the edge running Google Anthos on Intel® NUCs.The Intel-Google Cloud proof of concept demonstrates how manufacturers can gather and analyze data from over 250 factory devices using Manufacturing Connect from Google Cloud, providing a powerful platform to run data ingestion and AI analytics at the edge. In this demonstration in Hannover, Intel and Google Cloud show how manufacturers can capture time-series data from robotic welders to inspect welding quality and show how predictive analytics can benefit the factory operators. In addition, the video and image data is captured from a factory camera to show how visual inspection can highlight anomalies on plastic chips with model scoring. The demo also features zero-touch device onboarding using FIDO Device Onboard (FDO) to illustrate the ease with which additional computers could be added to the existing Anthos cluster.By combining Google Cloud’s expertise in data, AI/ML and Intel’s Edge Insight’s for Industrial platform that was optimized to run on Google Anthos, manufacturers can run and manage their containerized applications at the edge, in on-premise data center, or in public clouds using an efficient and secure connection to the Manufacturing Data Engine from Google Cloud. It forges a complete edge-to-cloud solution.Simplified device onboarding is available using Fido Device Onboard (FDO)—an open IoT protocol that brings fast, secure, and scalable zero-touch onboarding of new IoT devices to the edge. FDO allows factories to easily deploy automation and intelligence in their environment without introducing complexity into their OT infrastructure.The Intel-Google Cloud implementation can analyze that data using localized Intel or third-party AI and machine learning algorithms.  Applications can be layered on the Intel hardware and Anthos ecosystem, allowing customized data monitoring and ingestion, data management and storage, modeling, and analytics. This joint PoC facilitates and support improved decision making and operations, whether automated or triggered by the engineers on the front lines. Intel collaborates with a vibrant ecosystem of leading hardware partners to develop solutions for the industrial market by using the latest generation of Intel processors.  These processors can run data intensive workloads at the edge with ease.Intel Industrial PC Ecosystem PartnersPutting data and AI directly into the hands of manufacturing engineers can improve quality inspection loops,  customer satisfaction, and ultimately the bottom line. The new manufacturing solutions will be demonstrated in person for the first time at Hannover Messe 2022, May 30–June 2, 2022. Visit us at Stand E68, Hall 004, or schedule a meeting for an onsite demonstration with our experts.Related ArticleIntroducing new Google Cloud manufacturing solutions: smart factories, smarter workersGoogle Cloud Manufacturing Solutions Announcement.Read Article
Quelle: Google Cloud Platform

Monitoring transaction ID utilization using Cloud SQL for PostgreSQL metrics

PostgreSQL uses transaction IDs (also called TXIDs or XIDs) to implement Multi-Version Concurrency Control semantics (MVCC). The PostgreSQL documentation explains the role of XIDs as follows:PostgreSQL’s MVCC transaction semantics depend on being able to compare transaction ID (XID) numbers: a row version with an insertion XID greater than the current transaction’s XID is “in the future” and should not be visible to the current transaction. But since transaction IDs have limited size (32 bits), a cluster that runs for a long time would suffer transaction ID wraparound: the XID counter wraps around to zero, and all of a sudden transactions that were in the past appear to be in the future – which means their output becomes invisible. In short, catastrophic data loss. (…) The maximum time that a table can go unvacuumed is two billion transactions (…). If it were to go unvacuumed for longer than that, data loss could result.To prevent transaction ID wraparound, PostgreSQL uses a vacuum mechanism, which operates as a background task called autovacuum (enabled by default), or it can be run manually using the VACUUM command. A vacuum operation freezes committed transaction IDs and releases them for further use. You can think of this mechanism as “recycling” of transaction IDs that keeps the database operating despite using a finite number to store the transaction ID. Vacuum can sometimes be blocked due to workload patterns, or it can become too slow to keep up with database activity. If transaction ID utilization continues to grow despite the freezing performed by autovacuum or manual vacuum, the database will eventually refuse to accept new commands to protect itself against TXID wraparound. To help you monitor your database and ensure that this doesn’t happen, Cloud SQL for PostgreSQL introduced three new metrics:transaction_id_utilizationtransaction_id_countoldest_transaction_ageUnderstanding the transaction metricsGuidance provided in this section applies to PostgreSQL databases running with default vacuum settings. You might observe different TXID utilization patterns if your database is deliberately configured to delay vacuum operations e.g. for performance reasons.Recommendations regarding the detection and mitigation of TXID utilization issues should apply to all databases regardless of configuration.Transaction ID utilization and countA transaction ID is assigned when the transaction starts, and it is frozen when the transaction is vacuumed. With that, TXID utilization is the number of unvacuumed transactions  (“assigned” minus “frozen”) expressed as a fraction of the 2-billion maximum.Under the default PostgreSQL settings, with vacuum processes performing optimally and without interruption, most databases experience TXID utilization in the region of ~10%. Higher utilization levels can be observed in busy databases where vacuum frequently yields to regular workloads. If the utilization trends towards very high values (80% or more), the database might be at risk of TXID exhaustion unless vacuum is allowed to make quicker progress.Cloud SQL provides two metrics to describe TXID usage:database/postgresql/transaction_id_utilization records the number of unvacuumed transactions as a fraction of the 2-billion maximum. You can use this metric for monitoring or alerting to ensure that the database isn’t experiencing a shortage of transaction IDs.database/postgresql/transaction_id_count records the number of TXIDs assigned and frozen. You can use this metric to learn more about your TXID allocation and vacuum patterns e.g. how many TXIDs are allocated each second/minute/hour during peak load.ExampleThe chart below shows the transaction_id_count metric with a ~200 million difference between the “assigned” and “frozen” TXID. This might seem like a large number, but it’s only ~10% of the 2-billion maximum, and the pattern remains stable with no sign of long-term divergence. This is a happy database!On the other hand, the chart below shows a database that continues to allocate TXIDs to new transactions, but doesn’t appear to be freezing any TXIDs. This indicates that the vacuum is blocked. The difference between “assigned” and “frozen” XIDs has already grown to ~1 billion (~50% of maximum), and this database could run out of transaction IDs if the situation persists.Here is the transaction_id_utilization metric for the same database:Oldest transaction agePostgreSQL can only vacuum committed transactions. This means that old (long-running) uncommitted transactions will block vacuum, which may eventually lead to TXID exhaustion.The database/postgresql/vacuum/oldest_transaction_age metric tracks the age of the oldest uncommitted transaction in the PostgreSQL instance, measured in the number of transactions that started since the oldest transaction.There’s no single recommended value or threshold for this metric, but you can use it to gain additional insight in your workload, and determine whether transaction age may contribute to a vacuum backlog.ExampleAssume that the oldest transaction age is 50 million, which means that vacuum won’t be able to process the 50 million transactions that started after the oldest one. The value itself is neither good nor bad: 50 million transactions might be a lot on a database that’s mostly idle, or it might be just over an hour’s worth of workload on a busy server that runs 13k transitions per second. The metric value does indicate the presence of a long-running transaction, but a backlog of 50 million TXIDs is a very small portion of the 2-billion maximum, so the transaction doesn’t create a high risk of TXID exhaustion. You could optimize the transaction for performance and efficiency reasons, but there’s no immediate reason for concern regarding vacuum.However, what if the oldest transaction age is 1.5 billion? It not only indicates that a transaction has been running for a very long time, but the transaction also prevents vacuum from freezing 75% of the total TXID range. This situation warrants a closer investigation, because the transaction has a major impact on vacuum, and might push the database towards TXID exhaustion.Working with metricsYou can interact with the transaction metrics through the familiar Cloud SQL tools and features:Use Metrics Explorer to view and chart the metrics.Access the metrics programmatically with the Cloud Monitoring API.Use dashboards for convenient manual monitoring.Create alerting policies for automated notifications on the key metrics.This section provides examples using the transaction_id_utilization metric. You can follow similar steps for the other metrics.Charting transaction ID utilization in Metrics ExplorerFollow these instructions to chart transaction_id_utilization using Metrics Explorer. Note that Metrics Explorer displays the values as a percentage between 0% and 100%, but the underlying metric is a number on the scale of 0.0 to 1.0. When accessing the metric programmatically, you can calculate percentages by multiplying the raw value by 100%.To  chart the transaction ID utilization metric, do the following:In the Cloud Console, select Monitoring. You can also use this direct link: Go to MonitoringIn the navigation menu on the left, Metrics Explorer.Select the Explorer tab, and the Configuration dialog. They might be pre-selected by default.Under the “Resource & Metric” section, expand the Select a metric drop-down menu.Choose the Transaction ID utilization metric under “Cloud SQL Database” resource,  “Database” category. You’ll be able to find the metric more easily after typing “transaction” into the search box:You should now see the transaction ID utilization metric for all the instances in the project:Optionally, you can add a filter to see the metric for a specific instance instead of all instances:Under the “Filters” section, click Add Filter. A filter form will appear.In the Label field, select database_id.In the Comparison field, select (= equals).Type your instance name in the Value field.Confirm by clicking Done.The filtered chart should now contain only one line depicting transaction ID utilization for a single instance:As a useful exercise, you can view this metric for a number of your instances and try to explain any spikes or trends using your knowledge about the instance’s workload patterns.Creating an alerting policy on transaction ID utilizationAs explained previously, if the transaction id utilization reaches 100%, the database would no longer allow write operations to protect itself against XID wraparound. It’s therefore important to monitor the transaction ID utilization metric on mission-critical PostgreSQL databases.You can create an alerting policy to receive an automatic notification if the metric breaches a pre-configured threshold. A well-chosen threshold should serve two purposes:Indicate that the database is experiencing unusual workload patterns, even if TXID wraparound is not imminent.If the database is indeed trending towards XID wraparound, give you enough time to remedy the situation. The following example shows how to create an alert on transaction ID utilization for the threshold value of 70%, which may be appropriate for most databases.To create an alerting policy, do the following:In the Cloud Console, select Monitoring. You can also use this direct link: Go to MonitoringIn the navigation menu on the left, select Alerting.Click Create Policy near the top of the page, which will take you to the Create alerting policy dialog.In the Select a metric drop-down menu, find the Transaction ID utilization metric.Leave settings under Transform data unchanged for this demonstration. You can learn more about data transformations here.Optionally, you can add filters to set up the alarm on selected instances instead of all instances.Click the Next button at the bottom of the page, which will take you to the Configure alert trigger dialog.Use the following settings:Condition type: Threshold.Alert trigger: Any time series violates.Threshold position: Above threshold.Threshold value: 70 (or a different value of your choice).Optionally, provide a custom name for the condition under Advanced Options e.g. “Transaction ID Utilization High”.Click the Next button at the bottom of the page, which will take you to the Configure notifications and finalize alert dialog.Select your notification channel. If there are no notification channels to choose from, follow steps here to configure a notification channel.Give the alert an easily recognizable name e.g. “Transaction ID Utilization crossed 70%”. Optionally, provide additional notes or documentation that will help you react to a notification.Click the Create policy button at the bottom of the page.When the alert triggers, you will receive a notification similar to this:If none of your instances are currently experiencing TXID utilization high enough to trigger the notification, you can temporarily use a lower threshold for test purposes.ConclusionIn this blog post, we demonstrated how you can explore and interpret transaction ID utilization metrics on your database instances using Cloud SQL for PostgreSQL. We also learned how to create an alert policy for transaction ID utilization on a Cloud SQL instance.Related ArticleMigrate databases to Google Cloud VMware Engine (GCVE)Processes and tools used to migrate databases to Google Cloud VMware Engine (GCVE).Read Article
Quelle: Google Cloud Platform