Learn how BI Engine enhances BigQuery query performance

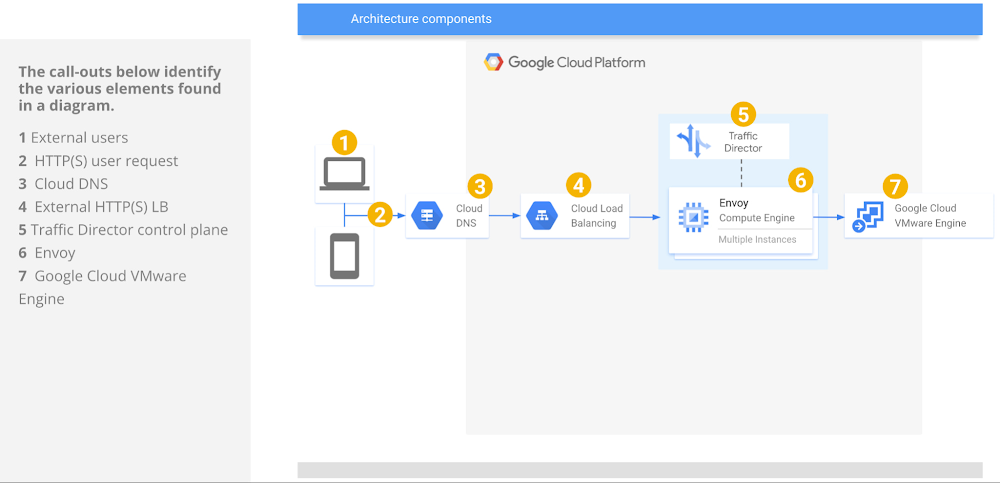
BigQuery BI Engine is a fast, in-memory analysis service that lets users analyze data stored in BigQuery with rapid response times and with high concurrency to accelerate certain BigQuery SQL queries. BI Engine caches data instead of query results, allowing different queries over the same data to be accelerated as you look at different aspects of the data. By using BI Engine with BigQuery streaming, you can perform real-time data analysis over streaming data without sacrificing write speeds or data freshness.​​BI Engine architectureThe BI Engine SQL interface expands BI Engine support to any business intelligence (BI) tool that works with BigQuery such as Looker, Tableau, Power BI, and custom applications to accelerate data exploration and analysis. With BI Engine, you can build rich, interactive dashboards and reports in BI tool of your choice without compromising performance, scale,security, or data freshness. To learn more about the BI Engine SQL interface, please refer here.The following diagram shows the updated architecture for BI Engine:Shown here is one simple example of a Looker dashboard that was created with BI Engine capacity reservation (top) versus the same dashboard without any reservation (bottom).This dashboard is created from the BigQuery public dataset `bigquery-public-data.chicago_taxi_trips.taxi_trips`  to analyze the Sum of total_trip cost and logarithmic average of total trip cost over time.total_trip cost for past 5 yearsBI Engine will cache the minimum amount of data possible to resolve a query to maximize the capacity of the reservation. Running business intelligence on big data can be tricky.Here is a query against the same public dataset, ‘bigquery-public-data.chicago_taxi_trips.taxi_trips,’ to demonstrate BI Engine performance with/without reserved BigQuery slots.Example Querycode_block[StructValue([(u’code’, u”SELECTrn (DATE(trip_end_timestamp , ‘America/Chicago’)) AS trip_end_timestamp_date,rn (DATE(trip_start_timestamp , ‘America/Chicago’)) AS trip_start_timestamp_date,rn COALESCE(SUM(CAST(trip_total AS FLOAT64)), 0) AS sum_trip_total,rn CONCAT (‘Hour :’,(DATETIME_DIFF(trip_end_timestamp,trip_start_timestamp,DAY) * 1440) ,’ , ‘,’Day :’,(DATETIME_DIFF(trip_end_timestamp,trip_start_timestamp,DAY)) ) AS trip_time,rn CASE WHENrn ROUND(fare + tips + tolls + extras) = trip_total THEN ‘Tallied’rn WHEN ROUND(fare + tips + tolls + extras) < trip_total THEN ‘Tallied Less’rn WHEN ROUND(fare + tips + tolls + extras) > trip_total THEN ‘Tallied More’rn WHEN (ROUND(fare + tips + tolls + extras) = 0.0 AND trip_total = 0.0) THEN ‘Tallied 0’rn ELSE ‘N/A’ END AS trip_total_tally,rn REGEXP_REPLACE(TRIM(company),’null’,’N/A’) as company,rn CASE WHENrn TRIM(payment_type) = ‘Unknown’ THEN ‘N/A’rn WHEN payment_type IS NULL THEN ‘N/A’ ELSE payment_type END AS payment_typern FROMrn `bigquery-public-data.chicago_taxi_trips.taxi_trips`rn GROUP BYrn 1,rn 2,rn 4,rn 5,rn 6,rn 7rnORDER BYrn 1 DESC,rn 2 ,rn 4 DESC,rn 5 ,rn 6 ,rn 7rnLIMIT 5000″), (u’language’, u”), (u’caption’, <wagtail.wagtailcore.rich_text.RichText object at 0x3ee1a4db3b10>)])]The above query was run with the below combinations: Without any BigQuery slot reservation/BI Engine reservation,  the query observed 7.6X more average slots and 6.3X more job run time compared to the run with reservations (last stats in the result). Without BI Engine reservation but with BigQuery slot reservation, the query observed 6.9X more average slots and 5.9X more job run time compared to the run with reservations (last stats in the result). With BI Engine reservation and no BigQuery slot reservation, the query observed 1.5 more average slots and the job completed in sub-seconds (868 ms). With both BI Engine reservation and BigQuery slot reservation, only 23 average slots were used and the job completed in sub-second as shown in results.This is the most cost effective way in regards to average slots and run time compared to all other options (23.27 avg_slots , 855 ms run time).INFORMATION_SCHEMA is a series of views that provide access to metadata about datasets, routines, tables, views, jobs, reservations, and streaming data. You can query the INFORMATION_SCHEMA.JOBS_BY_* view to retrieve real-time metadata about BigQuery jobs. This view contains currently running jobs, and the history of jobs completed in the past 180 days.Query to determine bi_engine_statistics and number of slots. More schema information can be found here.code_block[StructValue([(u’code’, u”SELECTrn project_id,rn job_id,rn reservation_id,rn job_type,rn TIMESTAMP_DIFF(end_time, creation_time, MILLISECOND) AS job_duration_mseconds,rn CASErn WHEN job_id = ‘bquxjob_54033cc8_18164d54ada’ THEN ‘YES_BQ_RESERV_NO_BIENGINE’rn WHEN job_id = ‘bquxjob_202f17eb_18149bb47c3′ THEN ‘NO_BQ_RESERV_NO_BIENGINE’rn WHEN job_id = ‘bquxjob_404f2321_18164e0f801′ THEN ‘YES_BQ_RESERV_YES_BIENGINE’rnWHEN job_id = ‘bquxjob_48c8910d_18164e520ac’ THEN ‘NO_BQ_RESERV_YES_BIENGINE’ ELSE ‘NA’ END as query_method,rn bi_engine_statistics,rn — Average slot utilization per job is calculated by dividingrn– total_slot_ms by the millisecond duration of the jobrn SAFE_DIVIDE(total_slot_ms,(TIMESTAMP_DIFF(end_time, start_time, MILLISECOND))) AS avg_slotsrnFROMrnregion-us.INFORMATION_SCHEMA.JOBS_BY_PROJECTrnwhere creation_time BETWEEN TIMESTAMP_SUB(CURRENT_TIMESTAMP(), INTERVAL 80 DAY) AND CURRENT_TIMESTAMP()rnAND end_time BETWEEN TIMESTAMP_SUB(CURRENT_TIMESTAMP(), INTERVAL 7 DAY) AND CURRENT_TIMESTAMP()rnANd job_id in (‘bquxjob_202f17eb_18149bb47c3′,’bquxjob_54033cc8_18164d54ada’,’bquxjob_404f2321_18164e0f801′,’bquxjob_48c8910d_18164e520ac’)rnORDER BY avg_slots DESC”), (u’language’, u”), (u’caption’, <wagtail.wagtailcore.rich_text.RichText object at 0x3ee18b949590>)])]From the observation, the most effective way of improving performance  for BI queries is to use BI ENGINE reservation along with BigQuery slot reservation.This will increase query performance, throughput and also utilizes less number of slots. Reserving BI Engine capacity will let you save on slots in your projects.BigQuery BI Engine optimizes the standard SQL functions and operators when connecting business intelligence (BI) tools to BigQuery. Optimized SQL functions and operators for BI Engine are found here.Monitor BI Engine with Cloud MonitoringBigQuery BI Engine integrates with Cloud Monitoring so you can monitor BI Engine metrics and configure alerts.For information on using Monitoring to create charts for your BI Engine metrics, see Creating charts in the Monitoring documentation.We ran the same query without BI engine reservation and noticed 15.47 GB were processed.After BI Engine capacity reservation, in Monitoring under BIE Reservation Used Bytes dashboard we got a compression ratio of ~11.74x (15.47 GB / 1.317 MB). However compression is very data dependent, primarily compression depends on the data cardinality. Customers should run tests on their data to determine their compression rate.Monitoring metrics ‘Reservation Total Bytes’ gives information about the BI engine capacity reservation whereas ‘Reservation Used Bytes’ gives information about the total used_bytes. Customers can make use of these 2 metrics to come up with the right capacity for reservation. When a project has BI engine capacity reserved, queries running in BigQuery will use BI engine to accelerate the compatible subquery performance.​​The degree of acceleration of the query falls into one of the below mentioned modes:BI Engine Mode FULL – BI Engine compute was used to accelerate leaf stages of the query but the data needed may be in memory or may need to be scanned from a disk. Even when BI Engine compute is utilized, BQ slots may also be used for parts of the query. The more complex the query,the more slots are used.This mode executes all leaf stages in BI Engine (and sometimes all stages).BI Engine Mode PARTIAL – BI Engine accelerates compatible subqueries and BigQuery processes the subqueries that are not compatible with BI Engine.This mode also provides bi-engine-reason for not using BI Engine mode fully.This mode executes some leaf stages in BI Engine and rest in BigQuery.BI Engine Mode DISABLED – When BI Engine process subqueries that are not compatible for acceleration, all leaf stages will get processed in BigQuery. This mode also provides bi-engine-reason for not using BI Engine mode fully/partially.Note that when you purchase a flat rate reservation, BI Engine capacity (GB) will be provided as part of the monthly flat-rate price. You can get up to 100 GB of BI Engine capacity included for free with a 2000-slot annual commitment. As BI Engine reduces the number of slots processed for BI queries, purchasing less slots by topping up little BI Engine capacity along with freely offered capacity might suffice your requirement instead of going in for more slots!Referencesbi-engine-introbi-engine-reserve-capacity streaming-apibi-engine-sql-interface-overview bi-engine-pricing bi-engine-sql-interface-overview To learn more about how BI Engine and BigQuery can help your enterprise, try out listed Quickstarts page bi-engine-data-studiobi-engine-looker Bi-engine-tableauRelated ArticleIntroducing Firehose: An open source tool from Gojek for seamless data ingestion to BigQuery and Cloud StorageThe Firehose open source tool allows Gojek to turbocharge the rate it streams its data into BigQuery and Cloud Storage.Read Article
Quelle: Google Cloud Platform

Forrester names Google Cloud a leader in Document Analytics Platforms

At Google, our mission is to organize the world’s information and make it universally accessible and useful. For our Document AI solutions suite, as well as the Vertex AI platform atop which Document AI is built, achieving this goal involves building capabilities to extract structured data from unstructured sources. Since launching Document AI in late 2020, we’ve tailored this technology to many of the most common and complex workflow challenges that enterprises face when dealing with unstructured data. Watching customers adopt these solutions has been gratifying, and today, we’re thrilled to share that leading global research and advisory firm Forrester Research has named Google Cloud as a Leader in two recently published reports: The Forrester Wave™: Document-Oriented Text Analytics Platforms, Q2 2022 and The Forrester Wave™: People-Oriented Text Analytics Platforms, Q2 2022 authored by Boris Evelson. The Forrester Wave™ serves as an important guide for buyers considering technology options and is based on Forrester’s objective analysis and opinion.Our Document AI suite of offerings is helping enterprises large and small automate data capture at scale to improve the speed of doing business and reduce document processing costs. In addition to our general processors for Document OCR (Optical Character Recognition), which allow you to identify and extract text from documents in over 200 languages for printed text and 50 languages for handwritten text, we’ve also invested in specialized parsers for procurement, contracts, lending and, most recently, identity—all based on the challenges we’ve seen our customers face in industries like financial services, retail, and public sector. Forrester recognizes the power of our investments and innovations in its analysis in The Forrester Wave™: Document-Oriented Text Analytics Platforms, Q2 2022 report, saying: “Google Cloud’s strengths include document capture, image analytics, full ModelOps cycle capabilities, unstructured data security, and integration with Google Cloud’s augmented BI platform Looker.”Google Cloud has a close relationship with the Google Research organization that allows us to move very quickly to integrate bleeding edge technologies into our solutions. Large Language Models like LaMDA (our breakthrough conversation technology), and MUM (Multitask Unified Model, which can process complex queries and information across text and images) are examples of research technologies that we are currently using to develop our Document AI offerings. The power of connecting Google’s research to applications was acknowledged by both of Forrestor’s Wave reports for text analytics. In The Forrester Wave™: Document-Oriented Text Analytics Platforms, Q2 2022 report, Forrester says, “Google’s text analytics strategy is impressive, particularly its development and use of language models – such as its own LaMDA to improve cognitive search via conversational UX, open-source BERT, and partnering with PEGASUS project for document summarization.”Our customers such ase Mr Cooper, Workday,Unified Post, State of Hawaii  and many others are seeing great success in improving efficiency of document processing and customer service speed and satisfaction. If you’re dealing with a document based workflow and are not satisfied with the efficiency, accuracy, or cost of your current processes talk to your Google Cloud sales executive about how Document AI may help your business. You can read the findings from The Forrester Wave™: Document-Oriented Text Analytics Platforms, Q2 2022 by downloading your complimentary copy here.Related ArticleGoogle Cloud simplifies customer verification and benefits processing with Document AI for Identity cardsGoogle Cloud simplifies customer verification and benefits processing with Document AI for Identity.Read Article
Quelle: Google Cloud Platform

Google Cloud launches new sustainability offerings to help public sector agencies improve climate resilience

Governments play a vital role in understanding and responding to climate change; however, they often lack the actionable insights they need to respond quickly. To help solve this problem, Google Cloud is introducing new offerings that help organizations utilize Earth observation data to better understand climate risks and provide insights to inform policies for adaptation strategies. With these data-driven insights, public sector agencies and researchers can improve their response time to climate disasters, make more accurate predictions, and implement disaster-response plans with greater confidence. These offerings — Climate Insights for natural resources and Climate Insights for infrastructure — are already having an impact in the public sector and can be used to inform a multitude of use cases, including land and infrastructure management, and city and regional planning.Introducing Climate InsightsClimate Insights leverages the scale and power of Google Earth Engine (GEE) running on Google Cloud and combines artificial intelligence (AI) and machine learning (ML) capabilities with geospatial analysis using Google BigQuery and Vertex AI. Through GEE, climate researchers can access a multi-petabyte catalog of satellite imagery and geospatial datasets with planetary-scale analysis capabilities. Climate Insights can help Earth observation and remote-sensing scientists standardize and aggregate data from different sources, analyze them quickly, and easily visualize their outputs. Climate Insights for natural resources By unlocking geospatial data, Climate Insights for natural resources can help leaders manage the risks of extreme heat, wildfires, floods, droughts, which have dramatically impacted communities, and economies around the globe. It draws on GEE’s data catalog of more than 900 open datasets spanning 40 years, and leverages the expertise of Climate Engine to provide departments and agencies with an efficient way to ingest, process, and deliver pre-built Earth observation insights via API into decision-making contexts. For example, Natural Resources Canada (NRCan) has been using GEE to process satellite data to track environmental changes at scale. NRCan researcher Dr. Richard Fernandes has been using GEE to power his LEAF Toolbox, which creates customizable maps of foliage density in real time. Agriculture Canada is currently exploring using the LEAF toolbox to assess how crops are progressing, which impacts local economies and the global food supply. Furthermore, NRCan is currently piloting Climate Insights to provide scientists tools to accelerate their research.“Through a strategic partnership with Google Cloud, our scientists are leveraging cutting-edge cloud technologies to enhance the value of Earth observation science and data,” says Dr. Fernandes. “These types of next-generation geo-solutions allow massive volumes of Earth observation data to be converted into actionable insights supporting evidence-based decision-making that improve Canada’s economic and environmental performance.” Climate Insights for infrastructureUnderstanding and anticipating climate risk to the built environment is a challenge for any organization managing infrastructure. Not only is it necessary to have up-to-date insights regarding climate risks, but also current climate data needs to be combined with infrastructure data to assess risk and prioritize investments. Public sector organizations store large amounts of data in Geographic Information System (GIS) systems. Climate Insights for infrastructure helps make that data easy to access, analyze, and share through a unified solution. Building on top of GEE, Google Cloud, and CARTO, these insights enable planners, policy analysts, operations staff, and executives to access data for their decision making through an intuitive and easy to use location intelligence platform. The State of Hawaii Department of Transportation (HDOT) manages 2,500 miles of highway, with 20% of roads facing risks due to erosion and sea-level rise. With Climate Insights for infrastructure, HDOT can assess risk and prioritize investment decisions based on multiple climate factors, asset conditions, and community impact. “Our goal is to have a common data-driven platform to collect and share information across agencies, counties, and cities,” says Ed Sniffen, deputy director of highways for HDOT. “This helps us collaborate within our department and engage with our communities so we can better serve the public.”All running on the cleanest cloud in the industryWe support our cloud customers by operating the cleanest cloud in the industry, helping them act today to decarbonize their digital applications and infrastructure, and achieve their most ambitious sustainability targets. And by 2030, Google aims to operate on 24/7 carbon-free energy at all of our campuses, cloud regions and offices around the world.To learn more about Climate Insights and Google’s solutions for the public sector, register for the Google Cloud Sustainability Summit or contact our team. Click here to learn more about Google Cloud sustainability.Related ArticleAdopting real-world sustainability solutions with Google Cloud’s ecosystemGoogle Cloud and its ecosystem of sustainability-focused partners provide data, insights, and intelligence to support customer sustainabi…Read Article
Quelle: Google Cloud Platform

Monitoring Cloud SQL with SQL Server database auditing

Cloud SQL for SQL Server is a fully-managed database service that allows you to run SQL Server in the cloud and let Google take care of the toil. In the past year, we’ve launched features that help you get the most out of SQL Server, like support for Active Directory authentication, SQL Server 2019, and Cross Region Replicas. We’re happy to add another SQL Server security feature: database auditing. Database auditing allows you to monitor changes to your SQL Server databases, like database creations, data inserts, or table deletions. Cloud SQL writes audit logs generated by SQL Server to the local disk and to Google Cloud Storage. You can specify how long logs should be stored on the instance – for up to seven days – and use a SQL Server function to inspect logs. Cloud SQL will also automatically write all audit files to a Google Cloud Storage bucket that you manage, so you can decide how long to retain these records if you need them for longer than seven days, or consolidate them with audit files from other SQL Server instances. To enable database auditing, go to the Google Cloud console, select your Cloud SQL for SQL Server instance, and select Edit from the Overview page. You can also enable SQL Server Audit when you create a new Cloud SQL instance:Once you’ve enabled auditing for your Cloud SQL for SQL Server instance, you can create SQL Server audits and audit specifications, which determine what information will be tracked on your databases. You can capture granular information about operations performed on your databases, including, for example, every time a login succeeds or fails. If you want to capture different information for each of your databases, you can create different audit specifications for each database on your instance, or you can create server-level audit specifications to track changes across all databases. SQL Server auditing is now available for all Cloud SQL for SQL Server instances. Learn more about how to get started with this feature today!Related ArticleCloud SQL for SQL Server: Database administration best practicesCloud SQL for SQL Server is a fully-managed relational database service that makes it easy to set up, maintain, manage, and administer SQ…Read Article
Quelle: Google Cloud Platform

Impact.com: Forging a new era of business growth through partnerships

Business partnerships come in all shapes and forms: from affiliate and influencer marketing, to SaaS providers and strategic B2B alliances. For all parties to be successful and drive business growth through a partnership, they must have a way to manage, track, and measure the incremental value their partners provide throughout their relationship. That’s why impact.com has developed technology that makes it easy for businesses to create, manage, and scale an ecosystem of partnerships with the brands and communities that customers trust so that businesses can focus on building great relationships.The partnership management platform is currently helping thousands of brands, including Walmart and Shopify, to manage and optimize their partnerships’ ROI through its purpose-built platform. And impact.com has brought this vision to life with its software built on Google Cloud Platform. “We believe in the power of technology and partnerships to create transformational growth for our customers, our company, and ourselves,” says Lisa Riolo, VP Strategic Partnerships and Co-founder at impact.com. “This mindset has been integral to the success of impact.com, which grew from a five person startup to a company valued at $1.5 billion as of September 2021.”Fuelling business growth with the right partnerships and technologyimpact.com’s original vision was to significantly improve the technology available to performance marketers while empowering traditional media channels with the data and measurement systems available to digital marketers. But it’s always been clear that for the company to remain relevant it needs to constantly evolve to meet the needs of the next generation of marketers.“We designed our toolset to be future-proof, flexible, and to adapt to the changing global landscape. Our customers rely on impact.com to manage their strategic partnerships on a global level,” says Riolo. “This combined ability to be reliable and continually innovate is the sweet spot we look for when selecting the components of our technology setup, and that’s what we found in Google Cloud.”As a company that focuses on helping businesses grow through their partnerships, scalability has always been one key criteria behind impact.com’s technology. As it acquires multiple product-led technology companies throughout its growth, the importance of being scalable becomes more evident. New companies joining impact.com suddenly gain access to a multitude of businesses they could be working with, while their customer base tends to multiply due to the exposure they gain through these new partnerships. “From a strategic perspective, when you need something new you can build it, buy it, or partner with someone who has it. We do all three,” says Riolo. “Each time we welcome a new company, we bring them on board Google Cloud so they can lean on the same reliability and scalability as we do. Having the ability to accommodate our growth is a must, and scaling on a Google Cloud environment is seamless and efficient. Additionally, we are taking advantage of the global footprint of the platform to run our applications closer to customers with low latency.”Helping more businesses to grow in the cloudAs buyers increasingly turn to cloud marketplaces to fulfill their procurement needs, impact.com is launching its partnership management software on Google Cloud Marketplace. This means that companies of all sizes can find and quickly deploy impact.com’s software on Google Cloud without having to manually configure the software itself, its virtual machine instances, or its network settings. And by taking this step onto the cloud, they gain access to infrastructure that can keep up with their success.“Our commitment to our partners centers on how we best support and enable their growth. I believe, as customers grow, their need to be in the cloud is critical to their ability to scale up, no matter what type of business they are,” explains Riolo. “So being on Google Cloud Marketplace is important for impact.com to get more exposure, and also important for Google Cloud,  because the growth-focused businesses we attract need more cloud capabilities. That’s how we grow together, and we’re very excited about what this means for the future of our relationships.”Related Article5 ways retailers can evolve beyond traditional segmentation methodsFive ways retailers can evolve beyond traditional customer segmentation methods to drive more personalized experiences in real time.Read Article
Quelle: Google Cloud Platform

Improving developer agility and efficiency with Google Workspace

The software development process requires complex, cross-functional collaboration while continuously improving products and services. Our customers who build software say that they value Google Workspace for its ability to drive innovation and collaboration throughout the entire software development life cycle. Developers can hold standups and scrums in Google Chat, Meet, and Spaces, create and collaborate on requirements documentation in Google Docs and Sheets, build team presentations in Google Slides, and manage their focus time and availability with Google Calendar. Development teams also use many other tools to get work done, like tracking issues and tasks in Atlassian’s Jira, managing workloads with Asana, and incident management in PagerDuty. One of the benefits of Google Workspace is that it’s an open platform tailored to improve the performance of your tools by seamlessly integrating them together. We’re constantly expanding our ecosystem and improving Google Workspace, giving you the power to push your software development even further.Make software development more agileGoogle Workspace gives you real-time visibility into project progress and decisions to help you ship quality code fast and stay connected with your stakeholders, all without switching tools and tabs. By leveraging applications from our partners, you can pull valuable information out of silos, making collaborating on requirements, code reviews, bug triage, deployment updates, and monitoring operations easy for the whole team. This allows your teams to stay focused on their priorities while keeping everyone aligned, ensuring collaborators are always in the loop.Plan and execute togetherWhen combined with integrations, Google Workspace makes the software development planning process more collaborative and efficient. For example, many organizations use Asana—a leading work management platform—to coordinate and manage everything from daily tasks to cross-functional strategic initiatives. To make the experience more seamless, Asana built integrations so users can always have access to their tasks and projects with Google Drive, Gmail, and Chat. With these integrations for Google Workspace, you can turn your conversations into action and create new tasks in Asana—all without leaving Google Workspace. “We’ve seen exceptional, heavy adoption of tasks being created from within the Gmail add-on. Our customers and community have also shown very strong interest in future development work, which is something we’ll continue to prioritize.” Strand Sylvester, Product Manager, Asana To date, users have installed the Asana for Gmail add-on over 2.5 million times, as well as over 3.8 million installs of the Asana for Google Workspace add-on for Google Drive.Turn your conversations into action with the Asana for Google Chat app.Start coding quicklyGoogle Workspace makes it easy for product managers, UX designers, and engineers to agree on what they’re building and why. By bringing all stakeholders, decisions, and requirements into one place—whether it’s a Gmail or Google Chat conversation, or a document in Google Docs, Sheets, or Slides—Google Workspace removes friction, helping your teams finalize product specifications and get started right away.Integrations like GitHub for Google Chat make the entire development process fit easily into a developer’s workflow. With this integration, teams can quickly push new commits, make pull requests, do code reviews, and provide real-time feedback that improves the quality of their code—all from Google Chat.Get updates on GitHub without leaving the conversation.Speed up testingIntegrations like Jira for Google Chat accelerate the entire QA process in the development workflow. The app acts as a team member in the conversation, sending new issues and contextual updates as they are reported to improve the quality of your code and keep everyone informed on your Jira projects.Quickly create a new Jira issue without ever leaving Google Chat.Ship code fasterDevelopers use Jenkins—a popular open-source continuous integration and continuous delivery tool—to build and test products continuously. Along with other cloud-native tools, Jenkins supports strong DevOps practices by letting you continuously integrate changes into the software build. With Jenkins for Google Chat, development and operations teams can connect into their Jenkins pipeline and stay up to date by receiving software build notifications directly in Google Chat.Jenkins for Google Chat helps DevOps teams stay up to date with build notifications.Proactively monitor your servicesImproving the customer experience requires capturing and monitoring data sources to improve application and infrastructure observability. Google Workspace supports DevOps teams and organizations by helping stakeholders collaborate and troubleshoot more effectively. When you integrate Datadog with Google Chat, monitoring data becomes part of your team’s discussion, and you can efficiently collaborate to resolve issues as soon as they arise. The integration makes it easy to start a discussion with all the relevant teams by sharing a snapshot of a graph in any of your Chat spaces. When an alert notification is triggered, it allows you to notify each Chat space independently, precisely targeting your communication to the right teams.Collaborate, share, and track performance with Datadog for Google Chat.Improve service reliabilityOrchestrating business-wide responses to interruptions is a cross-functional effort. When revenue and brand reputation depends on customer satisfaction, it’s important to proactively manage service-impacting events. Google Workspace supports response teams by ensuring that urgent alerts reach the right people by providing teams with a central space to discover incidents, find the root cause, and resolve them quickly.  PagerDuty for Google Chat empowers developers, DevOps, IT operations, and business leaders to prevent and resolve business-impacting incidents for an exceptional customer experience—all from Google Chat. See and share details with link previews, and perform actions by creating or updating incidents. By keeping all conversations in a central space, new responders can get up to speed and solve issues faster without interrupting others.PagerDuty for Google Chat keeps the business up to date on service-impacting incidents.Accelerate developer productivityIntegrating your DevOps tools with Google Workspace allows your development teams to centralize their work, stay focused on what’s important—like managing their work—build code quickly, ship quality products, and communicate better during service impacting incidents. For more apps and solutions that help centralize your work so you and your teams can connect, create, and get things done, check out Google Workspace Marketplace, where you’ll find more than 5,300 public applications that integrate directly into Google Workspace.Related ArticleCan email still delight us? An interview with Gmail’s Product LeadInterview with Gmail’s Product Lead on how the team innovates and continues to deliver great user experiences.Read Article
Quelle: Google Cloud Platform

How SLSA and SBOM can help healthcare resiliency

Taking prescription medication at the direction of anyone other than a trained physician is very risky—and the same could be said for selecting technology used to run a hospital, to manage a drug manufacturing facility and, increasingly, to treat a patient for a medical condition.To pick the right medication, physicians need to carefully consider its ingredients, the therapeutic value they collectively provide, and the patient’s condition. Healthcare cybersecurity leaders similarly need to know what goes into the technology their organization’s use to manage patient medical records, manufacture compound drugs, and treat patients in order to keep them safe from cybersecurity threats.Just like prescription medication, careful vetting and selection of the technology is required to ensure patient safety and establish visibility and awareness into the technology modern healthcare depends on to create a resilient healthcare system. In this and our next blog, we focus on two topics critical to building resilience – software bill of materials (SBOM) and Google’s Supply chain Levels for Software Artifacts (SLSA) framework – and how to use them to make technology safe. Securing the software supply chain, or where the software we depend comes from, is a critical security priority for defenders and something Google is committed to helping organizations do.Diving deeper into the technology we rely onCybersecurity priorities for securing healthcare systems usually focus only on protecting sensitive healthcare information, like Protected Health Information (PHI). Maintaining the privacy of patient records is an important objective and securing data and systems plays a big role in this regard. Healthcare system leadership and other decision makers often depend on cybersecurity experts to select technologies and service providers that can meet regulatory rules for protecting data as a first (and sometimes only) priority. Trust is often placed on the reputations and compliance programs of the vendors who manufacture the technology they buy without much further inspection. Decision makers need to approach every key healthcare and life science technology or service provider choice as a high-risk, high-consequence decision, but few healthcare organizations have the skills, resources, and time to “go deep” in vetting the security built into the technology they buy before it enters a care setting. Vetting needs to include penetrating analysis of all aspects of software and hardware, their architecture and engineering quality, the provenance of all parts that they’re made of, and assessing each component for risk. Doing this can sometimes require deep technical skills and advanced knowledge of medical equipment threats that may not be easy to acquire. Instead of making additional investments to help secure their networks and systems, many organizations choose simpler paths.The failure to properly assess technological susceptibility to risk has exposed healthcare organizations and their patients to a variety of safety and security issues that may have been preventable. PTC (formerly Parametric Technology Corporation, which makes medical device software) disclosed seven vulnerabilities in March that impacted equipment used for robotic radiosurgery. In October 2019, the VxWorks Urgent 11 series of vulnerabilities was announced, affecting more than 1 billion connected devices, many used throughout healthcare and life sciences. More examples of medical devices and software found to have vulnerable components can be found on the FDAs cybersecurity website and in its recall database. How a physician understands, selects, and prescribes medication parallels how we address these concerns when selecting technology. Recent FDA guidance suggests manufacturers must soon provide increased levels of visibility into the technologies they market and sell in the healthcare industry. Here’s where the SBOM, a key visibility mechanism, comes in.What SBOMs do well, and how Google is helping make them betterThe National Telecommunications and Information Administration defines the SBOM as a “nested inventory for software, a list of ingredients that make up software components.”The concept of a SBOM appears to have found its start in enabling software makers back in the 1990s, although it originally stems from ideas popularized by visionary engineer and professor W. Edwards Deming. SBOM as a concept has advanced since then, with multiple standards for generating and sharing them now in use.Thanks to the continued focus on improving and using SBOMs, we expect it will be much easier for defenders to use SBOMs to track software and its components, where they come from, what security vulnerabilities they contain, and equip protectors with their ability to stop those vulnerabilities from being exploited, at scale, and before they impact patient care. “Software bills of materials help to bridge the knowledge gap created by running unknown, unpatched software and components as too many healthcare organizations currently do,” says Dan Walsh, chief information security officer at VillageMD, a tech-driven primary-care provider. “For security leaders, SBOM should be an extension of their asset inventory and management capability, regardless of whether that software was bought or built. At VillageMD, we are asking our vendors that store, transmit, receive or process PHI for an SBOM as part of our third-party vendor assessment program.”Today’s SBOMs are most often basic text files generated by a software developer when the creation of software is complete and a product is assembled (or application is created from source code.) The text file contains information about the product’s software components and subcomponents, where those components and subcomponents came from, and who owns them. But unlike a recipe used to make a pharmaceutical, for example, an SBOM also tracks the software versions of components and subcomponents. SBOMs often capture:Supplier NameComponent NameVersion of the ComponentOther Unique IdentifiersDependency RelationshipAuthor of SBOM DataTimestamp Here’s the format of a SBOM generated using the SPDX v2.2.1 standard:Technology producers, decision makers, and operators in any industry can use this information to deeply understand the risks the products pose to patients and the health system. An SBOM, for example, can show a reader if the software used on a medical device is merely out of date, or vulnerable to a cyber attack that could affect its safe use. Google sponsors a number of initiatives focused on securing the software supply chain, including how to use SBOMs, through our work with U.S. government agencies, the Open Source Security Foundation, and Linux Foundation, including a project focused on building and distributing SBOMs. Learn about the SPDX project and Cyclone DX, read the ISO/IEC 5962:2021 standard (for SPDX), ISO ISO/IEC 19770-2:2015 (for SWID; another artifact that provides a SBOM), and other training resources from the Linux Foundation.As an additional measure, healthcare organizations which use SBOM need to make sure they can trust that the SBOMs they rely on haven’t been changed since the manufacturer produced it. To defend against this, software makers can cryptographically sign their SBOMs making it easier to identify if a SBOM has been maliciously altered since it was first published. While U.S. Executive Order 14028 created a federal mandate for the SBOM, and although many organizations have begun to incorporate that mandate into their software production workflows, many issues and roadblocks remain unresolved. At Google, we think the use of SBOM will help organization’s gain important visibility into the technologies that are entering our healthcare facilities and enable defenders to more capably protect both patient safety and patient data privacy.Digging into the SLSAWe believe resilient organizations have resilient software supply chains. Sadly no single mechanism, like SBOM, can achieve this outcome. It’s why we created the SLSA framework, and services like Assured Open Source Software. SLSA was developed following Google’s own practices for securing its software supply chain. SLSA is guidance for securing software supply chains using a set of incremental, enforceable security guidelines that can automatically create auditable metadata. This metadata will then result in a “SLSA certification” to a particular package or build platform. It’s a verifiable way to assure consumers that the software they use hasn’t been tampered with, something which doesn’t exist broadly today. We’ve recently explained more about how the SLSA works in blog posts on SLSA basics and more in-depth SLSA details.Similarly, Assured Open Source Software gives organizations the ability to use the same regularly tested and secured software packages Google uses to build its software. Used in combination with a SBOM, technology makers can build reliable, safe, and verifiable products. Most technology buyers, such as those who run your local healthcare system, can use those same mechanisms to gain visibility into a technologies’ safety and fitness for use. Where do we go from here? Visibility into the components that make up the technology we use to care for patients is critically necessary. We can’t build a resilient healthcare system if our only priority is privacy of data. We must add resilience and safety to the list of our top priorities. Gaining deep visibility into the technology that decorates health system networks is a critical shift we must make. SBOM and SLSA help us make this shift. But remember, it’s not one or the other. As Dan Walsh from VillageMD says, the SBOM has a way to go:. “It won’t solve all of your problems,” he cautions, but adds that when used correctly, “SBOM will help you improve visibility into the software that runs on the critical systems that keep societies safe and we’re excited to see it get traction.”But when complemented with SLSA and topics we’ll cover next, such as a Vulnerability eXploitability Exchange (VEX), we are on a path to greater resilience.Related ArticleHow healthcare can strengthen its own cybersecurity resilienceBuilding resilience in healthcare cybersecurity may feel daunting, but lessons from exposure therapy and using core concepts can lead to …Read Article
Quelle: Google Cloud Platform

Four back-to-school and off-to-college consumer trends retailers should know

Is it September yet? Hardly! School is barely out for the summer. But according to Google and Quantum Metric research, the back-to-school and off-to-college shopping season – which in the U.S. is second only to the holidays in terms of purchasing volume1 – has already begun. For retailers, that means planning for this peak season has kicked off as well.We’d like to share four key trends that emerged from Google research and Quantum Metric’s Back-to-School Retail Benchmarks study of U.S. retail data, explore the reasons behind them, and outline the key takeaways.1. Out-of-stock and inflation concerns are changing the way consumers shop. Back-to-school shoppers are starting earlier every year, with 41% beginning even before school is out – even more so when buying for college1. Why? The behavior is driven in large part by consumers’ concerns that they won’t be able to get what they need if they wait too long. 29% of shoppers start looking a full month before they need something1.Back-to-school purchasing volume is quite high, with the majority spending up to $500 and 21% spending more than $1,0001. In fact, looking at year-over-year data, we see that average cart values have not only doubled since November 2021, but increased since the holidays1. And keep in mind that back-to-school spending is a key indicator leading into the holiday season.That said, as people are reacting to inflation, they are comparing prices, hunting for bargains, and generally taking more time to plan. This is borne out by the fact that 76% of online shoppers are adding items to their carts and waiting to see if they go on sale before making the purchase1. And, to help stay on budget and reduce shipping costs, 74% plan to make multiple purchases in one checkout1. That carries over to in-store shopping, when consumers are buying more in one visit to reduce trips and save on gas.  2. The omnichannel theme continues. Consumers continue to use multiple channels in their shopping experience. As the pandemic has abated, some 82% expect that their back-to-school buying will be in-store, and 60% plan to purchase online. But in any case, 45% of consumers report that they will use both channels; more than 50% research online first before ever setting foot in a store2. Some use as many as five channels, including video and social media, and these 54% of consumers spend 1.5 times more compared to those who use only two channels4.And mobile is a big part of the journey. Shoppers are using their phones to make purchases, especially for deadline-driven, last-minute needs, and often check prices on other retailers’ websites while shopping in-store. Anecdotally, mobile is a big part of how we ourselves shop with our children, who like to swipe on the phone through different options for colors and styles. We use our desktops when shopping on our own, especially for items that require research and represent a larger investment – and our study shows that’s quite common.3. Consumers are making frequent use of wish lists. One trend we have observed is a higher abandonment rate, especially for apparel and general home and school supplies, compared to bigger-ticket items that require more research. But that can be attributed in part to the increasing use of wish lists. Online shoppers are picking a few things that look appealing or items on sale, saving them in wish lists, and then choosing just a few to purchase. Our research shows that 39% of consumers build one or two wish lists per month, while 28% said they build one or two each week, often using their lists to help with budgeting1.4. Frustration rates have dropped significantly. Abandonment rates aside, shopper annoyance rates are down by 41%, year over year1. This is despite out-of-stock concerns and higher prices. But one key finding showed that both cart abandonment and “rage clicks” are more frequent on desktops, possibly because people investing time on search also have more time to complain to customer service.And frustration does still exist. Some $300 billion is lost each year in the U.S. from bad search experiences5. Data collected internationally shows that 80% of consumers view a brand differently after experiencing search difficulties, and 97% favor websites where they can quickly find what they are looking for5.Lessons to LearnWhat are the key takeaways for retailers? In general, consider the sources of customer pain points and find ways to erase friction. Improve search and personalization. And focus on improving the customer experience and building loyalty. Specifically:80% of shoppers want personalization6. Think about how you can drive personalized promotions or experiences that will drive higher engagement with your brand. 46% of consumers want more time to research1. Drive toward providing more robust research and product information points, like comparison charts, images, and specific product details.43% of consumers want a discount1, but given current economic trends, retailers may not be offering discounts. In order to appease budget-conscious shoppers, retailers can consider other retention strategies such as driving loyalty using points, rewards, or faster-shipping perks.Be sure to keep returns as simple as possible so consumers feel confident when making a purchase, and reduce possible friction points if a consumer decides to make a return. 43% of shoppers return at least a quarter of the products they buy and do not want to pay for shipping or jump through hoops1.How We Can HelpGoogle-sponsored research shows that price, deals, and promotions are important to 68% of back-to-school shoppers.7 In addition, shoppers want certainty that they will get what they want. Google Cloud can make it easier for retailers to enable customers to find the right products with discovery solutions. These solutions provide Google-quality search and recommendations on a retailer’s own digital properties, helping to increase conversions and reduce search abandonment. In addition, Quantum Metric solutions, available on the Google Cloud Marketplace, are built with BigQuery, which helps retailers consolidate and unlock the power of their raw data to identify areas of friction and deliver improved digital shopping experiences.We invite you to watch the Total Retail webinar “4 ways retailers can get ready for back-to-school, off-to college” on demand and to view the full Back-to-School Retail Benchmarks reportfrom Quantum Metric.Sources:1. Back-to-School Retail Benchmarks reportfrom Quantum Metric2. Google/Ipsos,Moments 2021, Jun 2021, Online survey, US, n=335 Back to School shoppers3. Google/Ipsos, Moments 2021, Jun 2021, Online survey, US, n=2,006 American general population 18+4. Google/Ipsos, Holiday Shopping Study, Oct 2021 – Jan 2022, Online survey, US, n=7,253, Americans 18+ who conducted holiday shopping activities in past two days5. Google Cloud Blog, Nov 2021, “Research: Search abandonment has a lasting impact on brand loyalty”6. McKinsey & Company, “Personalizing the customer experience: Driving differentiation in retail”7. Think with Google, July 2021, “What to expect from shoppers this back-to-school season”Related ArticleQuantum Metric explores retail big data use cases on BigQueryExplore three ways enterprises are leveraging Quantum Metric data in BigQuery to enhance the customer experience.Read Article
Quelle: Google Cloud Platform

Google Cloud Data Heroes Series: Meet Francisco, the Ecuadorian American founder of Direcly, a Google Cloud Partner

Google Cloud Data Heroes is a series where we share stories of the everyday heroes who use our data analytics tools to do incredible things. Like any good superhero tale, we explore our Google Cloud Data Heroes’ origin stories, how they moved from data chaos to a data-driven environment, what projects and challenges they are overcoming now, and how they give back to the community.In this month’s edition, we’re pleased to introduce Francisco! He is based out of Austin, Texas, but you’ll often find him in Miami, Mexico City, or Bogotá, Colombia. Francisco is the founder of Direcly, a Google Marketing Platform and Google Cloud Consulting/Sales Partner with presence in the US and Latin America.Francisco was born in Quito, Ecuador, and at age 13, came to the US to live with his father in Miami, Florida. He studied Marketing at Saint Thomas University, and his skills in math landed him a job as Teaching Assistant for Statistics & Calculus. After graduation, his professional career began at some nation’s  leading ad agencies before he eventually transitioned into the ad tech space. In 2016, he ventured into the entrepreneurial world and founded Direcly, a Google Marketing Platform, Google Cloud, and Looker Sales/Consulting partner obsessed with using innovative technological solutions to solve business challenges. Against many odds and with no external funding since its inception, Direcly became a part of a selected group of Google Cloud and Google Marketing Platform partners. Francisco’s story was even featured in a Forbes Ecuador article! Outside of the office, Francisco is an avid comic book reader/collector, a golfer, and fantasy adventure book reader. His favorite comic book is The Amazing Spider-Man #252, and his favorite book is The Hobbit. He says he isn’t the best golfer, but can ride the cart like a pro.When were you introduced to the cloud, tech, or data field? What made you pursue this in your career? I began my career in marketing/advertising, and I was quickly drawn to the tech/data space, seeing the critical role it played. I’ve always been fascinated by technology and how fast it evolves. My skills in math and tech ended up being a good combination. I began learning some open source solutions like Hadoop, Spark, and MySQL for fun and started to apply them in roles I had throughout my career.  After my time in the ad agency world, I transitioned into the ad tech industry, where I was introduced to how cloud solutions were powering ad tech solutions like demand side, data management, and supply side platforms. I’m the type of person that can get easily bored doing the same thing day in and day out, so I pursued a career in data/tech because it’s always evolving. As a result, it forces you to evolve with it. I love the feeling of starting something from scratch and slowly mastering a skill.What courses, studies, degrees, or certifications were instrumental to your progression and success in the field? In your opinion, what data skills or competencies should data practitioners be focusing on acquiring to be successful in 2022 and why? My foundation in math, calculus, and statistics was instrumental for me.  Learning at my own pace and getting to know the open source solutions was a plus. What I love about Google is that it provides you with an abundance of resources and information to get started, become proficient, and master skills. Coursera is a great place to get familiar with Google Cloud and prepare for certifications. Quests in Qwiklabs are probably one of my favorite ways of learning because you actually have to put in the work and experience first hand what it’s like to use Google Cloud solutions. Lastly, I would also say that just going to the Google Cloud internal documentation and spending some time reading and getting familiar with all the use cases can make a huge difference. For those who want to acquire the right skills I would suggest starting with the fundamentals. Before jumping into Google Cloud, make sure you have a good understanding of Python, SQL, data, and some popular open sources. From there, start mastering Google Cloud by firstly learning the fundamentals and then putting things into practice with Labs. Obtain a professional certification — it can be quite challenging but it is rewarding once you’ve earned it. If possible, add more dimension to your data expertise by studying real life applications with an industry that you are passionate about. I am fortunate to be a Google Cloud Certified Professional Data Engineer and hold certifications in Looker, Google Analytics, Tag Manager, Display and Video 360, Campaign Manager 360, Search Ads 360, and Google Ads. I am also currently working to obtain my Google Cloud Machine Learning Engineer Certification. Combining data applications with analytics and marketing has proven instrumental throughout my career. The ultimate skill is not knowledge or competency in a specific topic, but the ability to have a varied range of abilities and views in order to solve complicated challenges.You’re no doubt a thought leader in the field. What drew you to Google Cloud? How have you given back to your community with your Google Cloud learnings?Google Cloud solutions are highly distributed, allowing companies to use the same resources an organization like Google uses internally, but for their own business needs. With Google being a clear leader in the analytics/marketing space, the possibilities and applications are endless. As a Google Marketing Platform Partner and having worked with the various ad tech stacks Google has to offer, merging Google Cloud and GMP for disruptive outcomes and solutions is really exciting.  I consider myself to be a very fortunate person, who came from a developing country, and was given amazing opportunities from both an educational and career standpoint. I have always wanted to give back in the form of teaching and creating opportunities, especially for Latinos / US Hispanics. Since 2018, I’ve partnered with Florida International University Honors College and Google to create industry relevant courses. I’ve had the privilege to co-create the curriculum and teach on quite a variety of topics. We introduced a class called Marketing for the 21st Century, which had a heavy emphasis on the Google Marketing Platform. Given its success, in 2020, we introduced Analytics for the 21st Century, where we incorporated key components of Google Cloud into the curriculum. Students were even fortunate enough to learn from Googlers like Rob Milks (Data Analytics Specialist) and Carlos Augusto (Customer Engineer).What are 1-2 of your favorite projects you’ve done with Google Cloud’s data products? My favorite project to date is the work we have done with Royal Caribbean International (RCI) and Roar Media. Back in 2018, we were able to transition RCI efforts from a fragmented ad tech stack into a consolidated one within the Google Marketing Platform. Moreover, we were able to centralize attribution across all the paid marketing channels. With the vast amount of data we were capturing (17+ markets), it was only logical to leverage Google Cloud solutions in the next step of our journey. We centralized all data sources in the warehouse and deployed business intelligence across business units. The biggest challenge from the start was designing an architecture that would meet both business and technical requirements. We had to consider the best way to ingest data from several different sources, unify them, have the ability to transform data as needed, visualize it for decision makers, and set the foundations to apply machine learning. Having a deep expertise in marketing/analytics platforms combined with an understanding of data engineering helped me tremendously in leading the process, designing/implementing the ideal architecture, and being able to present end users with information that makes a difference in their daily jobs.      We utilized BigQuery as a centralized data warehouse to integrate all marketing sources (paid, organic, and research) though custom built pipelines. From there we created data driven dashboards within Looker, de-centralizing data and giving end users the ability to explore and answer key questions and make real time data driven business decisions. An evolution of this initiative has been able to go beyond marketing data and apply machine learning. We have created dashboards that look into covid trends, competitive pricing, SEO optimizations, and data feeds for dynamic ads. From the ML aspect, we have created predictive models on the revenue side, mixed marketing modeling, and applied machine learning to translate English language ads to over 17 languages leveraging historical data.What are your favoriteGoogle Cloud data productswithin the data analytics, databases, and/or AI/ML categories? What use case(s) do you most focus on in your work? What stands out aboutGoogle Cloud’s offerings?I am a big fan of BigQuery (BQ) and Looker. Traditional data warehouses are no match for the cloud – they’re not built to accommodate the exponential growth of today’s data and the sophisticated analytics required. BQ offers a fast, highly scalable, cost-effective and fully controlled cloud data warehouse for integrated machine learning analytics and the implementation of AI. Looker on the other hand, is truly next generation BI. We all love Structured Query Language (SQL), but I think many of us have been in position of writing dense queries and forgetting how some aspects of the code work, experiencing the limited collaboration options, knowing that people write queries in different ways, and how difficult it can be to track changes in a query if you changed your mind on a measure. I love how Look ML solves all those challenges, and how it helps one reuse, control and separate SQL into building blocks. Not to mention, how easy it is to give end users with limited technical knowledge the ability to look at data on their terms.      What’s next for you?I am really excited about everything we are doing at Direcly. We have come a long way, and I’m optimistic that we can go even further. Next for me is just to keep on working with a group of incredibly bright people who are obsessed with using innovative technological solutions to solve business challenges faced by other incredibly bright people.From this story I would like to tell those that are pursuing a dream, that are looking to provide a better life for themselves and their loved ones, to do it, take risks, never stop learning, and put in the work. Things may or may not go your way, but keep persevering — you’ll be surprised with how it becomes more about the journey than the destination. And whether things don’t go as planned, or you have a lot of success, you will remember everything you’ve been through and how far you’ve come from where you started.  Want to join the Data Engineer Community?Register for the Data Engineer Spotlight, where attendees have the chance to learn from four technical how-to sessions and hear from Google Cloud Experts on the latest product innovations that can help you manage your growing data.Related ArticleGoogle Cloud Data Heroes Series: Meet Antonio, a Data Engineer from Lima, PeruGoogle Cloud continues their Data Hero series with a profile on Antonio C., a data engineer, teacher, writer, and enthusiast on GCP.Read Article
Quelle: Google Cloud Platform

Load balancing Google Cloud VMware Engine with Traffic Director

The following solution brief discusses a GCVE + Traffic Director implementation aimed at providing customers an easy way to scale out web services, while enabling application migrations to Google Cloud. The solution is built on top of a flexibleandopen architecture that exemplifies the unique capabilities of Google Cloud Platform. Let’s elaborate:Easy: The full configuration takes minutes to implement and can be scripted or defined with Infrastructure-as-Code (IaC) for rapid consumption and minimal errors.Flexible and open: The solution relies on Envoy, an open source platform that enjoys tremendous popularity with the network and application communities.The availability of Google Cloud VMware Engine (GCVE) has given GCP customers the ability to deploy Cloud applications on a certified VMware stack that is managed, supported and maintained by Google. Many of these customers also demand seamless integration between their applications running on GCVE, and the various infrastructure services that are provided natively by our platform such as Google Kubernetes Engine (GKE), or serverless frameworks like Cloud Functions,  App Engine or Cloud Run. Networking services are at the top of that list.In this blog, we discuss how Traffic Director, a fully managed control plane for Service Mesh, can be combined with our portfolio of load balancers and withhybrid network endpoint groups (hybrid NEG) to provide a high-performance front-end for web services hosted in VMware Engine.Traffic Director also serves as the glue that links the native GCP load balancers and the GCVE backends, with the objective of enabling these technical benefits:Certificate Authority integration, for full lifecycle management of SSL certificates.DDoS protection with Cloud Armor, helps protect your applications and websites against denial of service and web attacks.Cloud CDN, for cached content delivery.Intelligent anycast with a Single IP and Global Reach, for improved failover, resiliency and availability. Bring Your Own IP (BYOIP),  to provision and use your own public IP addresses for Google Cloud resources.Diverse backend types integration in addition to GCVE, such as GCE, GKE, Cloud Storage and serverless. Scenario #1 – External load balancerThe following diagram provides a summary of the GCP components involved in this architecture:This scenario shows an external HTTP(S) load balancer used to forward traffic to the Traffic Director dataplane component, implemented as a fleet of Envoy proxies. Users can create routable NSX segments and centralize the definition of all traffic policies in Traffic Director. The GCVE VM IP and port pairs are specified directly in the hybrid NEG, meaning all network operations are fully managed by a Google Cloud control plane.Alternatively, GCVE VMs can be deployed to a non-routable NSX segment behind an NSX L4 load balancer configured at the Tier-1 level, and the Load Balancer VIP can be exported to the customer VPC via the import and export of routes in the VPC Peering connection. It is important to note that in GCVE, it is highly recommended that NSX-T load balancers be associated with Tier-1 gateways, and not the Tier-0 gateway.The steps to configure load balancers in NSX-T, including server pools, health checks, virtual servers and distribution algorithms are documented by VMware and not covered in this document.Fronting the web applications with an NSX load balancer would allow for the following:Only VIP routes are announced, allowing the use of private IP addresses in the web tier, as well as overlapping IP addresses in case of multi-tenant deployments.Internal clients (applications inside of GCP or GCVE) can point to the VIP of the NSX Load Balancer, while external clients can point to the public VIP in front of a native, GCP external load balancer.A L7 NSX load balancer can also be used (not discussed in this example), for advanced application-layer services, such as cookie session persistence, URL mapping, and more.To recap, the implementation discussed in this scenario shows an external HTTP(S) load balancer, but please note that an external TCP/UDP network load balancer or TCP Proxy could also be used for supporting protocols other than HTTP(S). There are certain restrictions when using Traffic Director in L4 mode, such as a single backend service per target proxy, which need to be accounted for when implementing your architecture.Scenario #2 – Internal load balancerIn this scenario, the only change is the load balancing platform used to route requests to Traffic Director-managed Envoy proxies. This use case may be appropriate in certain situations, for instance, whenever the users want to take advantage of advanced traffic management capabilities not supported without Traffic Director, as documented here.The Envoy-managed proxies controlled by Traffic Director can send traffic directly to GCVE workloads:Alternately, and similar to what was discussed in Scenario #1, an NSX LB VIP can be used instead of the explicit GCVE VM IPs, which introduces an extra load balancing layer:To recap, this scenario shows a possible configuration with L7 Internal Load Balancer, but an L4 Internal Load Balancer can also be used for supporting protocols other than HTTP(S). Please note there are certain considerations when leveraging L4 vs. L7 load balancers in combination with Traffic Director, which are all  documented here.ConclusionWith the combination of multiple GCP products, customers can take advantage of the various distributed network services offered by Google, such as global load balancing, while hosting their applications on a Google Cloud VMware Engine environment that provides continuity for their operations, without sacrificing availability, reliability or performance.Go ahead and review the GCVE networking whitepaper today. For additional information about VMware Engine, please visit the VMware Engine landing page, and explore our interactive tutorials. And be on the lookout for future articles, where we will discuss how VMware Engine integrates with other core GCP infrastructure and data services.Related ArticleNew in Google Cloud VMware Engine: Single nodes, certifications and moreThe latest version of Google Cloud VMware Engine now supports single node clouds, compliance certs and Toronto availabilityRead Article
Quelle: Google Cloud Platform