Easily connect SaaS platforms to Google Cloud with Eventarc

Last year, we launched Eventarc, a unified eventing platform with 90+ sources of events from Google Cloud, helping make it a more programmable cloud. We recognize that most Google Cloud customers utilize a myriad of platforms to run their business, from internal IT systems, to hosted vendor software and SaaS services. Creating and maintaining integrations between these platforms is time consuming and complex. With third-party sources in Eventarc, adding integrations between supported SaaS platforms and your applications in Google Cloud is easier than ever.Today we are happy to announce the Public Preview of third-party sources in Eventarc, with the first cohort of sources provided by ecosystem partners.Here are some highlights of this exciting new platform:Simple Discovery and Setup: Configure an integration in two easy steps. Fully managed event infrastructure: With Eventarc, there is nothing to maintain or manage so connecting your SaaS ecosystem to Google Cloud couldn’t be simpler.Consistency: Third-party sources are consistent with the rest of Eventarc, including a consistent trigger configuration and invocations in CloudEvent Format.Trigger multiple workloads: All supported Eventarc destinations are available to target with third party source triggers (Cloud Functions Gen2, Cloud Run, GKE, and Cloud Workflows). Built-in Filtering: Filter on most CloudEvent attributes to allow for robust and easy filtering in the Eventarc trigger.Today, we’re happy to introduce our first cohort of third-party sources. These partners help to improve the value of the connected cloud, and open new exciting use cases for our customers.The Datadog source is available today in publicpreview (codelab, setup instructions).Available in public preview today (setup instructions).The Lacework source is available in private preview. Sign up today.The Check Point CloudGuard source is available in private preview. Sign up today.Next stepsTo learn more about third-party providers offering an Eventarc source, to run through the quickstart, or to provide feedback please see the links below.Learn more about third-party sources in EventarcLearn about third-party providers currently offering an Eventarc sourceTry out the Datadog source codelabInterested in becoming a third-party source of events on Google Cloud? Contact us at eventarc-integrations@google.com
Quelle: Google Cloud Platform

Introducing Cloud Analytics by MITRE Engenuity Center in collaboration with Google Cloud

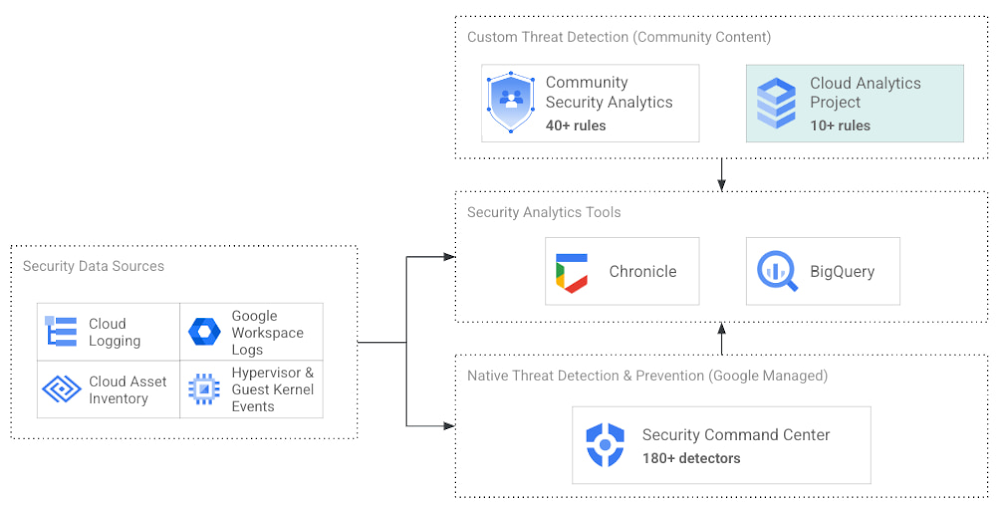
The cybersecurity industry is faced with the tremendous challenge of analyzing growing volumes of security data in a dynamic threat landscape with evolving adversary behaviors. Today’s security data is heterogeneous, including logs and alerts, and often comes from more than one cloud platform. In order to better analyze that data, we’re excited to announce the release of the Cloud Analytics project by the MITRE Engenuity Center for Threat-Informed Defense, and sponsored by Google Cloud and several other industry collaborators.Since 2021, Google Cloud has partnered with the Center to help level the playing field for everyone in the cybersecurity community by developing open-source security analytics. Earlier this year, we introduced Community Security Analytics (CSA) in collaboration with the Center to provide pre-built and customizable queries to help detect threats to your workloads and to audit your cloud usage. The Cloud Analytics project is designed to complement CSA.The Cloud Analytics project includes a foundational set of detection analytics for key tactics, techniques and procedures (TTPs) implemented as vendor-agnostic Sigma rules, along with their adversary emulation plans implemented with CALDERA framework. Here’s a overview of Cloud Analytics project, how it complements Google Cloud’s CSA to benefit threat hunters, and how they both embrace Autonomic Security Operations principles like automation and toil reduction (adopted from SRE) in order to advance the state of threat detection development and continuous detection and response (CD/CR).Both CSA and the Cloud Analytics project are community-driven security analytics resources. You can customize and extend the provided queries, but they take a more do-it-yourself approach—you’re expected to regularly evaluate and tune them to fit your own requirements in terms of threat detection sensitivity and accuracy. For managed threat detection and prevention, check out Security Command Center Premium’s realtime and continuously updated threat detection services including Event Threat Detection, Container Threat Detection, and Virtual Machine Threat Detection. Security Command Center Premium also provides managed misconfiguration and vulnerability detection with Security Health Analytics and Web Security Scanner.Google Cloud Security Foundation: Analytics Tools & ContentCloud Analytics vs Community Security AnalyticsSimilar to CSA, Cloud Analytics can help lower the barrier for threat hunters and detection engineers to create cloud-specific security analytics. Security analytics is complex because it requires:Deep knowledge of diverse security signals (logs, alerts) from different cloud providers along with their specific schemas;Familiarity with adversary behaviors in cloud environments;Ability to emulate such adversarial activity on cloud platforms;Achieving high accuracy in threat detection with low false positives, to avoid alert fatigue and overwhelming your SOC team.The following table summarizes the key differences between Cloud Analytics and CSA:Target platforms and language support by CSA & Cloud Analytics projectTogether, CSA and Cloud Analytics can help you maximize your coverage of the MITRE ATT&CK® framework, while giving you the choice of detection language and analytics engine to use. Given the mapping to TTPs, some of these rules by CSA and Cloud Analytics overlap. However, Cloud Analytics queries are implemented as Sigma rules which can be translated to vendor-specific queries such as Chronicle, Elasticsearch, or Splunk using Sigma CLI or third party-supported uncoder.io, which offers a user interface for query conversion. On the other hand, CSA queries are implemented as YARA-L rules (for Chronicle) and SQL queries (for BigQuery and now Log Analytics). The latter could be manually adapted to specific analytics engines due to the universal nature of SQL.Getting started with Cloud AnalyticsTo get started with the Cloud Analytics project, head over to the GitHub repo to view the latest set of Sigma rules, the associated adversary emulation plan to automatically trigger these rules, and a development blueprint on how to create new Sigma rules based on lessons learned from this project.The following is a list of Google Cloud-specific Sigma rules (and their associated TTPs) provided in this initial release; use these as examples to author new ones covering more TTPs.Sigma rule exampleUsing the canonical use case of detecting when a storage bucket is modified to be publicly accessible, here’s an example Sigma rule (copied below and redacted for brevity):The rule specifies the log source (gcp.audit), the log criteria (storage.googleapis.com service and storage.setIamPermissions method) and the keywords to look for (allUsers, ADD) signaling that a role was granted to all users over a given bucket. To learn more about Sigma syntax, refer to public Sigma docs.However, there could still be false positives such as a Cloud Storage bucket made public for a legitimate reason like publishing static assets for a public website. To avoid alert fatigue and reduce toil on your SOC team, you could build more sophisticated detections based on multiple individual Sigma rules using Sigma Correlations.Using our example, let’s refine the accuracy of this detection by correlating it with another pre-built Sigma rule which detects when a new user identity is added to a privileged group. Such privilege escalation likely occurred before the adversary gained permission to modify access of the Cloud Storage bucket. Cloud Analytics provides an example of such correlation Sigma rule chaining these two separate events.What’s nextThe Cloud Analytics project aims to make cloud-based threat detection development easier while also consolidating collective findings from real-world deployments. In order to scale the development of high-quality threat detections with minimum false positives, CSA and Cloud Analytics promote an agile development approach for building these analytics, where rules are expected to be continuously tuned and evaluated.We look forward to wider industry collaboration and community contributions (from rules consumers, designers, builders, and testers) to refine existing rules and develop new ones, along with associated adversary emulations in order to raise the bar for minimum self-service security visibility and analytics for everyone.AcknowledgementsWe’d like to thank our industry partners and acknowledge several individuals across both Google Cloud and the  Center for Threat-Informed Defense for making this research project possible:- Desiree Beck, Principal Cyber Operations Engineer, MITRE- Michael Butt, Lead Offensive Security Engineer, MITRE- Iman Ghanizada, Head of Autonomic Security Operations, Google Cloud- Anton Chuvakin, Senior Staff, Office of the CISO, Google CloudRelated ArticleIntroducing Community Security AnalyticsIntroducing Community Security Analytics, an open-source repository of queries for self-service security analytics to help you get starte…Read Article
Quelle: Google Cloud Platform

Keeping track of shipments minute by minute: How Mercado Libre uses real-time analytics for on-time delivery

Iteration and innovation fuel the data-driven culture at Mercado Libre. In our first post, we presented our continuous intelligence approach, which leverages BigQuery and Looker to create a data ecosystem on which people can build their own models and processes. Using this framework, the Shipping Operations team was able to build a new solution that provided near real-time data monitoring and analytics for our transportation network and enabled data analysts to create, embed, and deliver valuable insights.The challengeShipping operations are critical to success in e-commerce, and Mercado Libre’s process is very complex since our organization spans multiple countries, time zones, and warehouses, and includes both internal and external carriers. In addition, the onset of the pandemic drove exponential order growth, which increased pressure on our shipping team to deliver more while still meeting the 48-hour delivery timelines that customers have come to expect.This increased demand led to the expansion of fulfillment centers and cross-docking centers, doubling and tripling the nodes of our network (a.k.a. meli-net) in the leading countries where we operate. We also now have the largest electric vehicle fleet in Latin America and operate domestic flights in Brazil and Mexico. We previously worked with data coming in from multiple sources, and we used APIs to bring it into different platforms based on the use case. For real-time data consumption and monitoring, we had Kibana, while historical data for business analysis was piped into Teradata. Consequently, the real-time Kibana data and the historical data in Teradata were growing in parallel, without working together. On one hand, we had the operations team using real-time streams of data for monitoring, while on the other, business analysts were building visualizations based on the historical data in our data warehouse.  This approach resulted in a number of problems:The operations team lacked visibility and required support to build their visualizations. Specialized BI teams became bottlenecks.Maintenance was needed, which led to system downtime. Parallel solutions were ungoverned (the ops team used an Elastic database to store and work with attributes and metrics) with unfriendly backups and data bounded for a period of time.We couldn’t relate data entities as we do with SQL. Striking a balance: real-time vs. historical dataWe needed to be able to seamlessly navigate between real-time and historical data. To address this need, we decided to migrate the data to BigQuery, knowing we would leverage many use cases at once with Google Cloud.Once we had our real-time and historical data consolidated within BigQuery, we had the power to make choices about which datasets needed to be made available in near real-time and which didn’t. We evaluated the use of analytics with different time windows tables from the data streams instead of the real-time logs visualization approach. This enabled us to serve near real-time and historical data utilizing the same origin. We then modeled the data using LookML, Looker’s reusable modeling language based on SQL, and consumed the data through Looker dashboards and Explores. Because Looker queries the database directly, our reporting mirrored the near real-time data stored in BigQuery. Finally, in order to balance near real-time availability with overall consumption costs, we analyzed key use cases on a case-by-case basis to optimize our resource usage.This solution prevented us from having to maintain two different tools and featured a more scalable architecture. Thanks to the services of GCP and the use of BigQuery, we were able to design a robust data architecture that ensures the availability of data in near real-time.Streaming data with our own Data Producer Model: from APIs to BigQuery To make new data streams available, we designed a process which we call the “Data Producer Model” (“Modelo Productor de Datos” or MPD) where functional business teams can serve as data creators in charge of generating data streams and publishing them as related information assets we call “data domains”. Using this process, the new data comes in via JSON format, which is streamed into BigQuery. We then use a 3-tiered transformation process to convert that JSON into a partitioned, columnar structure.To make these new data sets available in Looker for exploration, we developed a Java utility app to accelerate the development of LookML and make it even more fun for developers to create pipelines.The end-to-end architecture of our Data Producer Model.The complete “MPD” solution results in different entities being created in BigQuery with minimal manual intervention. Using this process, we have been able to automate the following:The creation of partitioned, columnar tables in BigQuery from JSON samplesThe creation of authorized views in a different GCP BigQuery project (for governance purposes)LookML code generation for Looker viewsJob orchestration in a chosen time windowBy using this code-based incremental approach with LookML, we were able to incorporate techniques that are traditionally used in DevOps for software development, such as using Lams to validate LookML syntax as a part of the CI process and testing all our definitions and data with Spectacles before they hit production. Applying these principles to our data and business intelligence pipelines has strengthened our continuous intelligence ecosystem. Enabling exploration of that data through Looker and empowering users to easily build their own visualizations has helped us to better engage with stakeholders across the business.The new data architecture and processes that we have implemented have enabled us to keep up with the growing and ever-changing data from our continuously expanding shipping operations. We have been able to empower a variety of teams to seamlessly develop solutions and manage third party technologies, ensuring that we always know what’s happening – and more critically – enabling us to react in a timely manner when needed. Outcomes from improving shipping operations:Today, data is being used to support decision-making in key processes, including:Carrier Capacity OptimizationOutbound MonitoringAir Capacity MonitoringThis data-driven approach helps us to better serve you -and everyone- who expects to receive their packages on-time according to our delivery promise. We can proudly say that we have improved both our coverage and speed, delivering 79% of our shipments in less than 48 hours in the first quarter of 2022.Here is a sneak peek into the data assets that we use to support our day-to-day decision making:a. Carrier Capacity: Allows us to monitor the percentage of network capacity utilized across every delivery zone and identify where delivery targets are at risk in almost real time.b. Outbound Places Monitoring: Consolidates the number of shipments that are destined for a place (the physical points where a seller picks up a package), enabling us to both identify places with lower delivery efficiency and drill into the status of individual shipments.c. The Air Capacity Monitoring: Provides capacity usage monitoring for our aircrafts running each of our shipping routes.Costs into the equationThe combination of BigQuery and Looker also showed us something we hadn’t seen before: overall cost and performance of the system. Traditionally, developers maintained focus on metrics like reliability and uptime without factoring in associated costs.By using BigQuery’s information schema, Looker Blocks, and the export of BigQuery logs, we have been able to closely track data consumption, quickly detect underperforming SQL and errors, and make adjustments to optimize our usage and spend. Based on that, we know the Looker Shipping Ops dashboards generate a concurrency of more than 150 queries, which we have been able to optimize by taking advantage of BigQuery and Looker caching policies.The challenges aheadUsing BigQuery and Looker has enabled us to solve numerous data availability and data governance challenges: single point access to near real-time data and to historical information, self-service analytics & exploration for operations and stakeholders across different countries & time zones, horizontal scalability (with no maintenance), and guaranteed reliability and uptime (while accounting for costs), among other benefits.However, in addition to having the right technology stack and processes in place, we also need to enable every user to make decisions using this governed, trusted data. To continue achieving our business goals, we need to democratize access not just to the data but also to the definitions that give the data meaning. This means incorporating our data definitions with our internal data catalog and serving our LookML definitions to other data visualizations tools like Data Studio, Tableau or even Google Sheets and Slides so that users can work with this data through whatever tools they feel most comfortable using.If you would like a more indepth look at how we made new data streams available from a process we designed called the “Data Producer Model” (“Modelo Productor de Datos” or MPD) register  to attend our webcast on August 31.  While learning and adopting new technologies can be a challenge, we are excited to tackle this next phase, and we expect our users will be too, thanks to a curious and entrepreneurial culture. Are our teams ready to face new changes? Are they able to roll out new processes and designs? We’ll go deep on this in our next post.
Quelle: Google Cloud Platform

How Google Cloud can help stop credential stuffing attacks

Google has more than 20 years of experience protecting its core service from Distributed Denial of Service (DDoS) attacks and from the most advanced web application attacks. With Cloud Armor, we have enabled our customers to benefit from our extensive experience of protecting our globally distributed products such as Google Search, Gmail, and YouTube.In our research, we have noticed that new and more sophisticated techniques are increasingly able to bypass and override most of the commercial anti-DDoS systems and Web Application Firewalls (WAF). Credential stuffing is one of these techniques.Credential stuffing is one of the hardest to detect attacks because it’s more like the tortoise and less like the hare. In a slow but steady manner, the attacker exploits a list of usernames and passwords, often first available illicitly after a data breach, and uses automated techniques to force these compromised credentials to give them unauthorized access to a web service. While password reuse habits and the ever-growing number of stolen credential collections are making it easier for organizations uncover and report this type of “brute force” technique to law enforcement and technology providers, today’s credential stuffing attacks often leverage bots or compromised IoT devices to reach a level of scale and automation that earns the attackers far better results than the type of brute-force attacks deployed even a few years ago.Nevertheless, a defense-in-depth approach to cloud security can help stuff even advanced credential stuffing attacks. One technique is to secure user accounts with multi-factor authentication. In case of breach, the extra layer of protection that MFA creates can protect a password exposure from resulting in a successful malicious login. Unfortunately, we know that imposing such a requirement isn’t always appropriate or possible. In case of MFA failure or implementation challenges, additional controls to protect the websites that expose login forms against credential stuffing attacks can be deployed.We outline below how Google Cloud can help reduce the likelihood of a successful credential stuffing attack by building a layered security strategy that leverages native Google technologies such as Google Cloud Armor and reCAPTCHA Enterprise.Google Cloud Armor overviewGoogle Cloud Armor can help customers who use Google Cloud or on-premises deployments to mitigate and address multiple threats, including DDoS attacks and application attacks like cross-site scripting (XSS) and SQL injection (SQLi).Google Cloud Armor’s DDoS protection is always-on inline, scaling to the capacity of Google’s global network. It is able to instantly detect and mitigate network attacks in order to allow only well-formed requests through the load balancing proxies. This product provides not only anti-DDoS capabilities, but allows with a set of preconfigured rules to protect web applications and services from common attacks from the internet and help mitigate the OWASP Top 10 vulnerabilities. One of the most interesting features of Cloud Armor, especially for the credential stuffing attack protection, is the possibility to apply rate-based rules to help customers to protect the applications from a large volume of requests that flood instances and block access for legitimate users.Google Cloud Armor has two types of rate-based rules:Throttle: You can enforce a maximum request limit per client or across all clients by throttling individual clients to a user-configured threshold. This rule enforces the threshold to limit traffic from each client that satisfies the match conditions in the rule. The threshold is configured as a specified number of requests in a specified time interval.Rate-based ban: You can rate limit requests that match a rule on a per-client basis and then temporarily ban those clients for a specified time if they exceed a user-configured threshold.Google Cloud Armor security policies enable you to allow or deny access to your external HTTP(S) load balancer at the Google Cloud edge, as close as possible to the source of incoming traffic. This prevents unwelcome traffic from consuming resources or entering your Virtual Private Cloud (VPC) networks. The following diagram illustrates the location of the external HTTP(S) load balancers, the Google network, and Google data centers.Figure 1.A defense-in-depth approach to credential stuffing protectionIt is important to design security controls in a layered approach without relying only on a single defense mechanism. This strategy is known as defense-in-depth and if correctly applied, allows to achieve reasonable degrees of security. In the following sections we will discuss the layers that can be implemented using Google Cloud Armor to protect against credential stuffing attacks.Layer 1 – Geo-blocking and IP-blockingNon-sophisticated credential stuffing attacks are likely to use a limited number of IP addresses, often traceable to nation states. It is possible to start the defense-in-depth approach trying to identify the regions where the website that has to be protected should be available. For example, if the web is expected to be used only by U.S. users it is possible to set a deny rule using an expression like the following:code_block[StructValue([(u’code’, u”origin.region_code != ‘US'”), (u’language’, u”), (u’caption’, <wagtail.wagtailcore.rich_text.RichText object at 0x3e4f580ebf50>)])]Likewise, it is possible to apply a deny rule to block traffic that is originated by a list of regions, where the application shouldn’t be available. For example, if we want to block traffic from the United States and Italy, it is possible using the following expression:code_block[StructValue([(u’code’, u”origin.region_code == ‘US’ || origin.region_code == ‘IT'”), (u’language’, u”), (u’caption’, <wagtail.wagtailcore.rich_text.RichText object at 0x3e4f3ea9f510>)])]Additionally, it is possible to react to ongoing attacks creating a denylist for IP addresses or CIDRs, with a limit of 10 IP addresses, or ranges, per rule. An example would be:code_block[StructValue([(u’code’, u”inIPRange(origin.ip, ‘9.9.9.0/24′)”), (u’language’, u”), (u’caption’, <wagtail.wagtailcore.rich_text.RichText object at 0x3e4ef9c891d0>)])]While Geo-blocking and IP-blocking are good mechanisms to stop trivial attacks or to limit an attack, there is more that can be done to block attackers. Most of the sophisticated credential stuffing attack tools can be configured with proxies or to use compromised IoT devices to bypass IP-based controls.Layer 2 – HTTP headers Another way to improve defensive configurations is to add additional checks over the HTTP headers of the requests coming to the application. One of the main examples is the user-agent. The user-agent is a request header that helps the application to identify which operating system and which browser are being used usually to improve the user experience. The attackers do not frequently care about helping the application to better serve the user; in an attack scenario the HTTP headers are either completely missing or malformed. Below you can find an example rule to check the user-agent presence and correctness.code_block[StructValue([(u’code’, u”has(request.headers[‘user-agent’]) && request.headers[‘user-agent’].matches(‘Chrome’)”), (u’language’, u”), (u’caption’, <wagtail.wagtailcore.rich_text.RichText object at 0x3e4ef9c89810>)])]HTTP headers can be helpful to further reduce the attack surface, but they also have their limits. They are still controlled on the client side, which means an attacker can spoof them. To achieve maximum security results from configuring HTTP headers, it is necessary to more fully understand the HTTP headers that the application expects to encounter and to properly configure the Google Cloud Armor rule.Layer 3 – Rate Limiting As we’ve noted, the nature of credential stuffing attacks makes them difficult to identify. They are also often associated with password spraying techniques that target not only breached username and password pairs, but also widely-used, known weak passwords (such as “123456.”). Rate limiting protection mechanisms work well in these scenarios to add an additional defensive layer. When we deal with rate limiting, it’s important to identify the standard rate that a legitimate user would have, and to understand the threshold of requests that would be blocked if exceeded. Finding the right balance between security and user experience is often challenging. To help fine-tune rate limiting so that legitimate users are not blocked, Google Cloud Armor’s  Preview mode allows security teams to test rate limiting without any real enforcement. In order to minimize user impact, we strongly recommended proceeding in this way followed by an analysis of the test results.Once the preliminary analyses have been completed, it is possible to use Google Cloud Armor to implement rate limiting rules. An example of a rule that applies a ban (which the user sees as a 404 error) of 5 minutes after 50 connections in less than 1 minute from the same IP address would be:code_block[StructValue([(u’code’, u’gcloud compute security-policies rules create 100 \rn –security-policy=sec-policy \rn –action=rate-based-ban \rn –rate-limit-threshold-count=50 \rn –rate-limit-threshold-interval-sec=60 \rn –ban-duration-sec=300 \rn –conform-action=allow \rn –exceed-action=deny-404 \rn –enforce-on-key=IP’), (u’language’, u”), (u’caption’, <wagtail.wagtailcore.rich_text.RichText object at 0x3e4f54690650>)])]When it comes to rate limiting the client identification is fundamental. The IP address could be the first option, but there are cases where it wouldn’t be enough. For example, many Internet service providers use natting techniques to reduce the public IP addresses space needed. Of course, the probability of an IP clash is low, but it is something that should be taken into account when designing the rate limiting thresholds and strategy. Cloud Armor can identify individual clients in many ways such as using IP addresses, HTTP headers, HTTP cookies and XFF-IPs. For example, it is common for mobile apps to be designed to use custom headers with unique values to better identify each client in a reliable way. In this case, it would be appropriate to enforce the client identification based on this custom header rather than the IP address. Below is an example rule based on the custom header ‘client-random-id’.code_block[StructValue([(u’code’, u”gcloud compute security-policies rules create 100 \rn –security-policy=sec-policy \rn –action=rate-based-ban \rn –rate-limit-threshold-count=50 \rn –rate-limit-threshold-interval-sec=60 \rn –ban-duration-sec=300 \rn –conform-action=allow \rn –exceed-action=deny-404 \rn–enforce-on-key=HTTP-HEADER \rn –enforce-on-key-name=’client-random-id'”), (u’language’, u”), (u’caption’, <wagtail.wagtailcore.rich_text.RichText object at 0x3e4f57fb7a50>)])]Layer 4 – reCAPTCHA Enterprise and Google Cloud Armor integrationAn additional level of protection, combined with the previously mentioned techniques, would be the native integration of Google Cloud Armor with reCAPTCHA Enterprise technology.The integration could be made using a rate limiting rule similar to the one described above. Instead of returning a 404 error, it can be configured to redirect the connection to a reCAPTCHA Enterprise challenge at the WAF layer.  At this stage the following events take place:Cloud Armor verifies the rate limiting criteria and if exceeded would redirect the connection to reCAPTCHA Enterprise.reCAPTCHA Enterprise performs an assessment of the client interaction and if necessary challenges the user with a CAPTCHA.If the user fails the assessment an error message is returned. If the assessment is passed reCAPTCHA issues a temporary exemption cookie.Cloud Armor verifies the exemption cookie validity and grants access to the site.The following diagram shows the event sequence:Figure 2.ConclusionsCredential stuffing is a non-trivial attack and should be mitigated first with multi-factor authentication mechanisms and user education. Some technical measures can be implemented to apply a defense-in-depth model. Google Cloud Armor should be used to implement security mechanisms such as: Geo-Blocking HTTP Header verificationRate LimitingAnd, as an additional security layer:A combination of reCAPTCHA Enterprise and Google Cloud ArmorThese controls can achieve a reasonable degree of protection against not only credential stuffing attacks, but also brute-force attacks and general protection against bot-driven attacks.Related ArticleBetter protect your web apps and APIs against threats and fraud with Google CloudHow Google Cloud’s Web App and API Protection (WAAP) solution protects enterprises from rising security & fraud threatsRead Article
Quelle: Google Cloud Platform

Data Intensive Applications with GKE and MariaDB SkySQL

With Google Kubernetes Engine (GKE), customers get a fully managed environment to automatically deploy, manage, and scale containerized applications on Google Cloud. Kubernetes has become a preferred choice for running not only stateless workloads (e.g. Web Services) but also for stateful applications (e.g. databases). According to the Data on Kubernetes report, over 70% of Kubernetes users run stateful applications in production. Stateful application support within Kubernetes has improved rapidly, and GKE offers extensive support for high-performing and resilient persistent storage and built-in features like Backup for GKE.  With stateful applications, customers can choose to adopt a “do it yourself” (DIY) model and deploy directly on GKE or simply use a fully managed database-as-a-service (DBaaS) offering such as Cloud SQL or MariaDB SkySQL. Whatever operating model customers choose, they expect a reliable, consistent experience from applications which means data must be continuously available.  MariaDB SkySQL is a DBaaS for applications that demand scalability, availability and elasticity. It’s for customers looking for a cloud-native database that enables them to leverage the openness, resilience, extensibility, functionality and performance of MariaDB’s relational database on public cloud infrastructure. SkySQL delivers flexibility and scalability in a cloud database that keeps up with customers’ changing needs — all while reducing legacy database costs.Together customers get the best of both worlds for modern applications — fully managed compute with GKE for stateless applications and a highly reliable MariaDB SkySQL DBaaS for storing state. Virgin Media O2 serves more than 30 million users via Google Cloud and MariaDB SkySQL databases running all transactions for O2’s network, customer authentication, venue deployment and internal operations, including reporting and analytics.“We need to make informed business decisions because we can easily see and understand what is happening in our environment. We now have a 24×7 platform that’s more efficient, faster and cheaper. Cost was the last thing we looked at, but we’re happy to see the savings. Both OpEx and CapEx were massively reduced by moving everything we did from on-prem into SkySQL, and that savings will continue, on an ongoing basis. We can now always work within our budget and scale as we go.” – Paul Greaves, Head of Engineering, O2 Enterprise and Wifi, Virgin Media UK LimitedMariaDB SkySQL is built on GKE Under the hood, MariaDB SkySQL is built on GKE. DBaas are increasingly running on GKE to benefit from built-in features such as Backup for GKE, cost optimization features to measure unit economics and the portability and openness of Kubernetes. Additionally, to help with ongoing operations commonly referred to as ‘day 2 operations’, which has been a source of toil with stateful applications, customers get safe deployment strategies like Blue-green upgradesand observability. All this means running on GKE brings business agility that makes MariaDB SkySQL easy to deploy and easy to scale as the business grows. “Using GKE has really streamlined the process of operating SkySQL in the cloud,” says Kevin Farley, Global Director Cloud Partners MariaDB Corporation. “SkySQL databases deployed on GKE regional clusters using a Kubernetes operator, provide enterprise customers with maximum security and high availability.” Customers can choose to run databases of all types and sizes directly on GKE, or select managed DBaaS offerings like SkySQL. Increasingly, DBaaS are being built on GKE to deliver as-a-service products, so either way, customers get the power of GKE supporting mission critical applications. Try SkySQL on Google Cloud.
Quelle: Google Cloud Platform

Managing the Looker ecosystem at scale with SRE and DevOps practices

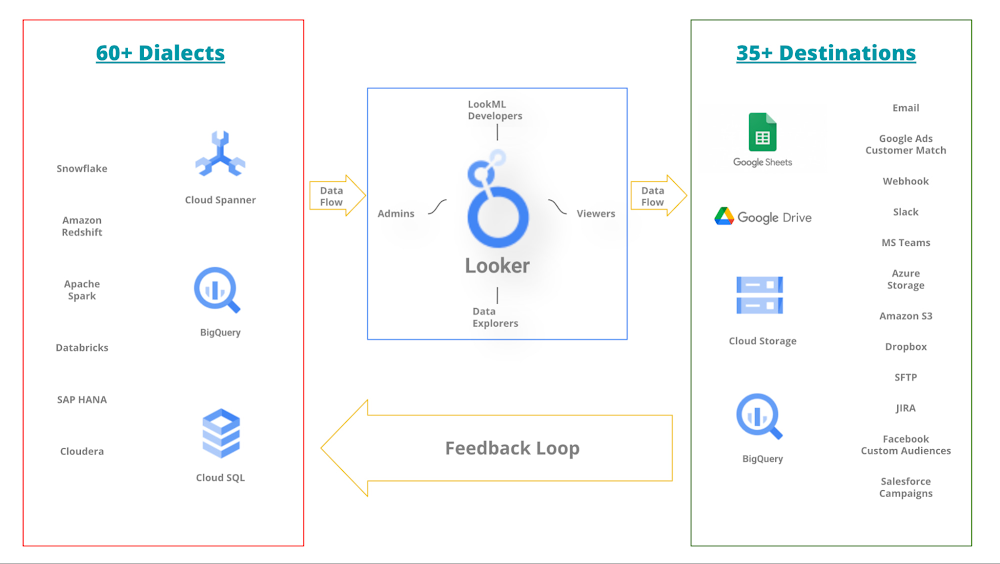
Many organizations struggle to create data-driven cultures where each employee is empowered to make decisions based on data. This is especially true for enterprises with a variety of systems and tools in use across different teams. If you are a leader, manager, or executive focused on how your team can leverage Google’s SRE practices or wider DevOps practices, definitely you are in the right place!What do today’s enterprises or mature start-ups look like?Today large organizations are often segmented into hundreds of small teams which are often working around data in the magnitude of several petabytes and in a wide variety of raw forms. ‘Working around data’ could mean any of the following: generating, facilitating, consuming, processing, visualizing or feeding back into the system. Due to a wide variety of responsibilities, the skill sets also vary to a large extent. Numerous people and teams work with data, with jobs that span the entire data ecosystem:Centralizing data from raw sources and systemsMaintaining and transforming data in a warehouseManaging access controls and permissions for the dataModeling dataDoing ad-hoc data analysis and explorationBuilding visualizations and reportsNevertheless, a common goal across all these teams is keeping services running and downstream customers happy. In other words, the organization might be divided internally, however, they all have the mission to leverage the data to make better business decisions. Hence, despite silos and different subgoals, destiny for all these teams is intertwined for the organization to thrive. To support such a diverse set of data sources and the teams supporting them, Looker supports over 60 dialects (input from a data source) and over 35 destinations (output to a new data source).Below is a simplified* picture of how the Looker ecosystem is central to a data-rich organization.Simplified* Looker ecosystem in a data-rich environment*The picture hides the complexity of team(s) accountable for each data source. It also hides how a data source may have dependencies on other sources. Looker Marketplace can also play an important role in your ecosystem.What role can DevOps and SRE practices play?In the most ideal state, all these teams will be in harmony as a single-threaded organization with all the internal processes so smooth that everyone is empowered to experiment (i.e. fail, learn, iterate and repeat all the time). With increasing organizational complexities, it is incredibly challenging to achieve such a state because there will be overhead and misaligned priorities. This is where we look up to the guiding principles of DevOps and SRE practices. In case you are not familiar with Google SRE practices, here is a starting point. The core of DevOps and SRE practices are mature communication and collaboration practices. Let’s focus on the best practices which could help us with our Looker ecosystem.Have joint goals. There should be some goals which are a shared responsibility across two or more teams. This helps establish a culture of psychological safety and transparency across teams.Visualize how the data flows across the organization. This enables an understanding how each team plays their role and how to work with them better.Agree on theGolden Signals (aka core metrics). These could mean data freshness, data accuracy, latency on centralized dashboards etc. These signals allow teams to set their error budgets and SLIs.Agree on communication and collaboration methods that work across teams. Regular bidirectional communication modes – have shared Google Chat spaces/slack channels. Focus on artifacts such as jointly owned documentations pages, shared roadmap items, reusable tooling, etc. For example, System Activity Dashboards could be made available to all the relevant stakeholders and supplemented with notes tailored to your organization.Set up regular forums where commonly discussed agenda items include major changes, expected downtime and postmortems around the core metrics. Among other agenda items, you could define/refine a common set of standards, for example centrally defined labels, group_labels, descriptions, etc. in the LookML to ensure there is a single terminology across the board.Promote informal sharing opportunities such as lessons learned, TGIFs, Brown bag sessions, and shadowing opportunities. Learning and teaching have an immense impact on how teams evolve. Teams often become closer with side projects that are slightly outside of their usual day-to-day duties.Have mutually agreed upon change management practices. Each team has dependencies so making changes may have an impact on other teams. Why not plan those changes systematically? For example, getting common standards across the Advance deploy mode.Promote continuous improvements. Keep looking for better, faster, cost-optimized versions of something important to the teams.Revisit your data flow. After every major reorganization, ensure that organizational change has not broken the established mechanisms.despite silos and different subgoals, destiny for all these teams is intertwined for the organization to thrive.Are you over-engineering?There is a possibility that in the process of maturing the ecosystem, we may end up in an overly engineered system – we may unintentionally add toil to the environment. These are examples of toil that often stem from communication gaps. Meetings with no outcomes/action plans – This one is among the most common forms of toil, where the original intention of a meeting is no longer valid but the forum has not taken efforts to revisit their decision.Unnecessary approvals – Being a single threaded team can often create unnecessary dependencies and your teams may lose the ability to make changes.Unaligned maintenance windows – Changes across multiple teams may not be mutually exclusive hence if there is misalignment then it may create unforeseen impacts on the end user.Fancy, but unnecessary tooling – Side projects, if not governed, may create unnecessary tooling which is not being used by the business. Collaborations are great when they solve real business problems, hence it is also required to refocus if the priorities are set right.Gray areas – When you have a shared responsibility model, you also may end up in gray areas which are often gaps with no owner. This can lead to increased complexity in the long run. For example, having the flexibility to schedule content delivery still requires collaboration to reduce jobs with failures because it can impact the performance of your Looker instance.Contradicting metrics – You may want to pay special attention to how teams are rewarded for internal metrics. For example, if a team focuses on accuracy of data and other one on freshness then at scale they may not align with one another.ConclusionTo summarize, we learned how data is handled in large organizations with Looker at its heart unifying a universal semantic model. To handle large amounts of diverse data, teams need to start with aligned goals and commit to strong collaboration. We also learned how DevOps and SRE practices can guide us navigate through these complexities. Lastly, we looked at some side effects of excessively structured systems. To go forward from here, it is highly recommended to start with an analysis of how data flows under your scope and how mature the collaboration is across multiple teams.Further reading and resourcesGetting to know Looker – common use casesEnterprise DevOps GuidebookKnow thy enemy: how to prioritize and communicate risks—CRE life lessonsHow to get started with site reliability engineering (SRE)Bring governance and trust to everyone with Looker’s universal semantic modelRelated articlesHow SREs analyze risks to evaluate SLOs | Google Cloud BlogBest Practice: Create a Positive Experience for Looker UsersBest Practice: LookML Dos and Don’ts
Quelle: Google Cloud Platform

Top 5 Takeaways from Google Cloud’s Data Engineer Spotlight

In the past decade, we have experienced an unprecedented growth in the volume of data that can be captured, recorded and stored.  In addition, the data comes in all shapes and forms, speeds and sources. This makes data accessibility, data accuracy, data compatibility, and data quality more complex than ever more. Which is why this year at our Data Engineer Spotlight, we wanted to bring together the Data Engineer Community to share important learning sessions and the newest innovations in Google Cloud. Did you miss out on the live sessions? Not to worry – all the content is available on demand. Interested in running a proof of concept using your own data? Sign up here forhands-on workshop opportunities.Here are the five biggest areas to catch up on from Data Engineer Spotlight, with the first four takeaways written by a loyal member of our data community: Francisco Garcia, Founder of Direcly, a Google Cloud Partner. #1: The next generation of Dataflow was announced, including Dataflow Go (allowing engineers to write core Beam pipelines in Go, data scientists to contribute with Python transforms, and data engineers to import standard Java I/O connectors). The best part, it all works together in a single pipeline. Dataflow ML (deploy easy ML models with PyTorch, TensorFlow, or stickit-learn to an application in real time), and Dataflow Prime (removes the complexities of sizing and tuning so you don’t have to worry about machine types, enabling developers to be more productive). Read on the Google Cloud Blog: The next generation of Dataflow: Dataflow Prime, Dataflow Go, and Dataflow MLWatch on Google Cloud YouTube: Build unified batch and streaming pipelines on popular ML frameworks #2: Dataform Preview was announced (Q3 2022), which helps build and operationalize scalable SQL pipelines in BigQuery. My personal favorite part is that it follows software engineering best practices (version control, testing, and documentation) when managing SQL. Also, no other skills beyond SQL are required. Dataform is now in private preview. Join the waitlist Watch on Google Cloud YouTube: Manage complex SQL workflows in BigQuery using Dataform CLI #3: Data Catalog is now part of Dataplex, centralizing security and unifying data governance across distributed data for intelligent data management, which can help governance at scale. Another great feature is that it has built-in AI-driven intelligence with data classification, quality, lineage, and lifecycle management.  Read on the Google Cloud Blog: Streamline data management and governance with the unification of Data Catalog and Dataplex Watch on Google Cloud YouTube: Manage and govern distributed data with Dataplex#4: A how-to on BigQuery Migration Services was covered, which offers end-to-end migrations to BigQuery, simplifying the process of moving data into the cloud and providing tools to help with key decisions. Organizations are now able to break down their data silos. One great feature is the ability to accelerate migrations with intelligent automated SQL translations.  Read More on the Google Cloud Blog: How to migrate an on-premises data warehouse to BigQuery on Google Cloud Watch on Google Cloud YouTube: Data Warehouse migrations to BigQuery made easy with BigQuery Migration Service #5: The Google Cloud Hero Game was a gamified three hour Google Cloud training experience using hands-on labs to gain skills through interactive learning in a fun and educational environment. During the Data Engineer Spotlight, 50+ participants joined a live Google Meet call to play the Cloud Hero BigQuery Skills game, with the top 10 winners earning a copy of Visualizing Google Cloud by Priyanka Vergadia. If you missed the Cloud Hero game but still want to accelerate your Data Engineer career, get started toward becoming a Google Cloud certified Data Engineer with 30-days of free learning on Google Cloud Skills Boost. What was your biggest learning/takeaway from playing this Cloud Hero game?It was brilliantly organized by the Cloud Analytics team at Google. The game day started off with the introduction and then from there we were introduced to the skills game. It takes a lot more than hands on to understand the concepts of BigQuery/SQL engine and I understood a lot more by doing labs multiple times. Top 10 winners receiving the Visualizing Google Cloud book was a bonus. – Shirish KamathCopy and pasting snippets of codes wins you competition. Just kidding. My biggest takeaway is that I get to explore capabilities of BigQuery that I may have not thought about before. – Ivan YudhiWould you recommend this game to your friends? If so, who would you recommend it to and why would you recommend it? Definitely, there is so much need for learning and awareness of such events and games around the world, as the need for Data Analysis through the cloud is increasing. A lot of my friends want to upskill themselves and these kinds of games can bring a lot of new opportunities for them. – Karan KukrejaWhat was your favorite part about the Cloud Hero BigQuery Skills game? How did winning the Cloud Hero BigQuery Skills game make you feel?The favorite part was working on BigQuery Labs enthusiastically to reach the expected results and meet the goals. Each lab of the game has different tasks and learning, so each next lab was giving me confidence for the next challenge. To finish at the top of the leaderboard in this game makes me feel very fortunate. It was like one of the biggest milestones I have achieved in 2022. – Sneha Kukreja
Quelle: Google Cloud Platform

Get to know the top 3 teams of the Google Cloud Hackathon Singapore

Google Cloud hackathonOn 10th April 2022, Google Cloud launched the first Singapore Google Cloud Hackathon, where startup teams were tasked to build solutions for either the topics of Sustainability, Artificial Intelligence, Automation or the New Normal, to create innovative solutions and have the opportunity to win prizes. From April to 10th June, Google Cloud worked with hackathon entrants through the solutioning process from ideation to prototyping to the final pitch. The hackathon saw incredible response with 40 startup teams competing for a top 5 spot. The top 5 teams were invited to pitch live at the Google Asia Pacific Singapore Campus and presented to a panel of judges that consisted of experts in the startup ecosystem and technology leaders across APAC in Google. The top 3 teams also continued to receive mentorship opportunities with Google Cloud and startup experts.  Top 3 teamsRead on to learn more about the top 3 startup teams:Team Empathly – 2nd Runner UpCofounders Timothy Liau, Jamie Yau and Rachel Tan personally experienced hate speech and witnessed discrimination in online communities. The available content filters and manual moderation solutions, which they found to be very expensive, only focused on damage control after the hateful comment has been sent. Out of a desire to prevent the toxic behavior at its source, Empathly was born.Any platform with user-generated content — social media, games, marketplaces, dating apps and more — is susceptible to hate speech. Described as “The Grammarly for content moderation”, Empathly applies its AI that identifies distinct types of hate speech with context – to promote safer and more inclusive speech in workplaces and online platforms. Empathy is built on Cloud Run and Cloud Firestore.Empathly’s behavioral science advisory team includes Yale-NUS professor and expert in behavioral insights Dr. Jean Liu whose research focuses on how technological solutions require an appreciation of human behavior and the social context. They will focus their next few months on working closely with their early customers and building toward product-market-fit.Team Ambient Systems – 1st Runner UpIvan Damnjanović founded Ambient to help companies meet their decarbonization targets through data science innovation. The team consists of Ivan and Frey Liu, a fellow computer science masters student from National University of Singapore (NUS). Through Ambient’s platform, companies can access real time Big Data analytics for actionable decarbonisation through energy efficiency and trade-off optimization.In 2020, Ambient Systems was founded when Ivan proposed a software-based solution for managing complex indoor air quality challenges, such as airborne transmission of COVID and vertical farming climate conditions. Ivan’s patent in the AgriTech field helped Ambient secure a $100k investment from NUS to further pursue commercialization of the technology and help Singapore achieve its 30 by 30 agenda – to build Singapore’s “agri-food industry’s capability and capacity to produce 30% of our nutritional needs locally and sustainably by 2030”.Through the use of Google’s Firebase platform, the team was able to quickly build a fully functional prototype that garnered interest from investors and customers.Team Pomona – ChampionsAs harsh weather conditions continue to plummet agricultural yield, there is an increasing need for countries to improve food security through efficient agriculture and sustainable living. However, high operational costs and cyclical risks inhibit the growth of vertical farming in the agricultural industry.Team Pomona consists of Pang Jun Rong, Yuen Kah May, Teo Keng Swee, Nicole Lim Jia Yi, Tan Jie En, who are student entrepreneurs from Singapore Management University (SMU) Computer Science. They took motivation from their school’s efforts in sustainability and technology to form Pomona — a solution set on making food security more personal through the ownership of vegetables in commercial agricultural lifecycles.Pomona features a gamified de-fi agricultural platform to promote collective ownership of vertical farming agriculture, which enables profit-sharing between producers and consumers to hedge against operational risks. This was done through a hybrid decentralized microservice cloud architecture with Google Cloud, using blockchain technologies for “dVeg” digital tokens and conventional full-stack components for gamification with IoT integration, providing real-time interactive growth tracking for lifecycle traceability.Final wordsCongratulations to all of the teams and especially Empathy, Ambient Systems, and Pomona. We look forward to more events with startups in the future!
Quelle: Google Cloud Platform

Scaling heterogeneous graph sampling for GNNs with Google Cloud Dataflow

This blog presents an open-source solution to heterogeneous graph sub-sampling at scale using Google Cloud Dataflow (Dataflow). Dataflow is Google’s publicly available, fully managed environment for running large scale Apache Beam compute pipelines. Dataflow provides monitoring and observability out of the box and is routinely used to scale production systems to easily handle extreme datasets.This article will present the problem of graph sub-sampling as a pre-processing step for training a Graph Neural Network (GNN) using Tensorflow-GNN (TF-GNN), Google’s open-source GNN library.The following sections will motivate the problem, present an overview of the necessary tools including Docker, Apache Beam, Google Cloud Dataflow, TF-GNN Unigraph format, TF-GNN graph-sampler concluding with end-to-end tutorial using large heterogeneous citation network (OGBN-MAG) popular for GNN (node-prediction) benchmarking. We do not cover modeling or training with TF-GNN which is covered by the libraries’ documentation and paper.MotivationRelational datasets (datasets with graph structure) including data derived from social graphs, citation networks, online communities and molecular data continue to proliferate and applying Deep Learning methods to better model and derive insights from structured data are becoming more common. Even if a dataset is originally unstructured, it’s not uncommon to observe performance gains for ML tasks by inferring structure before applying deep learning methods through tools such as Grale (semi-supervised graph learning).Visualized below is a synthetic example visualizing a citation network in the same style as the popular OGBN-MAG dataset. The figure shows a heterogeneous graph – a relational dataset with multiple types of nodes (entities) and relationships (edges) between them. In the figure there are two entities, “Paper” and “Author”.  Certain authors “Write” specific papers defining a relation between “Author” entities and “Paper” entities. “Papers” commonly “cite” other “Papers” building a relationship between the “Paper” entities.For real world applications, the number of entities and relationships may be very large and complex and in most cases, it is impossible to load a complete dataset into memory on a single machine.A visualization of OGBN-MAG citation network as a heterogeneous graph. For a given relational dataset or heterogeneous graph, there are (potentially) multiple types of entities and various types of relationships between entities.Graph Neural Networks (GNNs or GCNs) are a fast growing suite of techniques for extending Deep Learning and Message Passing frameworks to structured data and Tensorflow GNN (TF-GNN) is Google’s Graph Neural Networks library built on the Tensorflow platform. TF-GNN defines native tensorflow objects, including tfgnn.GraphTensor, capable of representing arbitrary heterogeneous graphs, models and processing pipelines that can scale from academic to real world applications including graphs with millions of nodes and trillions of edges.Scaling GNN models to large graphs is difficult and an active area of research as real world structured data sets typically do not fit in the memory available on a single computer making training/inference using a GNN impossible on a single machine. A potential solution is to partition a large graph into multiple pieces, each of which can fit on a single machine and be used in concert for training and inference. As GNNs are based on message-passing algorithms, how the original graph is partitioned is crucial to model performance.While conventional Convolutional Neural Networks (CNNs) have regularity that can be exploited to define a natural partitioning scheme, kernels used to train GNNs potentially overlap the surface of the entire graph, are irregularly shaped and are typically sparse. While other approaches to scaling GCNs exist, including interpolation and precomputing aggregations, we focus on subgraph sampling: partitioning the graph into smaller subgraphs using random explorations to capture the structure of the original graph.In the context of this document, the graph sampler is a batch Apache Beam program that takes a (potentially) large, heterogeneous graph and a user-supplied sampling specification as input, performs subsampling, and writes tfgnn.GraphTensors to a storage system encoded for downstream TF-GNN training.Introduction to Docker, Beam, and Google Cloud DataflowApache Beam (Beam) is an open-source SDK for expressing compute intensive processing pipelines with support for multiple backend implementations. Google Cloud Platform (GCP) is Google’s cloud computing service, of which Dataflow is GCPs implementation for running Beam pipelines at scale. The two main abstractions defined by the Beam SDK arePipelines – computational steps expressed as a DAG (Directed Acyclic Graph)Runners – Environments for running pipelines using different types of controller/server configurations and optionsComputations are expressed as Pipelines using the Apache Beam SDK and the Runners define a compute environment. Specifically, Google provides a Beam Runner implementation called the DataflowRunner that connects to a GCP project (with user supplied credentials) and executes the Beam pipeline in the GCP environment. Executing a Beam pipeline in a distributed environment involves the use of “worker” machines, compute units that execute steps in the DAG. Custom operations defined using the Beam SDK must be installed and available on the worker machines and data communicated between workers must be able to be serialized/deserialized for inter-worker communication. In addition to the DataflowRunner, there exists a DirectRunner which enables users to execute Beam pipelines on local hardware and is typically used for development, verification, and testing.When clients use the DirectRunner to launch Beam pipelines, the compute environment of the pipeline mirrors the local host; libraries and data available on the users’ machine are available to the Beam work units. This is not the case when running in a distributed environment. Worker machines compute environments are potentially different from the host that dispatches the remote Beam pipeline. While this might be sufficient for Pipelines that only rely on python standard libraries, this is typically not acceptable for scientific computing which may rely on mathematical packages or custom definitions and bindings. For example, TFGNN defines Protocol Buffers (tensorflow/gnn/proto) whose definitions must be installed both on the client that initiates the Beam pipeline and the workers that execute the steps of the sampling DAG. One solution is to generate a Docker image that defines a complete TFGNN runtime environment that can be installed on Dataflow workers before Beam pipeline execution.Docker containers are widely used and supported in the open source community for defining portable virtualized run-time environments that can be isolated from other applications on a common machine. A Docker Container is defined as a running instance of a Docker Image (conceptually a read-only binary blob or template). Images are defined by a Dockerfile that enumerates the specifics of a desired compute environment. Users of a Dockerfile “build” a Docker Image which can be used and shared by other people who have Docker installed to instantiate the isolated compute environment. Docker images can be built locally with tools like the Docker CLI or remotely via Google Cloud Build (GCB). Docker images can be shared in public or private repositories such as Google Container Registry or Google Artifact Registry.TF-GNN provides a Dockerfile specifying an operating system along with a series of packages, versions and installation steps to set up a common, hermetic compute environment that any user of TF-GNN (with docker installed) can use. With GCP, TF-GNN users can build a TF-GNN docker image and push that image to an image repository that Dataflow workers can install prior to being scheduled by a Dataflow pipeline execution.Unigraph Data FormatThe TF-GNN graph sampler accepts graphs in a format called unigraph. Unigraph supports very large, homogeneous and heterogeneous graphs with variable numbers of node sets and edge sets (types). Currently, in order to use the graph sampler, users need to convert their graph to unigraph format.The unigraph format is backed by a text-formatted GraphSchema protocol buffer (proto) message file describing the full (unsampled) graph topology. The GraphSchema defines three main artifacts:context: Global graph featuresnode sets: Sets of nodes with different types and (optionally) associated featuresedge sets: the directed edges relating nodes in node setsFor each context, node set and edge set there is an associated “table” of ids and features which may be in one of many supported formats; CSV files, shared tf.train.Example protos in TFRecords containers and more. The location of each “table” artifact may be absolute or local to the schema. Typically, a schema and all “tables” live under the same directory which is dedicated to the graph’s data. Unigraph is purposefully simple to enable users to easily translate their custom data source into a unigraph format which the graph sampler and subsequently TF-GNN can consume.Once the unigraph is defined, the graph sampler requires two more configuration artifacts:The location of the unigraph GraphSchema messageA SamplingSpec protocol buffer message(Optional) Seed node-ids If provided, random explorations will begin from the specified “seed” node-ids only.The graph sampler generates subgraphs by randomly exploring the graph structure starting from a set of “seed nodes”. The seed nodes are either explicitly specified by the user or, if omitted, every node in the graph is used as a seed node which will result in one subgraph for every node in the graph. Exploration is done at scale, without loading the entire graph on a single machine through the use of the Apache Beam programming model and Dataflow engine.A SamplingSpec message is a graph sampler configuration that allows the user control how the sampler will explore the graph through edge sets and perform sampling on node sets (starting from seed nodes). The SamplingSpec is yet another text formatted protocol buffer message that enumerates sampling operations starting from a single `seed_op` operation.  Example: OGBN-MAG Unigraph FormatAs a clarifying example, consider the OGBN-MAG dataset, a popular, large, heterogeneous citation network containing the following node and edge sets:OGBN-MAG Node Sets”paper” contains 736,389 published academic papers, each with a 128-dimensional word2vec feature vector computed by averaging the embeddings of the words in its title and abstract.”field_of_study” contains 59,965 fields of study, with no associated features.”author” contains the 1,134,649 distinct authors of the papers, with no associated features”institution” contains 8740 institutions listed as affiliations of authors, with no associated features.OGBN-MAG Edge Sets”cites” contains 5,416,217 edges from papers to the papers they cite.”has_topic” contains 7,505,078 edges from papers to their zero or more fields of study.”writes” contains 7,145,660 edges from authors to the papers that list them as authors.”affiliated_with” contains 1,043,998 edges from authors to the zero or more institutions that have been listed as their affiliation(s) on any paper.This dataset can be described in unigraph with the following skeleton GraphSchema message:code_block[StructValue([(u’code’, u’node_sets {rn key: “author”rn u2026rn}rn..rnnode_sets {rn key: “paper”rn u2026rn}rnedge_sets {rn key: “affiliated_with”rn value {rn source: “author”rn target: “institution”rn u2026rn}rnu2026rnedge_sets {rn key: “writes”rn value {rn source: “author”rn target: “paper”rn u2026rn }rn}rnedge_sets {rn key: “written”rn value {rn source: “paper”rn target: “author”rn metadata {rn u2026rn extra {rn key: “edge_type”rn value: “reversed”rn }rn }rn }rn}’), (u’language’, u”), (u’caption’, <wagtail.wagtailcore.rich_text.RichText object at 0x3efa1bb95a10>)])]This schema omits some details (a full example is included in the TFGNN repository) but the outline is sufficient to show that the GraphSchema message merely enumerates the node types as collections of node_sets and the relationships between the node sets are defined by the edge_sets messages. Note the additional “written” edge set. This relation is not defined in the original dataset or manifested on persistent media. However, the “written” table specification defines a reverse relation creating a directed edge from papers back to authors as the transpose of the “writes” edge set. The tfgnn-sampler will parse the metadata.extra tuple and if the edge_type/reverse key-value pair is present, generate an additional PCollection of edges (relations) that swaps the sources and targets relative the relations expressed on persistent media.Sampling SpecificationA TF-GNN modeler would craft a SamplingSpec configuration for a particular task and model. For OGBN-MAG, one particular task is to predict the venue (journal or conference) that a paper from a test set is published at. The following would be a valid sampling specification for that task:code_block[StructValue([(u’code’, u’seed_op {rn op_name: “seed”rn node_set_name: “paper”rn}rnsampling_ops {rn op_name: “seed->paper”rn input_op_names: “seed”rn edge_set_name: “cites”rn sample_size: 32rn strategy: RANDOM_UNIFORMrn}rnsampling_ops {rn op_name: “paper->author”rn input_op_names: [“seed”, “seed->paper”]rn edge_set_name: “written”rn sample_size: 8rn strategy: RANDOM_UNIFORMrn}rnsampling_ops {rn op_name: “author->paper”rn input_op_names: “paper->author”rn edge_set_name: “writes”rn sample_size: 16rn strategy: RANDOM_UNIFORMrn}rnsampling_ops {rn op_name: “author->institution”rn input_op_names: “paper->author”rn edge_set_name: “affiliated_with”rn sample_size: 16rn strategy: RANDOM_UNIFORMrn}rnsampling_ops {rn op_name: “paper->field_of_study”rn input_op_names: [“seed”, “seed->paper”, “author->paper”]rn edge_set_name: “has_topic”rn sample_size: 16rn strategy: RANDOM_UNIFORMrn}’), (u’language’, u”), (u’caption’, <wagtail.wagtailcore.rich_text.RichText object at 0x3efa1bb95410>)])]This particular SamplingSpec may be visualized in plate notation showing the relationship between the node sets and relations in the sampling specification as:Visualization of a valid OGBN-MAG SamplingSpec for the node prediction challenge.In human-readable terms, this sampling specification may be described as the following sequence of steps:Use all entries in the “papers” node set as “seed” nodes (roots of the sampled subgraphs).Sample 16 more papers randomly starting from the “seed” nodes through the citation edge set. Call this sampled set “seed->paper”.For both the “seed” and “seed->paper” sets, sample 8 authors using the “written” edge set. Name the resulting set of sampled authors “paper->author”.For each author in the “paper->author” set, sample 16 institutions via the “affiliated_with” edge set.For each paper in the “seed”, “seed->paper” and “author->paper” sample 16 fields of study via the “has_topic” relation.Node vs. Edge AggregationCurrently, the graph sampler program takes an optional input flag edge_aggregation_method which can be set to either node or edge (defaults to edge). The edge aggregation method defines the edges that the graph sampler collects on a per-subgraph basis after random exploration.Using the edge aggregation method, the final subgraph will only include the edges traversed during random exploration. Using the node aggregation method, the final subgraph will contain all edges that have a source and target node in the set of nodes visited during exploration. As a clarifying example, consider a graph with three nodes {A, B, C} with directed edges as shown below.Example graph.Instead of random exploration, assume we perform a one-hop breadth first search exploration starting at seed-node “A”, traversing edges A → B and A → C. Using the edge aggregation method, the final subgraph would only retain edges A → B and A → C while the node aggregation would include A → B, A → C and the B → C edge. The example sampling paths along with the edge and node aggregation results are visualized below.Left: Example sampling path. Middle: Edge aggregation sampling result. Right: Node aggregation sampling result.The edge aggregation method is less expensive (time and space) than node aggregation yet node aggregation typically generates subgraphs with higher edge density. It has been observed in practice that node-based aggregation can generate better models during training and inference for some datasets.TF-GNN Graph Sampling with Google Cloud Dataflow OBGN-MAG: End-To-End ExampleThe graph sampler, Apache Beam program implementing heterogeneous graph sampling can be found in the TF-GNN open-source repository.While alternative workflows are possible, this tutorial assumes the user will be building Docker images and initiating a Dataflow job from a local machine with internet access.First install docker on a local host machine then checkout the tensorflow_gnn repository.code_block[StructValue([(u’code’, u’git clone https://github.com/tensorflow/gnn.git’), (u’language’, u”), (u’caption’, <wagtail.wagtailcore.rich_text.RichText object at 0x3efa1a40ac10>)])]The user will need the name of their GCP project (which we refer to as  GCP_PROJECT) and some sort of GCP credentials. Default application credentials are typical for developing and testing within an isolated project but for production systems, consider maintaining custom service account credentials. Default application credentials may be obtained by:code_block[StructValue([(u’code’, u’gcloud auth application-default login’), (u’language’, u”), (u’caption’, <wagtail.wagtailcore.rich_text.RichText object at 0x3efa1a40a990>)])]On most systems, this command will download the access credentials to the following location: ~/.config/gcloud/application_default.json.Assuming the location of the cloned TF-GNN repository is ~/gnn, The TF-GNN docker image can be built and pushed the a GCP container registry with the following:code_block[StructValue([(u’code’, u’docker build ~/gnn -t tfgnn:latest gcr.io/${GCP_PROJECT}/tfgnn:latestrndocker push gcr.io/${GCP_PROJECT}/tfgnn:latest’), (u’language’, u”), (u’caption’, <wagtail.wagtailcore.rich_text.RichText object at 0x3efa2d1a46d0>)])]Building and pushing the image may take some time. To avoid the local build/push, the image can be built directly from a local Dockerfile remotely using Google Cloud Build.Get the OGBN-MAG DataThe TFGNN repository has a ~/gnn/examples directory containing a program that will automatically download and format common graph datasets from the OGBN website as unigraph. The shell script ./gnn/examples/mag/download_and_format.sh will execute a program in the docker container and download the ogbn-mag dataset to /tmp/data/ogbn-mag/graph on your local machine and convert it to unigraph resulting in the necessary GraphSchema and sharded TFRecord files representing the node and edge sets. To run sampling at scale with Dataflow on GCP, we’ll need to copy this data to a Google Cloud Storage (GCS) bucket so that Dataflow workers have access to the graph data.code_block[StructValue([(u’code’, u’gsutil mb gs://${BUCKET_NAME}rngsutil -m cp -r /tmp/data/ogbn-mag/graph gs://${BUCKET_NAME}/ogbn-mag/graph’), (u’language’, u”), (u’caption’, <wagtail.wagtailcore.rich_text.RichText object at 0x3efa2de8cd50>)])]Launching TF-GNN Sampling on Google Cloud DataflowAt a high level, the process of pushing a job to Dataflow using a custom Docker container may be visualized as follows:(Over-) Simplified visualization of submitting a sampling job to Dataflow.A user builds the TF-GNN docker image on their local machine, pushes the docker image to their GCR repository and sends a pipeline specification to the GCP Dataflow service. When the pipeline specification is received by the GCP Dataflow service, the pipeline is optimized, Dataflow workers (GCP VMs) are instantiated and pull and run the TF-GNN image that the user pushed to GCR. The number of workers automatically scale up/down according to the Dataflow autoscaling algorithm which by default monitors pipeline stage throughput. The input graph is hosted on GCP and the sampling results (GraphTensor output) are written to sharded *.tfrecord files on Google Cloud Storage.This process can be instantiated by filling in some variables and running the script: ./gnn/tensorflow_gnn/examples/mag/sample_dataflow.sh.code_block[StructValue([(u’code’, u’EXAMPLE_ARTIFACT_DIRECTORY=”gs://${GCP_BUCKET}/tfgnn/examples/ogbn-mag”rnGRAPH_SCHEMA=”${EXAMPLE_ARTIFACT_DIRECTORY}/schema.pbtxt”rnTEMP_LOCATION=”${EXAMPLE_ARTIFACT_DIRECTORY}/tmp”rnOUTPUT_SAMPLES=”${EXAMPLE_ARTIFACT_DIRECTORY}/samples@100″rnrn# Example: `gcr.io/${GOOGLE_CLOUD_PROJECT}/tfgnn:latest`.rnREMOTE_WORKER_CONTAINER=”[FILL-ME-IN]”rnGCP_VPN_NAME=”[FILL-ME-IN]”rnJOB_NAME=”tensorflow-gnn-ogbn-mag-sampling”‘), (u’language’, u”), (u’caption’, <wagtail.wagtailcore.rich_text.RichText object at 0x3efa2dd1b250>)])]These environment variables specify the GCP project resources and the location of inputs required by the Beam sampler. The TEMP_LOCATION variable is a path that is needed by Dataflow workers for shared scratch space and the samples are finally written to sharded TFRecord files at $OUTPUT_SAMPLES (a GCS location). REMOTE_WORKER_CONTAINER must be changed to the appropriate GCR URI pointing to the custom TF-GNN image.GCP_VPN_NAME is a variable holding a GCP network name. While the default VPC will work, the default network allocates Dataflow worker machines with IPs that have access to the public internet. These types of IPs count against GCP “in-use” IP quota range. As Dataflow worker dependencies are shipped in the Docker container, workers do not need IPs with external internet access and setting up a VPC without external internet access is recommended. See here for more information. To use the default network, set GCP_VPN_NAME=default and remove –no_use_public_ips from the command below.The main command to start the Dataflow tfgnn-sampler job follows:code_block[StructValue([(u’code’, u’docker run -v ~/.config/gcloud:/root/.config/gcloud \rn -e “GOOGLE_CLOUD_PROJECT=${GOOGLE_CLOUD_PROJECT}” \rn -e “GOOGLE_APPLICATION_CREDENTIALS=/root/.config/gcloud/application_default_credentials.json” \rn –entrypoint tfgnn_graph_sampler \rn tfgnn:latest \rn –graph_schema=”${GRAPH_SCHEMA}” \rn –sampling_spec=”${SAMPLING_SPEC}” \rn –output_samples=”${OUTPUT_SAMPLES}” \rn –edge_aggregation_method=”${EDGE_AGGREGATION_METHOD}” \rn –runner=DataflowRunner \rn –project=${GOOGLE_CLOUD_PROJECT} \rn –region=${GCP_REGION} \rn –max_num_workers=”${MAX_NUM_WORKERS}” \rn –temp_location=”${TEMP_LOCATION}” \rn –job_name=”${JOB_NAME}” \rn –no_use_public_ips \rn –network=”${GCP_VPN_NAME}” \rn –dataflow_service_options=enable_prime \rn –experiments=use_monitoring_state_manager \rn –experiments=enable_execution_details_collection \rn –experiment=use_runner_v2 \rn –worker_harness_container_image=”${REMOTE_WORKER_CONTAINER}” \rn –alsologtostderr’), (u’language’, u”), (u’caption’, <wagtail.wagtailcore.rich_text.RichText object at 0x3efa2dd1bf90>)])]This command mounts the users default application credentials, sets the $GOOGLE_CLOUD_PROJECT and $GOOGLE_APPLICATION_CREDENTIALS in the container runtime, launches the tfgnn_graph_sampler binary and sends the sampler DAG to the Dataflow service. Dataflow workers will fetch their runtime environment from the tfgnn:latest image stored in GCR and the output will be placed on GCS in the $OUTPUT_SAMPLES location, ready to train a TF-GNN model.
Quelle: Google Cloud Platform

5 ways a SOAR solution improves SOC analyst onboarding

Editor’s note: This blog was originally published by Siemplify on Feb. 19, 2021.The number of unfilled cybersecurity jobs stretches into the millions, and a critical part of the problem is the length of time it takes to backfill a position.Industry group ISACA has found that the average cybersecurity position lies vacant for up to six months. Some positions, like security analyst, are difficult to find suitable candidates for thanks to workplace challenges such as lack of management support and burnout, As the old phrase goes, time is money. So when organizations are fortunate enough to fill a position with the appropriate talent, they want to be able to make up for lost time as quickly as possible. This is especially true for roles in the security operations center, a setting notorious for needing staff to field never-ending alerts generated by an often-disparate collection of security tools.Training new analysts can be a daunting task. They need time to get acquainted with the SOC’s technology stack and processes. Without documentation, they often ask senior analysts for guidance. This can create distractions and consume time. A reliance on community knowledge—undocumented, not widely-known information within an organization—creates inconsistency within the SOC that contributes to longer ramp-up times for new analysts. Undocumented processes, combined with security tools that don’t talk to each other, typically mean a SOC will need to spend nearly 100 hours—the equivalent of 2 1/2 weeks—getting a single new analyst up to speed.Enter automation. Throughout an analyst’s career in the SOC, a security orchestration, automation, and response (SOAR) solution can be their best friend, helping expedite routine tasks and liberating them to perform more exciting work. But the technology can also allow even the most junior analysts to have an auspicious onboarding experience—hitting the ground running on day one, acclimated to their new environment, and feeling comfortable about and confident in their future.Here are five ways a SOAR solution can, among many other activities, aid in analyst onboarding1) The SOAR solution deploys automated playbooksThe average SOC receives large numbers of alerts per day, and many will be false positives. That amounts to a lot of dead-ends for analysts to chase and leaves little time to investigate legitimate anomalous network activity. The sheer volume of alerts has even prompted some analysts to turn off high-alert features on detection tools, potentially causing teams to miss something important.SOAR helps analysts hurdle these roadblocks by allowing teams to create custom, automated playbooks, workflows that equalize resources and knowledge across the SOC, and help maintain consistency in the face of new hires and staff turnover. And if analysts should need to create or edit any of the steps in these playbooks, the optimal SOAR solution will enable them to do this without knowledge of specific coding or query languages, acumen that a novice analyst may lack.2) The SOAR solution groups related alertsAs multiple alerts from different security tools are generated, some SOAR solutions allow you to automatically consolidate and group these alerts into one cohesive interface. This is what is known as taking a threat-centric approach to investigations, with the SOAR looking for contextual relationships in the alerts and, if identified, grouping these alerts into a single case. Having the ability to work more manageable and focused cases right off the bat will help ensure a smoother transition for new analysts.3) The SOAR solution pieces together the security stack From next-generation firewalls to SIEM to endpoint detection and response, the security stack in any given organization can be vast and complex. No incoming analyst has reasonable time to familiarize themselves with every tool living within the stack—or to manually tap into these different tools to obtain the appropriate context to apply to alerts. A SOAR solution alleviates this challenge by delivering context-rich data that can be analyzed in one central platform, eliminating the need for multiple consoles for alert triage, investigation and remediation. Plus, with a SOAR solution, there is no need for the SOC to directly touch a detection tool that another group may manage. 4) The SOAR solution streamlines collaboration to enable easy escalation and information sharingOften the SOC is not capable of responding to every threat, meaning other departments, such as networking, critical ops, or change management need to be involved. In addition, executive personnel are likely interested in security trends happening within the organization. Because not every group communicates in the same way—or consumes information in the same way—breakdowns can occur, and frustrations can mount, especially for a new analyst. A SOAR solution can even the playing field by automatically generating instructions, updates, or reports from the SOC to other teams, and vice versa. SOAR is also a useful solution for collaborating within the SOC team as well, especially in the age of remote and hybrid work.5) The SOAR solution prevents analysts from quickly burning out.There is a reason why the SOC has obtained the dubious acronym of “sleeping on chair.” Life in this environment can be a tedious, mental grind, prompting certain inhabitants to literally fall asleep from boredom. SOAR solutions can counter this tedium in two notable ways. They can prevent analysts from having to stare at a multitude of monitors while working long shifts. They can also free analysts to work on more strategic and thought-provoking assignments, which can help improve the company’s overall security posture—and ensure a new entrant to the SOC doesn’t lose steam immediately.To learn more about SOAR from Siemplify, now part of Google Cloud SecOps suite, including how to download the free community edition, visit siemplify.co/GetStarted.
Quelle: Google Cloud Platform