Welcome Karen Dahut to Google Public Sector

We recently announced the launch of Google Public Sector, a new Google subsidiary focused on helping U.S. federal, state, and local governments, and educational institutions accelerate their digital transformations. Google Public Sector brings Google technologies to government and education customers at scale, including open and scalable infrastructure; advanced data and analytics, artificial intelligence, and machine learning; modern collaboration tools like Google Workspace; advanced cybersecurity products; and more—so that agencies and institutions can better serve citizens and achieve their missions.In just the few months since the introduction of Google Public Sector, we’ve seen continued momentum. We announced that Google Workspace has achieved the U.S. Department of Defense’s (DOD) Impact Level 4 (IL4) authorization. And building on the success with government customers like the U.S. Navy,Defense Innovation Unit, and the U.S. Department of Veteran Affairs, we’ve also shared how we’re helping educational institutions like ASU Digital Prep—an accredited online K–12 school offered through Arizona State University—make remote immersive learning technology more accessible to students across the United States and around the world. Today, it is my pleasure to introduce Karen Dahut as the new CEO of Google Public Sector. With more than 25 years of experience in technology, cybersecurity, and analytics, Karen is a highly accomplished executive who has built businesses, developed and executed large-scale growth strategies, and created differentiated solutions across both commercial and federal industries. Karen joins us on Oct. 31. At that time, Will Grannis, who designed and launched Google Public Sector as founding CEO, will return to his role as the CTO of Google Cloud. Karen was previously sector president at Booz Allen Hamilton, where she led the company’s $4 billion global defense business—representing half of the firm’s annual revenue—and global commercial business sector, which delivered next-generation cybersecurity solutions to Fortune 500 companies. Under her leadership, Booz Allen became the premier digital integrator helping federal agencies use technology in support of their missions.Karen also has deep experience in building innovative solutions that help organizations tackle their toughest challenges. For example, at Booz Allen, she served as chief innovation officer and built the firm’s Strategic Innovation Group, which delivered new capabilities in cybersecurity, data science, and digital technologies. Prior to Booz Allen, Karen was an officer in the U.S. Navy and served as the controller for the Navy’s premier biomedical research institute. We believe Google Public Sector will continue to play a critical role in applying cloud technology to solve complex problems for our nation—across U.S. federal, state, and local governments, and educational institutions. We’re excited today to have Karen leading this new subsidiary, providing more choice in the public sector and helping scale our services to more government agencies nationwide.
Quelle: Google Cloud Platform

Building trust in the data with Dataplex

Analytics data is growing exponentially and so is the dependence on the data in making critical business and product decisions.  In fact, the best decisions are said to be the ones which are backed by data. In data, we trust!  But do we trust the data ? As the data volumes have grown – one of the key challenges organizations are facing is how to maintain the data quality in a scalable and consistent way across the organization.  While data quality is not a newly found need,  the needs used to be  contained when the data footprint was small and data consumers were few. In such a world, data consumers knew who the producers were and producers knew what the consumers needed. But today, data ownership is getting distributed and data consumption is finding new users and use cases.  So the existing data quality approaches find themselves limited and are isolated to certain pockets of the organization.  This often exposes data consumers to inconsistent and inaccurate data which ultimately impacts the decisions made from that data.  As a result, organizations today are losing 10s of millions of dollars due to the low quality of data.These organizations are looking for solutions that empower their data producers to consistently create high quality data cloud scale. Building Trust with Dataplex data quality Earlier this year,  at Google Cloud,  we launched Dataplex, an intelligent data fabric that enables governance and data management across distributed data at scale.  One of the key things Dataplex enables out-of-box is for data producers to build trust in the data with a built-in data quality. Dataplex data quality task delivers a declarative, data-ops centric experience for validating data across BigQuery and Google Cloud Storage.  Producers can now easily build and publish quality reports or can easily include data validations as part of their data production pipeline.  Reports can be aggregated across various data quality dimensions and the execution is entirely serverless.Dataplex data quality task provides  – A declarative approach for defining “what good looks like” that can be managed as part of a CI/CD workflow.  A serverless and managed execution with no infrastructure to provision. Ability to validate across data quality dimensions like  freshness, completeness, accuracy and validity.Flexibility in execution – either by using Dataplex serverless scheduler (at no extra cost) or executing the data validations as part of a pipeline (e.g. Apache Airflow).Incremental execution – so you save time and money by validating new data only. Secure and performant execution with zero data-copy from BigQuery environments and projects. Programmatic consumption of quality metrics for Dataops workflows. Users can also execute these checks on data that is stored in BigQuery and Google Cloud Storage but is not yet organized with Dataplex.  For Google Cloud Storage data that is managed by Dataplex, Dataplex auto-detects and auto-creates tables for structured and semi-structured data. These tables can be referenced with the Dataplex data quality task as well. Behind the scenes – Dataplex makes use of an open source data quality engine – Cloud Data Quality Engine – to run these checks. Providing an open platform is one of our key goals and we have made contributions to this engine to integrate seamlessly with Dataplex’s  metadata and serverless environment.You can learn more about this in our product documentation. Building enterprise trust at American Eagle Outfitters One of our enterprise customers  – American Eagle Outfitters (AEO) – is continuing to build trust in their critical data using Dataplex Data Quality Task.  Kanhu Badtia, lead data engineer from AEO, shares their rationale and experience with Dataplex data quality task:  “AEO is a leading global specialty retailer offering high-quality & on-trend clothing under its American Eagle® and Aerie® brands. Our company operates stores in the United States, Canada, Mexico, and Hong Kong, and ships to 81 countries worldwide through its websites. We are a data-driven organization that utilizes data from physical and digital store fronts, from social media channels, from logistics/delivery partners and many other sources through established compliant processes. We have a team of data scientists and analysts who create models, reports and dashboards that inform responsible business decision-making on such matters as inventory, promotions, new product launches and other internal business reviews. As the data engineering team at AEO, our goal is to provide highly trusted data for our internal data consumers. Before Dataplex – AEO had methods for maintaining data quality that were effective for their purpose. However, those methods were not scalable with the continual expansion of data volume and demand for quality results from our data consumers.  Internal data consumers identified and reported quality issues where ‘bad data’ was impacting business critical dashboards/reports . As a result, our teams were often in “fire-fighting” mode – finding & fixing bad data. We were looking for a solution that would standardize and scale data quality across the production data pipelines. The majority of AEO’s business data is in Google’s BigQuery or in Google Cloud Storage (GCS). When Dataplex launched the data quality capabilities, we immediately started a proof-of-concept. After a careful evaluation, we decided to use it as the central data quality framework for production pipelines. We liked that – It provides an easy declarative (YAML) & flexible way of defining data quality. We were able to parameterize it to use across multiple tables. It allows validating data in any BigQuery table with a completely serverless and native execution using existing slot reservations. It allows executing these checks as part of the ETL pipelines using DataPlex Airflow Operators. This is a huge win as pipelines can now pause further processing if critical rules do not pass. Data quality checks are executed in parallel which gives us the required execution efficiency in pipelines. Data quality results are stored centrally in BigQuery & can be queried to identify which rules failed/succeeded and how many rows failed. This enables defining custom thresholds for success. Organizing data in Dataplex Lakes is optional when using Dataplex data quality. Our team truly believes that data quality is an integral part of any data-driven organization and Dataplex DQ capabilities align perfectly with that fundamental principle. For example, here is a sample Google Cloud Composer / Airflow DAG  that loads & validates the “item_master” table and stops downstream processing if the validation fails.It includes simple rules for uniqueness, completeness and more complex rules for referential integrity or business rules such as checking daily price variance. We publish all data quality results centrally to a BigQuery table, such as this:Sample data quality output tableWe query this output table for data quality issues & fail the pipeline in case of critical rule failure. This stops low quality data from flowing downstream. We now have a repeatable process for data validation that can be used across the key data production pipelines. It standardizes the data production process and effectively ensures that bad data doesn’t break downstream reports and analytics.”Learn moreHere at Google – we are excited to enable our customer’s journey to high quality, trusted data.  To learn more about our current data quality capabilities please refer to – Dataplex Data Quality OverviewSample Airflow DAG with Dataplex Data Quality taskRelated ArticleStreamline data management and governance with the unification of Data Catalog and DataplexData Catalog will be unified with Dataplex, providing an enterprise-ready data fabric that enables data management and governance at scale.Read Article
Quelle: Google Cloud Platform

Evolving our data processing commitments for Google Cloud and Workspace

At Google, we are constantly looking to improve our products, services, and contracts so that we can better serve our customers. To this end, we are pleased to announce that we have updated and merged our data processing terms for Google Cloud, Google Workspace (including Workspace for Education), and Cloud Identity (when purchased separately) into one combined Cloud Data Processing Addendum (the “CDPA”).The CDPA maintains the benefits of the previously separate Data Processing and Security Terms for Google Cloud customers and Data Processing Amendment for Google Workspace and Cloud Identity customers, while streamlining and strengthening Google’s data processing commitments. A corresponding new CDPA (Partners) offers equivalent commitments to Google Cloud partners.  As part of this update, we have also incorporated the new international data transfer addendum issued by the U.K. Information Commissioner (“U.K. Addendum”). The U.K. Addendum allows the EU Standard Contractual Clauses (“SCCs”) to be used for transfers of personal data under the U.K. GDPR, replacing the separate U.K. SCCs that previously formed part of our terms. For an overview of the European legal rules for data transfers and our approach to implementing the EU SCCs and U.K. Addendum, please see our updated whitepaper. You can view our SCCs here.While our data processing terms have been renamed, consolidated, and updated, our  commitment to protecting the data of all Google Cloud, Workspace and Cloud Identity customers and all Google Cloud partners, and to enabling their compliance with data transfer and other regulatory requirements, remains unchanged.For more information about our privacy commitments for Google Cloud, Google Workspace, and Cloud Identity, please see our Privacy Resource Center.Related ArticleLeading towards more trustworthy compliance through EU Codes of ConductGoogle Cloud explains how its public commitment to supporting EU data protection requirements can help develop more trustworthy complianc…Read Article
Quelle: Google Cloud Platform

Schedule Connectivity Tests for continuous networking reachability diagnostics

As the scope and size of your cloud deployments expand, the need for automation to quickly and consistently diagnose service-affecting issues increases in parallel. Connectivity Tests – part of the Network Intelligence Center capabilities focused on Google Cloud network observability, monitoring, and troubleshooting – help you quickly troubleshoot network connectivity issues by analyzing your configuration and, in some cases, validating the data plane by sending synthetic traffic.  It’s common to start using Connectivity Tests in an ad hoc manner, for example, to determine whether an issue reported by your users is caused by a recent configuration change.  Another popular  use case for Connectivity Tests is to verify that applications and services are reachable post-migration, which helps verify that the cloud networking design is working as intended.  Once workloads are migrated to Google Cloud, Connectivity Tests help prevent regressions caused by mis-configuration or maintenance issues.  As you become more familiar with the power of Connectivity Tests, you may discover different use cases for running Connectivity Tests on a continuous basis.  In this post, we’ll walk through a solution to continuously run Connectivity Tests.Scheduling Connectivity Tests leverages existing Google Cloud platform tools to continuously execute tests and surface failures through Cloud Monitoring alerts.  We use the following products and tools as part of this solution:One or more Connectivity Tests to check connectivity between network endpoints by analyzing the cloud networking configuration and (when eligible) performing live data plane analysis between the endpoints.A single Cloud Function to programmatically run the Connectivity Tests using the Network Management API, and publish results to Cloud Logging.One or more Cloud Scheduler jobs that run the Connectivity Tests on a continuous schedule that you define.Operations Suite integrates logging, log-based metrics and alerting to surface test results that require your attention.Let’s get started.In this example there are two virtual machines running in different cloud regions of the same VPC.Connectivity TestsWe configure a connectivity test to verify that the VM instance in cloud region us-east4 can reach the VM instance in cloud region europe-west1 on port 443 using the TCP protocol.  The following Connectivity Test UI example shows the complete configuration of the test.For more detailed information on the available test parameters, see the Connectivity Tests documentation.At this point you can verify that the test passes both the configuration and data plane analysis steps, which tells you that the cloud network is configured to allow the VM instances to communicate and the packets transmitted between the VM instances were successfully passed through the network.Before moving on to the next step, note the name of the connectivity test in URI format, which is visible in the equivalent REST response output:We’ll use this value as part of the Cloud Scheduler configuration in a later step.Create Cloud FunctionCloud Functions provide a way to interact with the Network Management API to run a connectivity test.  While there are other approaches for interacting with the API, we take advantage of the flexibility in Cloud Functions to run the test and enrich the output we send to Cloud Logging.  Cloud Functions also provide support for numerous programming languages, so you can adapt these instructions to the language of your choice.  In this example, we use Python for interfacing with the Network Management API.Let’s walk through the high-level functionality of the code.First, the Cloud Function receives an HTTP request with the name of the connectivity test that you want to execute.  By providing the name of the connectivity test as a variable, we can reuse the same Cloud Function for running any of your configured connectivity tests.code_block[StructValue([(u’code’, u’if http_request.method != ‘GET':rn return flask.abort(rn flask.Response(rn http_request.method +rn ‘ requests are not supported, use GET instead’,rn status=405))rn if ‘name’ not in http_request.args:rn return flask.abort(rn flask.Response(“Missing ‘name’ URL parameter”, status=400))rn test_name = http_request.args[‘name’]’), (u’language’, u”), (u’caption’, <wagtail.wagtailcore.rich_text.RichText object at 0x3ea6e88ebd90>)])]Next, the code runs the connectivity test specified using the Network Management API.code_block[StructValue([(u’code’, u’client = network_management_v1.ReachabilityServiceClient()rn rerun_request = network_management_v1.RerunConnectivityTestRequest(rn name=test_name)rn try:rn response = client.rerun_connectivity_test(request=rerun_request).result(rn timeout=60)’), (u’language’, u”), (u’caption’, <wagtail.wagtailcore.rich_text.RichText object at 0x3ea6dda3a250>)])]And finally, if the connectivity test fails for any reason, a log entry is created that we’ll later configure to generate an alert.code_block[StructValue([(u’code’, u”if (response.reachability_details.result !=rn types.ReachabilityDetails.Result.REACHABLE):rn entry = {rn ‘message':rn f’Reran connectivity test {test_name!r} and the result was ‘rn ‘unreachable’,rn ‘logging.googleapis.com/labels': {rn ‘test_resource_id': test_namern }rn }rn print(json.dumps(entry))”), (u’language’, u”), (u’caption’, <wagtail.wagtailcore.rich_text.RichText object at 0x3ea6f4a04dd0>)])]There are a couple of things to note about this last portion of sample code:We define a custom label (test_resource_id: test_name) used when a log entry is written.  We’ll use this as part of the logs-based metric in a later step.We only write a log entry when the connectivity test fails.  You can customize the logic for other use cases, for example logging when tests that you expect to fail succeed or writing logs for successful and unsuccessful test results to generate a ratio metric.The full example code for the Cloud Function is below.code_block[StructValue([(u’code’, u’import jsonrnimport flaskrnfrom google.api_core import exceptionsrnfrom google.cloud import network_management_v1rnfrom google.cloud.network_management_v1 import typesrnrnrndef rerun_test(http_request):rn “””Reruns a connectivity test and prints an error message if the test fails.”””rn if http_request.method != ‘GET':rn return flask.abort(rn flask.Response(rn http_request.method +rn ‘ requests are not supported, use GET instead’,rn status=405))rn if ‘name’ not in http_request.args:rn return flask.abort(rn flask.Response(“Missing ‘name’ URL parameter”, status=400))rn test_name = http_request.args[‘name’]rn client = network_management_v1.ReachabilityServiceClient()rn rerun_request = network_management_v1.RerunConnectivityTestRequest(rn name=test_name)rn try:rn response = client.rerun_connectivity_test(request=rerun_request).result(rn timeout=60)rn if (response.reachability_details.result !=rn types.ReachabilityDetails.Result.REACHABLE):rn entry = {rn ‘message':rn f’Reran connectivity test {test_name!r} and the result was ‘rn ‘unreachable’,rn ‘logging.googleapis.com/labels': {rn ‘test_resource_id': test_namern }rn }rn print(json.dumps(entry))rn return flask.Response(status=200)rn except exceptions.GoogleAPICallError as e:rn print(e)rn return flask.abort(500)’), (u’language’, u”), (u’caption’, <wagtail.wagtailcore.rich_text.RichText object at 0x3ea6dfe39b10>)])]We use the code above and create a Cloud Function named run_connectivity_test.  Use the default trigger type of HTTP and make note of the trigger URL to use in a later stepcode_block[StructValue([(u’code’, u’https://us-east4-project6.cloudfunctions.net/run_connectivity_test’), (u’language’, u”), (u’caption’, <wagtail.wagtailcore.rich_text.RichText object at 0x3ea6df0fcf10>)])]Under Runtime, build, connections and security settings, increase the Runtime Timeout to 120 seconds.For the function code, select Python for the Runtime.For main.py, use the sample code provided above and configure the following dependencies for the Cloud Function in requirements.txt.code_block[StructValue([(u’code’, u’# Function dependencies, for example:rn# package>=versionrngoogle-cloud-network-management>=1.3.1rngoogle-api-core>=2.7.2′), (u’language’, u”), (u’caption’, <wagtail.wagtailcore.rich_text.RichText object at 0x3ea6df0fc590>)])]Click Deploy and wait for the Cloud Function deployment to complete.Cloud SchedulerThe functionality to execute the Cloud Function on a periodic schedule is accomplished using Cloud Scheduler.  A separate Cloud Scheduler job is created for each connectivity test you want to schedule.The following Cloud Console example shows the Cloud Scheduler configuration for our example.Note that the Frequency is specified in unix-cron format and in our example schedules the Cloud Function to run once an hour.  Make sure you take the Connectivity Tests pricing into consideration when configuring the frequency of the tests.The URL parameter of the execution configuration in the example below is where we bring together the name of the connectivity test and the Cloud Function trigger from the previous steps.  The format of the URL is{cloud_function_trigger}?name={connectivity-test-name}In our example, the URL is configured as:https://us-east4-project6.cloudfunctions.net/run_connectivity_test?name=projects/project6/locations/global/connectivityTests/inter-region-test-1The following configuration options complete the Cloud Scheduled configuration:Change the HTTP method to GET.Select Add OIDC token for the Auth header.Specify a service account that has the Cloud Function invoker permission for your Cloud Function.Set the Audience to the URL minus the query parameters, e.g.:https://us-east4-project6.cloudfunctions.net/run_connectivity_testLogs-based MetricThe Logs-based metric will convert unreachable log entries created by our Cloud Function into a Cloud Monitoring metric that we can use to create an alert. We start by configuring a Counter logs-based metric named unreachable_connectivity_tests.  Next, configure a filter to match the `test_resource_id` label that is included in the unreachable log messages.The complete metric configuration is shown below.Alerting PolicyThe Alerting Policy is triggered any time the logs-based metric increments, indicating that one of the continuous connectivity tests has failed.  The alert includes the name of the test that failed, allowing you to quickly focus your effort on the resources and traffic included in the test parameters.To create a new Alerting Policy, select the logging/user/unreachable_connectivity_test metric for the Cloud Function resource.Under Transform data, configure the following parameters:Within each time seriesRolling window = 2 minutesRolling window function = rateAcross time seriesTime series aggregation = sumTime series group by = test_resource_idNext, configure the alert trigger using the parameters shown in the figure below.Finally, configure the Documentation text field to include the name of the specific test that logged an unreachable result.Connectivity Tests provide critical insights into the configuration and operation of your cloud networking environment.  By combining multiple Google Cloud services, you can transform your Connectivity Tests usage from an ad-hoc troubleshooting tool to a solution for ongoing service validation and issue detection.We hope you found this information useful.  For a more in-depth look into Network Intelligence Center check out the What is Network Intelligence Center? post and our documentation.Related ArticleWhat is Network Intelligence Center?Network Intelligence Center provides a single console for managing Google Cloud network observability, monitoring, and troubleshooting.Read Article
Quelle: Google Cloud Platform

Enabling real-time AI with Streaming Ingestion in Vertex AI

Many machine learning (ML) use cases, like fraud detection, ad targeting, and recommendation engines, require near real-time predictions. The performance of these predictions is heavily dependent on access to the most up-to-date data, with delays of even a few seconds making all the difference. But it’s difficult to set up the infrastructure needed to support high-throughput updates and low-latency retrieval of data. Starting this month, Vertex AI Matching Engine and Feature Store will support real-time Streaming Ingestion as Preview features. With Streaming Ingestion for Matching Engine, a fully managed vector database for vector similarity search, items in an index are updated continuously and reflected in similarity search results immediately. With Streaming Ingestion for Feature Store, you can retrieve the latest feature values with low latency for highly accurate predictions, and extract real-time datasets for training. For example, Digits is taking advantage of Vertex AI Matching Engine Streaming Ingestion to help power their product, Boost, a tool that saves accountants time by automating manual quality control work.“Vertex AI Matching Engine Streaming Ingestion has been key to Digits Boost being able to deliver features and analysis in real-time. Before Matching Engine, transactions were classified on a 24 hour batch schedule, but now with Matching Engine Streaming Ingestion, we can perform near real time incremental indexing – activities like inserting, updating or deleting embeddings on an existing index, which helped us speed up the process. Now feedback to customers is immediate, and we can handle more transactions, more quickly,” said Hannes Hapke, Machine Learning Engineer at Digits.This blog post covers how these new features can improve predictions and enable near real-time use cases, such as recommendations, content personalization, and cybersecurity monitoring.Streaming Ingestion enables you to serve valuable data to millions of users in real time.Streaming Ingestion enables real-time AIAs organizations recognize the potential business impact of better predictions based on up-to-date data, more real-time AI use cases are being implemented. Here are some examples:Real-time recommendations and a real-time marketplace: By adding Streaming Ingestion to their existing Matching Engine-based product recommendations, Mercari is creating a real-time marketplace where users can browse products based on their specific interests, and where results are updated instantly when sellers add new products. Once it’s fully implemented, the experience will be like visiting an early-morning farmer’s market, with fresh food being brought in as you shop. By combining Streaming Ingestion with Matching Engine’s filtering capability, Mercari can specify whether or not an item should be included in the search results, based on tags such as “online/offline” or “instock/nostock.”Mercari Shops: Streaming Ingestion enables real-time shopping experimenLarge-scale personalized content streaming: For any stream of content representable with feature vectors (including text, images, or documents), you can design pub-sub channels to pick up valuable content for each subscriber’s specific interests. Because Matching Engine is scalable (i.e., it can process millions of queries each second), you can support millions of online subscribers for content streaming, serving a wide variety of topics that are changing dynamically. With Matching Engine’s filtering capability, you also have real-time control over what content should be included, by assigning tags such as “explicit” or “spam” to each object. You can use Feature Store as a central repository for storing and serving the feature vectors of the contents in near real time.Monitoring: Content streaming can also be used for monitoring events or signals from IT infrastructure, IoT devices, manufacturing production lines, and security systems, among other commercial use cases. For example, you can extract signals from millions of sensors and devices and represent them as feature vectors. Matching Engine can be used to continuously update a list of “the top 100 devices with possible defective signals,” or “top 100 sensor events with outliers,” all in near real time.Threat/spam detection: If you are monitoring signals from security threat signatures or spam activity patterns, you can use Matching Engine to instantly identify possible attacks from millions of monitoring points. In contrast, security threat identification based on batch processing often involves potentially significant lag, leaving the company vulnerable. With real-time data, your models are better able to catch threats or spams as they happen in your enterprise network, web services, online games, etc.Implementing streaming use casesLet’s take a closer look at how you can implement some of these use cases. Real-time recommendations for retailMercari built a feature extraction pipeline with Streaming Ingestion.Mercari’s real-time feature extraction pipelineThe feature extraction pipeline is defined with Vertex AI Pipelines, and is periodically invoked by Cloud Scheduler and Cloud Functions to initiate the following process:Get item data: The pipeline issues a query to fetch the updated item data from BigQuery.Extract feature vector: The pipeline runs predictions on the data with the word2vec model to extract feature vectors.Update index: The pipeline calls Matching Engine APIs to add the feature vectors to the vector index. The vectors are also saved to Cloud Bigtable (and can be replaced with Feature Store in the future).”We have been evaluating the Matching Engine Streaming Ingestion and couldn’t believe the super short latency of the index update for the first time. We would like to introduce the functionality to our production service as soon as it becomes GA, ” said Nogami Wakana, Software Engineer at Souzoh (a Mercari group company).This architecture design can be also applied to any retail businesses that need real-time updates for product recommendations.Ad targetingAd recommender systems benefit significantly from real-time features and item matching with the most up-to-date information. Let’s see how Vertex AI can help build a real-time ad targeting system.Real-time ad recommendation systemThe first step is generating a set of candidates from the ad corpus. This is challenging because you must generate relevant candidates in milliseconds and ensure they are up to date. Here you can use Vertex AI Matching Engine to perform low-latency vector similarity matching, generate suitable candidates, and use Streaming Ingestion to ensure that your index is up-to-date with the latest ads. Next is reranking the candidate selection using a machine learning model to ensure that you have a relevant order of ad candidates. For the model to use the latest data, you can use Feature Store Streaming Ingestion to import the latest features and use online serving to serve feature values at low latency to improve accuracy.  After reranking the ads candidates, you can apply final optimizations, such as applying the latest business logic. You can implement the optimization step using a Cloud Function or Cloud Run. What’s Next?Interested? The documents for Streaming Ingestion are available and you can try it out now. Using the new feature is easy: For example, when you create an index on Matching Engine with the REST API, you can specify the indexUpdateMethod attribute as STREAM_UPDATE.code_block[StructValue([(u’code’, u'{rn displayName: “‘${DISPLAY_NAME}'”, rn description: “‘${DISPLAY_NAME}'”,rn metadata: {rn contentsDeltaUri: “‘${INPUT_GCS_DIR}'”, rn config: {rn dimensions: “‘${DIMENSIONS}'”,rn approximateNeighborsCount: 150,rn distanceMeasureType: “DOT_PRODUCT_DISTANCE”,rn algorithmConfig: {treeAhConfig: {leafNodeEmbeddingCount: 10000, leafNodesToSearchPercent: 20}}rn },rn },rn indexUpdateMethod: “STREAM_UPDATE”rn}’), (u’language’, u”), (u’caption’, <wagtail.wagtailcore.rich_text.RichText object at 0x3ea55bfb7910>)])]After deploying the index, you can update or rebuild the index (feature vectors) with the following format. If the data point ID exists in the index, the data point is updated, otherwise, a new data point is inserted.code_block[StructValue([(u’code’, u'{rn datapoints: [rn {datapoint_id: “‘${DATAPOINT_ID_1}'”, feature_vector: […]}, rn {datapoint_id: “‘${DATAPOINT_ID_2}'”, feature_vector: […]}rn ]rn}’), (u’language’, u”), (u’caption’, <wagtail.wagtailcore.rich_text.RichText object at 0x3ea55bfa3d50>)])]It can handle the data point insertion/update at high throughput with low latency. The new data point values will be applied in any new queries within a few seconds or milliseconds (the latency varies depending on the various conditions). The Streaming Ingestion is a powerful functionality and very easy to use. No need to build and operate your own streaming data pipeline for real-time indexing and storage. Yet, it adds significant value to your business with its real-time responsiveness.To learn more, take a look at the following blog posts for learning Matching Engine and Feature Store concepts and use cases:Vertex Matching Engine: Blazing fast and massively scalable nearest neighbor searchFind anything blazingly fast with Google’s vector search technologyKickstart your organization’s ML application development flywheel with the Vertex Feature StoreMeet AI’s multitool: Vector embeddingsRelated ArticleHow Let’s Enhance uses NVIDIA AI and GKE to power AI-based photo editingLet’s Enhance uses AI to beautify images. GKE provides auto-provisioning, autoscaling and simplicity, while GPUs provide superior process…Read Article
Quelle: Google Cloud Platform

No workload left behind: Extending Anthos to manage on-premises VMs

We are pleased to announce general availability of virtual machine (VM) support in Anthos. VM support is available on Anthos for bare metal (now known as Google Distributed Cloud Virtual). Customers can now run VMs alongside containers on a single, unified, Google Cloud-connected platform in their data center or at the edge. With VM support in Anthos, developers and operations teams can run VMs alongside containers on shared cloud-native infrastructure. VM support in Anthos lets you achieve consistent container and VM operations with Kubernetes-style declarative configuration and policy enforcement, self-service deployment, observability and monitoring, all from the familiar Google Cloud console, APIs, and command line interfaces. The Anthos VM runtime can be enabled on any Anthos on bare metal cluster (v1.12 or higher) at no additional charge. During preview, we saw strong interest in VM support in Anthos for retail edge environments, where there is a small infrastructure footprint and a need to run new container apps and heritage VM apps on just a few hosts. In fact, a global Quick Service Restaurant (QSR), using a single VM of their existing point of sale solution, simulated throughput of more than 1,700 orders per hour for 10 hours, totalling more than 17,000 orders. The VM was running on the same hardware that exists at the store.Why extend Anthos to manage VMs?Many of our customers are modernizing their existing (heritage) applications using containers and Kubernetes. But few enterprise workloads are containerized today and millions of business-critical workloads still run in VMs. While many VMs can be modernized by migrating to VMs in Google Cloud or to containers on GKE or Anthos, many can’t — at least not right away. You might depend on a vendor-provided app that hasn’t been updated to run in containers yet, need to keep a VM in a data center or edge location for low latency connectivity to other local apps or infrastructure, or you might not have the budget to containerize a custom-built app today. How can you include these VMs in your container and cloud app modernization strategy?Anthos now provides consistent visibility, configuration, and security for VMs and containersRun and manage VMs and containers side-by-sideAt the heart of VM support in Anthos is the Anthos VM Runtime, which extends and enhances the open source KubeVirt technology. We integrated Kubevirt with Anthos on bare metal to simplify the install and upgrade experience. We’ve provided tools to manage VMs using the command line, APIs and the Google Cloud console. We’ve integrated VM observability logs and metrics with the Google Cloud operations suite, including out of the box dashboards and alerts. We’ve included significant networking enhancements like support for multiple network interfaces for VMs and IP/MAC stickiness to enable VM mobility that is also compatible with Kubernetes pod (multi-NIC). And we’ve added VLAN integration while also enabling customers to apply L4 Kubernetes network policies for an on-premises, VPC-like, micro segmentation experience. If you’re an experienced VM admin, you can take advantage of VM high availability, and simplified Kubernetes storage management for a familiar yet updated VM management experience. VM lifecycle management is built into the Google Cloud console for a simplified user experience that integrates with your existing Anthos and Google Cloud authentication and authorization frameworks.View and manage VMs running on Anthos in the Google Cloud ConsoleGet started right away with new VM assessment and migration toolsHow do you know if Anthos is the right technology for your VM workloads? Google Cloud offers assessment and migration tools to help you at every step of your VM modernization journey. Our updated fit assessment tool collects data about your existing VMware VMs and generates a detailed report. This no-cost report belongs to you and can be uploaded to the Google Cloud console for detailed visualization and historical views. The report provides a fit score for every VM that estimates the effort required to containerize the VM and migrate it to Anthos or GKE as a container, or migrate it to Anthos as a VM. Once you’ve identified the best VMs to migrate, use our no-cost updated Migrate to Containers tool to migrate VMs to Anthos from the command line or the console.Sample fit assessment report showing VMs that can be shifted (migrated) to Anthos as VMsDon’t let business-critical VM workloads or virtualization management investments keep you from realizing your cloud and container app modernization goals. Now you can include your heritage VMs in your on-premises managed container platform strategy. Please reach out for a complimentary fit assessment and let us help you breathe new life into your most important VMs.To learn more about all the exciting innovations we’re adding to Anthos, mark your calendar and join us at Google Cloud Next ‘22.Related ArticleAnthos on-prem and on bare metal now power Google Distributed Cloud VirtualGoogle Distributed Cloud Virtual uses Anthos on-prem or bare metal to create a hybrid cloud on your existing hardware.Read Article
Quelle: Google Cloud Platform

Deploy OCI artifacts and Helm charts the GitOps way with Config Sync

One principle of GitOps is to have the desired state declarations as Versioned and Immutable, where Git repositories play an important role as the source of truth. But can you have an alternative to a Git repository for storing and deploying your Kubernetes manifests via GitOps? What if you could package your Kubernetes manifests into a container image instead? What if you can reuse the same authentication and authorization mechanism as your container images?To answer the above questions, an understanding of OCI registries and OCI artifacts is needed. Simply put, OCI registries are the registries that are typically used for container images but can be expanded to store other types of data (aka OCI artifacts) such as Helm charts, Kubernetes manifests, Kustomize overlays, scripts, etc. Using OCI Registries and OCI Artifacts provides you with the following advantages: Less tools to operate: Single artifact registry can store expanded data types apart from container images.  In-built release archival system: OCI registries give users two sets of mutable and immutable URLs which are tags and content-addressable ones. Flourishing ecosystem: Standardized and supported by dozen of providers which helps users take advantage of new features and tools developed by large Kubernetes community Given these benefits, and in addition to the support of files stored in Git repositories, we are thrilled to announce two new formats supported by Config Sync 1.13 to deploy OCI artifacts:Sync OCI artifacts from Artifact RegistrySync Helm charts from OCI registriesConfig Sync is an open source tool that provides GitOps continuous delivery for Kubernetes clusters.The Open Container Initiative (OCI) is an open governance structure for the express purpose of creating open industry standards around container formats and runtimes. OCI artifacts give you the power of storing and distributing different types of data such as Kubernetes manifests, Helm Charts, and Kustomize overlays, in addition to container images via OCI registries.Throughout this blog, you will see how you can leverage the two new formats (OCI artifacts and Helm charts) supported by Config Sync, by using:oras and helm to package and push OCI artifactsArtifact registry as OCI registry to store the OCI artifactsGKE cluster to host the OCI artifacts syncedConfig Sync installed in that GKE cluster to sync the OCI artifactsInitial setupFirst, you need to have a common setup for the two scenarios by configuring and securing the access from the GKE cluster with Config Sync to the Artifact Registry repository.Initialize the Google Cloud project you will use throughout this blog:code_block[StructValue([(u’code’, u’PROJECT=SET_YOUR_PROJECT_ID_HERErngcloud config set project $PROJECT’), (u’language’, u”), (u’caption’, <wagtail.wagtailcore.rich_text.RichText object at 0x3eca253a6c10>)])]Create a GKE cluster with Workload Identity registered in a fleet to enable Config Management:code_block[StructValue([(u’code’, u’CLUSTER_NAME=oci-artifacts-clusterrnREGION=us-east4rngcloud services enable container.googleapis.comrngcloud container clusters create ${CLUSTER_NAME} \rn –workload-pool=${PROJECT}.svc.id.goog \rn –region ${REGION}rngcloud services enable gkehub.googleapis.comrngcloud container fleet memberships register ${CLUSTER_NAME} \rn –gke-cluster ${REGION}/${CLUSTER_NAME} \rn –enable-workload-identityrngcloud beta container fleet config-management enable’), (u’language’, u”), (u’caption’, <wagtail.wagtailcore.rich_text.RichText object at 0x3eca263d4e10>)])]Install Config Sync in the GKE cluster:code_block[StructValue([(u’code’, u’cat <<EOF > acm-config.yamlrnapplySpecVersion: 1rnspec:rn configSync:rn enabled: truernEOFrngcloud beta container fleet config-management apply \rn –membership ${CLUSTER_NAME} \rn –config acm-config.yaml’), (u’language’, u”), (u’caption’, <wagtail.wagtailcore.rich_text.RichText object at 0x3eca263d4cd0>)])]Create an Artifact Registry repository to host OCI artifacts (–repository-format docker):code_block[StructValue([(u’code’, u’CONTAINER_REGISTRY_NAME=oci-artifactsrngcloud services enable artifactregistry.googleapis.comrngcloud artifacts repositories create ${CONTAINER_REGISTRY_NAME} \rn –location ${REGION} \rn –repository-format docker’), (u’language’, u”), (u’caption’, <wagtail.wagtailcore.rich_text.RichText object at 0x3eca15b519d0>)])]Create a dedicated Google Cloud Service Account with the fine granular access to that Artifact Registry repository with the roles/artifactregistry.reader role:code_block[StructValue([(u’code’, u’GSA_NAME=oci-artifacts-readerrngcloud iam service-accounts create ${GSA_NAME} \rn –display-name ${GSA_NAME}rngcloud artifacts repositories add-iam-policy-binding ${CONTAINER_REGISTRY_NAME} \rn –location ${REGION} \rn –member “serviceAccount:${GSA_NAME}@${PROJECT}.iam.gserviceaccount.com” \rn –role roles/artifactregistry.reader’), (u’language’, u”), (u’caption’, <wagtail.wagtailcore.rich_text.RichText object at 0x3eca15b51090>)])]Allow Config Sync to synchronize resources for a specific RootSync:code_block[StructValue([(u’code’, u’ROOT_SYNC_NAME=root-sync-ocirngcloud iam service-accounts add-iam-policy-binding \rn –role roles/iam.workloadIdentityUser \rn –member “serviceAccount:${PROJECT}.svc.id.goog[config-management-system/root-reconciler-${ROOT_SYNC_NAME}]” \rn ${GSA_NAME}@${PROJECT}.iam.gserviceaccount.com’), (u’language’, u”), (u’caption’, <wagtail.wagtailcore.rich_text.RichText object at 0x3eca26ce6cd0>)])]Login to Artifact Registry so you can push OCI artifacts to it in a later step:code_block[StructValue([(u’code’, u’gcloud auth configure-docker ${REGION}-docker.pkg.dev’), (u’language’, u”), (u’caption’, <wagtail.wagtailcore.rich_text.RichText object at 0x3eca26ce61d0>)])]Build and sync an OCI artifactNow that you have completed your setup, let’s illustrate our first scenario where you want to sync a Namespace resource as an OCI image.Create a Namespace resource definition:code_block[StructValue([(u’code’, u’cat <<EOF> test-namespace.yamlrnapiVersion: v1rnkind: Namespacernmetadata:rn name: testrnEOF’), (u’language’, u”), (u’caption’, <wagtail.wagtailcore.rich_text.RichText object at 0x3eca26ce6350>)])]Create an archive of that file:code_block[StructValue([(u’code’, u’tar -cf test-namespace.tar test-namespace.yaml’), (u’language’, u”), (u’caption’, <wagtail.wagtailcore.rich_text.RichText object at 0x3eca26ce6990>)])]Push that artifact to Artifact Registry. In this tutorial, we use oras, but there are other tools that you can use like crane.code_block[StructValue([(u’code’, u’oras push \rn ${REGION}-docker.pkg.dev/${PROJECT}/${CONTAINER_REGISTRY_NAME}/my-namespace-artifact:v1 \rn test-namespace.tar’), (u’language’, u”), (u’caption’, <wagtail.wagtailcore.rich_text.RichText object at 0x3eca26ce6290>)])]Set up Config Sync to deploy this artifact from Artifact Registry:code_block[StructValue([(u’code’, u’cat << EOF | kubectl apply -f -rnapiVersion: configsync.gke.io/v1beta1rnkind: RootSyncrnmetadata:rn name: ${ROOT_SYNC_NAME}rn namespace: config-management-systemrnspec:rn sourceFormat: unstructuredrn sourceType: ocirn oci:rn image: ${REGION}-docker.pkg.dev/${PROJECT}/${CONTAINER_REGISTRY_NAME}/my-namespace-artifact:v1rn dir: .rn auth: gcpserviceaccountrn gcpServiceAccountEmail: ${GSA_NAME}@${PROJECT}.iam.gserviceaccount.comrnEOF’), (u’language’, u”), (u’caption’, <wagtail.wagtailcore.rich_text.RichText object at 0x3eca14f1eb10>)])]Check the status of the sync with the nomos tool:code_block[StructValue([(u’code’, u’nomos status –contexts $(k config current-context)’), (u’language’, u”), (u’caption’, <wagtail.wagtailcore.rich_text.RichText object at 0x3eca14f1ef50>)])]Verify that the Namespace test is synced:code_block[StructValue([(u’code’, u’kubectl get ns test’), (u’language’, u”), (u’caption’, <wagtail.wagtailcore.rich_text.RichText object at 0x3eca14f1e990>)])]And voilà! You just synced a Namespace resource as an OCI artifact with Config Sync.Build and sync a Helm chartNow, let’s see how you could deploy a Helm chart hosted in a private Artifact Registry.Create a simple Helm chart:code_block[StructValue([(u’code’, u’helm create test-chart’), (u’language’, u”), (u’caption’, <wagtail.wagtailcore.rich_text.RichText object at 0x3eca25ff7f50>)])]Package the Helm chart:code_block[StructValue([(u’code’, u’helm package test-chart –version 0.1.0′), (u’language’, u”), (u’caption’, <wagtail.wagtailcore.rich_text.RichText object at 0x3eca2434b150>)])]Push the chart to Artifact Registry:code_block[StructValue([(u’code’, u’helm push \rn test-chart-0.1.0.tgz \rn oci://${REGION}-docker.pkg.dev/${PROJECT}/${CONTAINER_REGISTRY_NAME}’), (u’language’, u”), (u’caption’, <wagtail.wagtailcore.rich_text.RichText object at 0x3eca1580b890>)])]Set up Config Sync to deploy this Helm chart from Artifact Registry:code_block[StructValue([(u’code’, u’cat << EOF | kubectl apply -f -rnapiVersion: configsync.gke.io/v1beta1rnkind: RootSyncrnmetadata:rn name: ${ROOT_SYNC_NAME}rn namespace: config-management-systemrnspec:rn sourceFormat: unstructuredrn sourceType: helmrn helm:rn repo: oci://${REGION}-docker.pkg.dev/${PROJECT}/${CONTAINER_REGISTRY_NAME}rn chart: test-chartrn version: 0.1.0rn releaseName: test-chartrn namespace: defaultrn auth: gcpserviceaccountrn gcpServiceAccountEmail: ${GSA_NAME}@${PROJECT}.iam.gserviceaccount.comrnEOF’), (u’language’, u”), (u’caption’, <wagtail.wagtailcore.rich_text.RichText object at 0x3eca1580b290>)])]Check the status of the sync with the nomos tool:code_block[StructValue([(u’code’, u’nomos status –contexts $(k config current-context)’), (u’language’, u”), (u’caption’, <wagtail.wagtailcore.rich_text.RichText object at 0x3eca1580bc10>)])]Verify that the resources in the Namespace test-chart are synced:code_block[StructValue([(u’code’, u’kubectl get all -n default’), (u’language’, u”), (u’caption’, <wagtail.wagtailcore.rich_text.RichText object at 0x3eca25bd62d0>)])]And voilà! You just synced an Helm chart with Config Sync.Towards more scalability and securityIn this blog, you synced both an OCI artifact and an Helm chart with Config Sync.OCI registries and OCI artifacts are new kids on the block that can also work alongside with the Git option depending on your needs and use-cases. One of such patterns could be Git  still acting as the source of truth for the declarative configs in addition to the well established developer workflow it provides: pull request, code review, branch strategy, etc.The continuous integration pipelines, triggered by pull requests or merges, will run tests against the declarative configs to eventually push the OCI artifacts in an OCI registry.Finally, the continuous reconciliation of GitOps will take it from here and will reconcile between the desired state, now stored in an OCI registry, with the actual state, running in Kubernetes. Your Kubernetes manifests as OCI artifacts are now just seen like any container images for your Kubernetes clusters as they are pulled from OCI registries. This continuous reconciliation from OCI registries, not interacting with Git, has a lot of benefits in terms of scalability, performance and security as you will be able to configure very fine grained access to your OCI artifacts.To get started, check out the two Sync OCI artifacts from Artifact Registry and the Sync Helm charts from OCI registries features today.You could also find this other tutorial showing how you can package and push an Helm chart to GitHub Container Registry with GitHub actions, and then how you can deploy this Helm chart with Config Sync.Attending KubeCon + CloudNativeCon North America 2022 in October? Come check out our session Build and Deploy Cloud Native (OCI) Artifacts, the GitOps Way during the GitOpsCon North America 2022 co-located event on October, 25th. Hope to see you there!Config Sync is open sourced. We are open to contributions and bug fixes if you want to get involved in the development of Config Sync. You can also use the repository to track ongoing work, or build from source to try out bleeding-edge functionalities.Related ArticleGoogle Cloud at KubeCon EU: New projects, updated services, and how to connectEngage with experts and learn more about Google Kubernetes Engine at KubeCon EU.Read Article
Quelle: Google Cloud Platform

Announcing Pub/Sub metrics dashboards for improved observability

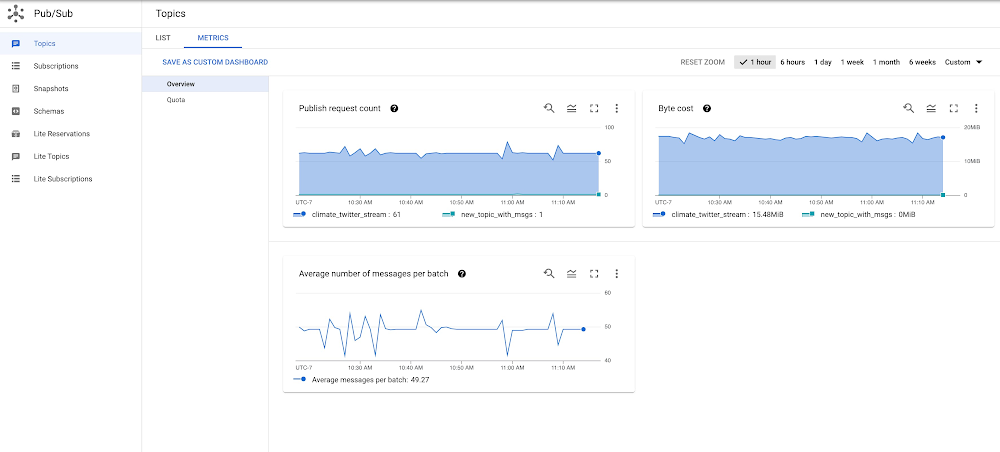
Pub/Sub offers a rich set of metrics for resource and usage monitoring. Previously, these metrics were like buried treasure: they were useful to understand Pub/Sub usage, but you had to dig around to find them. Today, we are announcing out-of-the-box Pub/Sub metrics dashboards that are accessible with one click from the Topics and Subscriptions pages in the Google Cloud Console. These dashboards provide more observability in context and help you build better solutions with Pub/Sub.Check out our new one-click monitoring dashboardsThe Overview section of the monitoring dashboard for all the topics in your project.We added metrics dashboards to monitor the health of all your topics and subscriptions in one place, including dashboards for individual topics and subscriptions. Follow these steps to access the new monitoring dashboards:To view the monitoring dashboard for all the topics in your project, open the Pub/Sub Topics page and click the Metrics tab. This dashboard has two sections: Overview and Quota.To view the monitoring dashboard for a single topic, in the Pub/Sub Topics page, click any topic to display the topic detail page, and then click the Metrics tab. This dashboard has up to three sections: Overview, Subscriptions, and Retention (if topic retention is enabled).To view the monitoring dashboard for all the subscriptions in your project, open the Pub/Sub Subscriptions page and click the Metrics tab. This dashboard has two sections: Overview and Quotas.To view the monitoring dashboard for a single subscription, in the Pub/Sub Subscriptions page, click any subscription to display the subscription detail page, and then click the Metrics tab. This dashboard has up to four sections: Overview, Health, Retention (if acknowledged message retention is enabled), and either Pull or Push depending on the delivery type of your subscription.A few highlightsWhen exploring the new Pub/Sub metrics dashboard, here are a few examples of things you can do. Please note that these dashboards are a work in progress, and we hope to update them based on your feedback. To learn about recent changes, please refer to the Pub/Sub monitoring documentation.The Overview section of the monitoring dashboard for a single topic.As you can see, the metrics available in the monitoring dashboard for a single topic are closely related to one another. Roughly speaking, you can obtain Publish throughput in bytes by multiplying Published message count and Average message size. Because a publish request is made up of a batch of messages, dividing Published messages by Publish request count gets you Average number of messages per batch. Expect a higher number of published messages than publish requests if your publisher client has batching enabled. Some interesting questions you can answer by looking at the monitoring dashboard for a single topic are: Did my message sizes change over time?Is there a spike in publish requests?Is my publish throughput in line with my expectations?Is my batch size appropriate for the latency I want to achieve, given that larger batch sizes increase publish latency?The Overview section of the monitoring dashboard for a single subscription.You can find a few powerful composite metrics in the monitoring dashboard for a single subscription. These metrics are Delivery metrics, Publish to ack delta, and Pull to ack delta. All three aim to give you a sense of how well your subscribers are keeping up with incoming messages. Delivery metrics display your publish, pull, and acknowledge (ack) rate next to each other. Pull to ack delta and Publish to ack delta offer you the opportunity to drill down to any specific bottlenecks. For example, if your subscribers are pulling messages a lot faster than they are acknowledging them, expect the values reported in Pull to ack delta to be mostly above zero. In this scenario, also expect both your Unacked messages by region and your Backlog bytes to grow. To remedy this situation, you can increase your message processing power or setting up subscriber flow control.The Health section of the monitoring dashboard for a single subscription.Another powerful composite metric available in the monitoring dashboard for a single subscription is the Delivery latency health score in the Health section. You may treat this metric as a one-stop shop to examine the health of your subscription. This metric tracks a total of five properties; each can take a value of zero or one. If your subscribers are not keeping up, zero scores for “ack_latency” and/or “expired_ack_deadlines” effectively tell you that those properties are the reason why. We prescribe how to fix these failing scores in our documentation. If your subscription is run by a managed service like Dataflow, do not be alarmed by a “utilization” score of zero. With Dataflow, the number of streams open to receive messages is optimized, so the recommendation to open more streams does not apply. Some questions you can answer by looking at your monitoring dashboard for a single subscription are: What is the 99th percentile of my ack latencies? Is the majority of my messages getting acknowledged in under a second, allowing my application to run in near real-time? How well are my subscribers keeping up with my publishers? Which region has a growing backlog? How frequently are my subscribers allowing a message’s ack deadline to expire?Customize your monitoring experienceHopefully the existing dashboards are enough to diagnose a problem. But maybe you need something slightly different. If that’s the case, from the dropdown menu, click Save as Custom Dashboard to save an entire dashboard in your list of monitoring dashboards, or click Add to Custom Dashboard in a specific chart to save the chart to a custom dashboard. Then, in the custom dashboard, you can edit any chart configuration or MQL query. For example, by default, the Top 5 subscriptions by ack message count chart in the Subscriptions section of the monitoring dashboard for a single topic shows the top five attached subscriptions with the highest rate of acked messages. You can modify the dashboard to show the top ten subscriptions. To make the change, export the chart, click on the chart, and edit the line of MQL “| top 5, .max()” to “| top 10, .max()”. To know more about editing in MQL, see Using the Query Editor | Cloud Monitoring.For a slightly more complex example, you can build a chart that compares current data to past data. For example, consider the Byte Cost chart in the Overview section of the monitoring dashboard for all topics. You can view the chart in Metrics Explorer. In the MQL tab, add the following lines at the end of the provided code snippet:code_block[StructValue([(u’code’, u’| {rn add [when: “now”]rn ;rn add [when: “then”] | time_shift 1drn }rn| union’), (u’language’, u”), (u’caption’, <wagtail.wagtailcore.rich_text.RichText object at 0x3e526daee9d0>)])]The preceding lines turn the original chart to a comparison chart that compares data at the same time on the previous day. For example, if your Pub/Sub topic consists of application events like requests for cab rides, data from the previous day can be a nice baseline for current data and can help you set the right expectations for your business or application for the current day. If you’d prefer, update the chart type to a Line chart for easier comparison. Set alertsQuota limits can creep up on you when you least expect it. To prevent this, you can set up alerts that will notify you once you hit certain thresholds. The Pub/Sub dashboards have a built-in function to help you set up these alerts. First, access the Quota section in one of the monitoring dashboards for topics or subscriptions. Then, click Create Alert inside the Set Quota Alert card at the top of the dashboard. This will take you to the alert creation form with an MQL query that triggers for any quota metric exceeding 80% capacity (the threshold can be modified).The Quota section of the monitoring dashboard for all the topics in your project.In fact, all the provided charts support setting alerting policies. You can set up your alerting policies by first exporting a chart to a custom dashboard and then selecting Convert a provided chart to an alert chart, using the dropdown menu.Convert a provided chart to an alert chart.For example, you might want to trigger an alert if the pull to ack delta is positive more than 90% of the time during a 12-hour period. This would indicate that your subscription is frequently pulling messages faster than it is acknowledging them. First, export the Pull to Ack Delta chart to a custom dashboard, convert it to an alert chart, and add the following line of code at the end of the provided MQL query:| condition gt(val(), 0)Then, click Configure trigger. Set the Alert trigger to Percent of time series violates, the Minimum percent of time series in violation to 90%, and Trigger when condition is met for this amount of time to 12 hours. If the alert is created successfully, you should see a new chart with a red horizontal line representing the threshold with a text bubble that tells you if there have been any open incidents violating the condition. You can also add an alert for the Oldest unacked message metric. Pub/Sub lets you set a message retention period on your subscriptions. Aim to keep your oldest unacked messages within the configured subscription retention period, and fire an alert when messages are taking longer than expected to be processed. Making metrics dashboards that are easy to use and serve your needs is important for us. We welcome your feedback and suggestions for any of the provided dashboards and charts. You can reach us by clicking on the question icon on the top right corner in Cloud Console and choosing Send feedback. If you really like a chart, please let us know too! We will be delighted to hear from you.Related ArticleHow Pub/Sub eliminates boring meetings and makes your systems scaleWhat is Cloud Pub/Sub? A messaging service for application and data integration!Read Article
Quelle: Google Cloud Platform

Sign up for the Google Cloud Fly Cup Challenge

Are you ready to take your cloud skills to new heights? We’re excited to announce the Google Cloud Fly Cup Challenge, created in partnership with The Drone Racing League (DRL) and taking place at Next ‘22 to usher in the new era of tech-driven sports. Using DRL race data and Google Cloud analytics tools, developers of any skill level will be able to predict race outcomes and provide tips to DRL pilots to help enhance their season performance. Participants will compete for a chance to win an all-expenses-paid trip to the season finale of the DRL World Championship Race and be crowned the champion on stage.  How it works: Register for Next 2022 and navigate to the Developer Zone challenges to unlock the gameComplete each stage of the challenge to advance and climb the leaderboardWin prizes, boost skills and have fun!There will be three stages of the competition, and each will increase in level of difficulty. The first stage kicks off on September 15th, where developers will prepare data and become more familiar with the tools for data-driven analysis and predictions with Google ML Tools. There are over 500 prizes up for grabs, and all participants will receive an exclusive custom digital badge, and an opportunity to be celebrated for their achievements alongside DRL Pilots. There will be one leaderboard that will cumulate scores throughout the competition and prizes will be awarded as each stage is released. Stage 1: DRL Recruit: Starting on September 15th, start your journey here to get an understanding of DRL data by loading and querying race statistics. You will build simple reports to find top participants and fastest race times. Once you pass this lab you will be officially crowned a DRL recruit and progress for a chance to build on your machine learning skills and work with two more challenge labs involving predictive ML models. Prize: The top 25 on the leaderboard will win custom co-branded DRL + Google Cloud merchandise.Stage 2: DRL Pilot: Opening in conjunction with the first day of Next 2022 on October 11, in this next stage you will develop a model which can predict a winner in a head to head competition and a score for each participant, based on a pilots profile and flight history. Build a “pilot profile card” that analyzes the number of crashes and lap times and compares it to other pilots. Fill out their strengths and weaknesses and compare them to real life performances, and predict the winner of the DRL Race in the Cloud at Next 2022, and be crowned top developer for this stage.Prize: The first 500 participants to complete stage 2 of the contest will receive codes to download DRL’s Simulator on Steam.Stage 3: DRL Champion: Continue this journey throughout the DRL championship season. Using the model developed in Stage 2. Use data from past races to score participants and predict outcomes. Provide pilots with real life tips and tricks to help improve their performance. The developer at the top of the leaderboard at the end of December 2022 will win an expenses-paid VIP trip to DRL’s final race in early 2023. Prize: Finish in the top 3 for an opportunity to virtually present your tips and tricks to professional DRL Pilots before the end of the 2022-2023 race seasonTop the leaderboard as the Grand Champion and win an expenses paid VIP experience to travel to a DRL Championship Race in early 2023 and be celebrated on stage. For more information on prizes and terms please visit the DRL and Google Cloud website.  Ready to Fly? The Google Cloud Fly Cup Challenge opens today and will remain available on the Next ‘22 portal through December 31, 2022 when the winner will be announced. We are looking forward to seeing how you innovate and build together for the next era of tech-driven sports. Let’s fly!
Quelle: Google Cloud Platform

Try out Cloud Spanner databases at no cost with new free trial instances

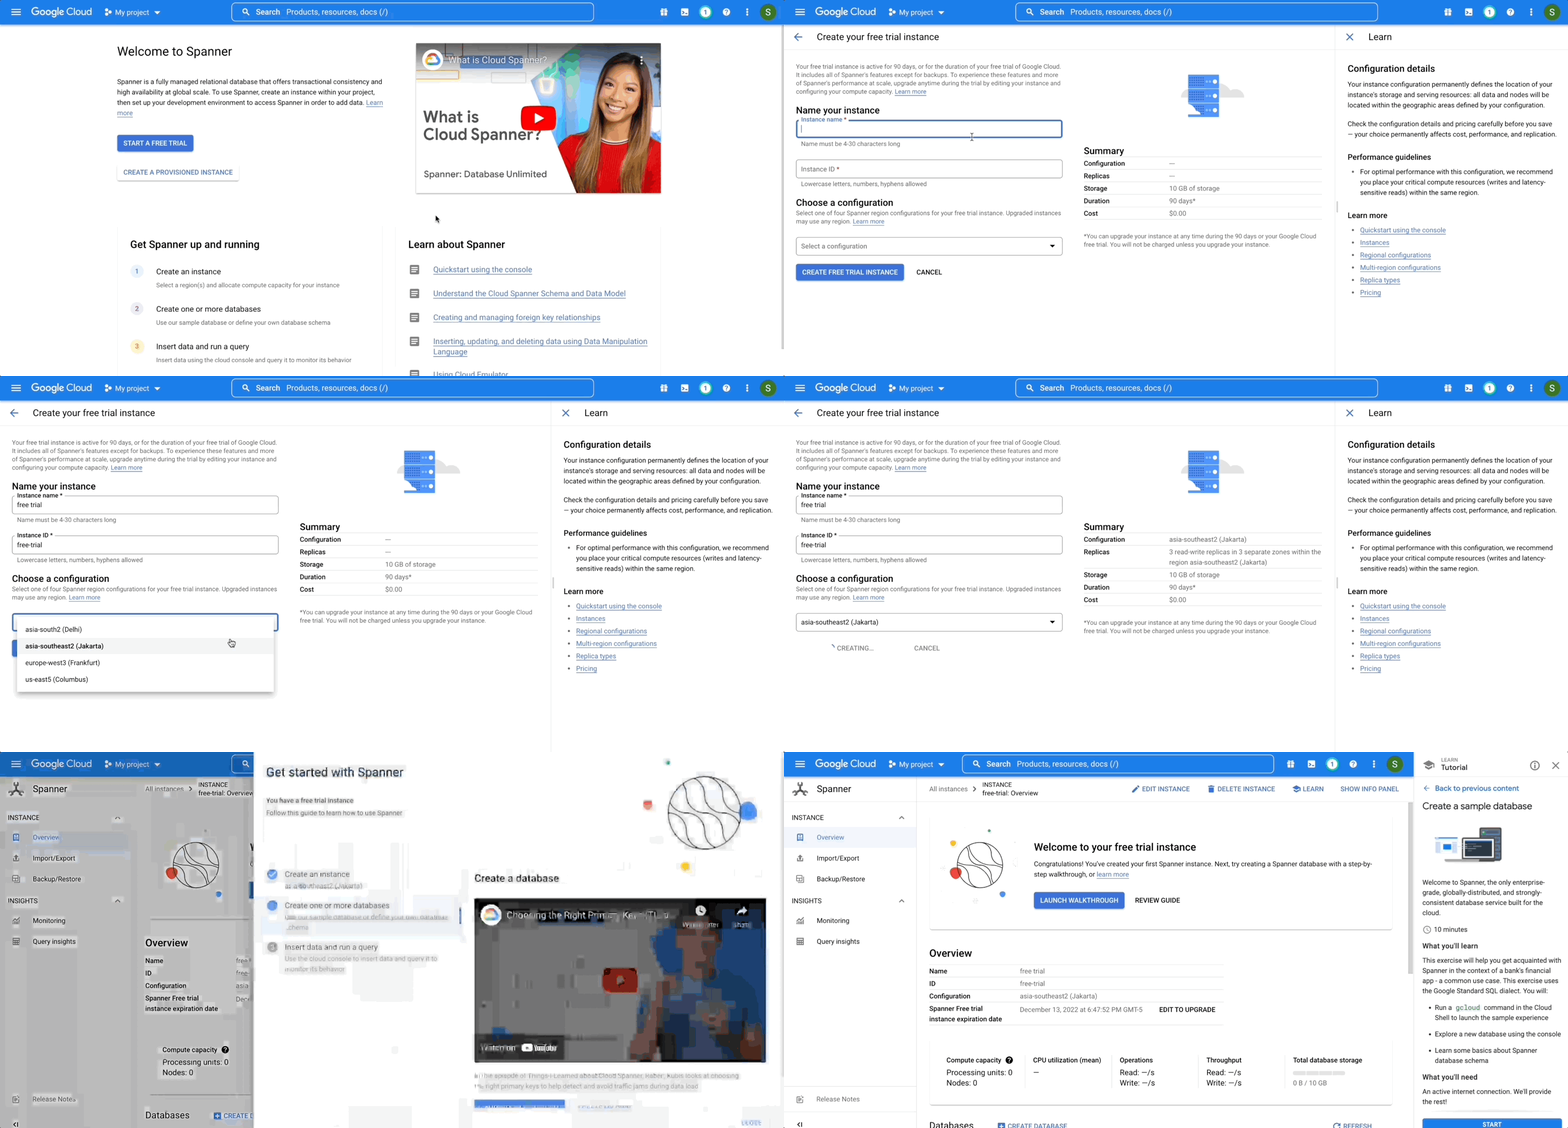
We are excited to announce Cloud Spanner free trial instances to give everyone an opportunity to try out Spanner at no cost for 90 days. Spanner is a fully managed relational database created by Google that provides the highest levels of consistency and availability at any scale. Developers love Spanner for its ease of use and its ability to automatically handle replication, sharding, disaster recovery, and strongly consistent transaction processing. Organizations across industries including finance, retail, gaming, and healthcare are using Spanner to modernize their tech stack, transform the end user experience, and innovate quickly to uncover new possibilities. Now any developer or organization can try Spanner hands-on at no cost with the Spanner free trial instance. Watch this short video to learn more about the Spanner free trial and get started today.The Spanner free trial provides a Spanner instance where users can create GoogleSQL or PostgreSQL-dialect databases, explore Spanner capabilities, and prototype an application to run on Spanner. To make it easier for developers to evaluate Spanner, the free trial instance comes with built-in guided tutorials in the Google Cloud console. These tutorials provide step-by-step guidance to create a database, load predefined schema and data, and run sample queries and transactions so that users can quickly get started with Spanner and learn key concepts. Making Spanner more accessible for every developer and workload Our mission is to make Spanner’s unique benefits accessible to every developer and organization. So, we are making it easier, faster, and cost effective for everyone to use Spanner for applications big and small. We launched the PostgreSQL interface for Spanner so that users can build transformative applications with the fully managed experience of Spanner while using the familiar PostgreSQL dialect. We introduced Committed Use Discounts (CUDs) that give up to 40% discount to help users reduce their database costs. We also reduced the cost of entry for production workloads with granular instance sizing to make enterprise-grade production-ready databases available starting at approximately $65 per month. Users can even lower the cost to $40 per month by combining granular instance sizing and committed use discounts! With the launch of the Spanner free trial instance, users now have the opportunity to explore its capabilities without any upfront costs. Further, we make it easy for users to seamlessly upgrade from the free trial instance to a paid instance and scale without requiring any re-architecture and downtime. Get started with Spanner free trial in minutesBoth existing and new Google Cloud users are eligible for the Spanner free trial. If you are an existing Google Cloud user (i.e. if you have an active Google Cloud Billing account), you are ready to create your Spanner free trial instance. If you are a new Google Cloud user, you need to create a Cloud Billing account first that gives you eligibility to create a Spanner free trial instance as well as receive $300 in free credits to use on one or a combination of Google Cloud products. A billing account is required for verification of identity. Don’t worry, you are not charged until you choose to upgrade your Spanner free trial instance. Getting started takes just a few steps: you can create a free trial instance using Google Cloud console or the gcloud CLI.Using the Google Cloud Console, click “Start a free trial”, and simply enter the name and select the region of your free trial instance. A Spanner instance represents the resource in which you can create your databases while the region represents the geographic location where your databases are stored and replicated. Free trial instances are available in selected regions in the US, Europe, and Asia. If you prefer different regions or a multi-region configuration, create a paid Spanner instance instead.Once you create your free trial instance, you can start using Spanner by launching a step-by-step tutorial in the console that provides guidance on database creation and schema design. Tutorials also help you understand the salient features of Spanner such as interleaved tables and secondary indexes that help in realizing the true power of Spanner.Free trial instances are meant for learning and exploring Spanner. They are limited to a 10 GB storage capacity and a 90-day trial duration. Spanner Service Level Agreement (SLA) doesn’t apply to your free trial instances. Once you familiarize yourself with Spanner using the free trial, you can seamlessly upgrade the free trial instance to a paid instance with SLA guarantees to continue with your proof of concept, or to run your production workload. Furthermore, upgrading your free trial instance gives you the full benefits of Spanner such as creating multi-region configurations and scaling without limits. Get startedIt has never been easier to try out Spanner. With the free trial instance, you can try out Spanner at no cost for 90 days. You can even prototype an entire application for free on Google Cloud by using the Spanner free trial along with the free tier offered by other Google Cloud products such as Compute Engine and BigQuery.  Create a 90-day Spanner free trial instance. Try Spanner free . Take a deep dive into the new trial experience and learn more about how Spanner provides unlimited scale and up to 99.999% availability.Related ArticleCome for the sample app, stay for the main course: Cloud Spanner free trial instancesCloud Spanner now offers free trial instances with sample data and guided tutorials to try the fully managed relational database.Read Article
Quelle: Google Cloud Platform