Building a Machine Learning Platform with Kubeflow and Ray on Google Kubernetes Engine

Increasingly more enterprises adopt Machine Learning (ML) capabilities to enhance their services, products, and operations. As their ML capabilities mature, they build centralized ML Platforms to serve many teams and users across their organization. Machine learning is inherently an experimental process requiring repeated iterations. An ML Platform standardizes the model development and deployment workflow to offer greater consistency for the repeated process. This facilitates productivity and reduces time from prototype to production.When first trying ML in the cloud, many practitioners will start with fully managed ML platforms like Google Cloud’s Vertex AI. Fully-managed platforms abstract out many complexities to simplify the end-to-end workflow. However, like with most decisions, there are tradeoffs. Organizations may choose to build their own custom, self-managed ML platform for various reasons such as control and flexibility. Building your own platform gives you more control over your resources. You can implement unique resource utilization constraints, access permissions, and infrastructure strategies that fit your organization’s specific needs. You also get more flexibility over tools and frameworks. Since the system is completely open, you can integrate any ML tools that you already are using. And lastly, these benefits help avoid vendor lock-in because cloud-native platforms are by definition portable across cloud providers.For self-managed ML Platforms, Open Source Software is an important driver of digital innovation. If you are following the evolution of ML technologies, then you are probably aware of the ever growing ecosystem of Open Source Machine Learning frameworks, platforms, and tools. However, no single Open Source library delivers a complete ML solution, so we must integrate multiple Open Source projects to build an ML platform.To start building an ML Platform, it should support the basic ML user journey of notebook prototyping to scaled training to online serving. For organizations with multiple teams, it additionally needs to support administrative requirements of multi-user support with identity-based authentication and authorization. Two popular Open Source projects – Kubeflow and Ray – together can support these needs. Kubeflow provides the multi-user environment and interactive notebook management. Ray orchestrates distributed computing workloads across the entire ML lifecycle, including training and serving.Google Kubernetes Engine (GKE) simplifies deploying Open Source ML software in the cloud with autoscaling and auto-provisioning. GKE reduces the effort to deploy and manage the underlying infrastructure at scale and offers the flexibility to use your ML frameworks of choice. In this article, we will show how Kubeflow and Ray can be  assembled into a seamless experience. We will demonstrate how platform builders can deploy them both to GKE to provide a comprehensive, production-ready ML platform.Kubeflow and RayFirst, let’s take a closer look at these two Open Source projects. While both Kubeflow and Ray deal with the problem of enabling ML at scale, they focus on very different aspects of the puzzle.Kubeflow is a Kubernetes-native ML platform aimed at simplifying the build-train-deploy lifecycle of ML models. As such, its focus is on general MLOps. Some of the unique features offered by Kubeflow include:Built-in integration with Jupyter notebooks for prototypingMulti-user isolation supportWorkflow orchestration with Kubeflow PipelinesIdentity-based authentication and authorization through Istio IntegrationOut-of-the-box integration with major cloud providers such as GCP, Azure, and AWSSource: https://www.kubeflow.org/docs/started/architecture/Ray is a general-purpose distributed computing framework with a rich set of libraries for large scale data processing, model training, reinforcement learning, and model serving. It is popular with customers as a simple API for building and scaling AI and Python workloads. Its focus is on the application itself – allowing users to build distributed computing software with a unified and flexible set of APIs. Some of the advanced libraries offered by Ray include:RLLib for reinforcement learningRay Tune for hyperparameter tuningRay Train for distributed deep learningRay Serve for scalable model servingRay Data for preprocessingSource: https://docs.ray.io/en/latest/index.html#what-is-rayIt should be noted that Ray is not a Kubernetes-native project. In order to deploy Ray on Kubernetes, the Open Source community has created KubeRay, which is exactly what it sounds like – a toolkit for deploying Ray in Kubernetes. KubeRay offers a powerful set of tools that include many great features, like custom resource APIs and a scalable operator. You can learn more about it here.Now that we have examined the differences between Kubeflow and Ray, you might be asking which is the right platform for your organization. Kubeflow’s MLOps capabilities and Ray’s distributed computing libraries are both independently useful with different advantages. What if we can combine the benefits of both systems? Imagine having an environment that:Supports Ray Train with autoscaling and resource provisioningIntegrated with identity-based authentication and authorizationSupports multi-user isolation and collaborationContains an interactive notebook serverLet’s now take a look at how we can put these two platforms together and take advantage of the  useful features offered by each. Specifically, we will deploy Kuberay in a GKE cluster installed with Kubeflow. The system looks something like this:In this system, the Kubernetes cluster is partitioned into logically-isolated workspaces, called “profiles”. Each new user will create their own profile, which is a container for all their resources in this Kubernetes cluster. The user can then provision their own resources within their designated namespace, including Ray Clusters and Jupyter Notebooks. If the user’s resources are provisioned through the Kubeflow dashboard, then Kubeflow will automatically place these resources in their profile namespace.Under this setup, each Ray cluster is by default protected by role-based access control policies (with Istio) preventing unauthorized access. This allows each user to interact with their own Ray clusters independently of each other, and allows them to share Ray clusters with other team members.For this setup, I used the following versions:Google Kubernetes Engine 1.21.12-gke.2200 Kubeflow 1.5.0Kuberay 0.3.0Python 3.7Ray 1.13.1The configuration files used for this deployment can be found here.Deploying Kubeflow and KuberayFor deploying Kubeflow, we will be using the GCP instructions here. For simplicity purposes, I have used mostly default configuration settings. You can freely experiment with customizations before deploying, for example, you can enable GPU nodes in your cluster by following these instructions.Deploying the KubeRay operator is pretty straightforward. We will be using the latest released version:code_block[StructValue([(u’code’, u’export KUBERAY_VERSION=v0.3.0rnkubectl create -k “github.com/ray-project/kuberay/manifests/cluster-scope-resources?ref=${KUBERAY_VERSION}”rnkubectl apply -k “github.com/ray-project/kuberay/manifests/base?ref=${KUBERAY_VERSION}”‘), (u’language’, u”), (u’caption’, <wagtail.wagtailcore.rich_text.RichText object at 0x3e086da8cd90>)])]This will deploy the KubeRay operator in the “ray-systems” namespace in your cluster.Creating Your Kubeflow User ProfileBefore you can deploy and use resources in Kubeflow, you need to first create your user profile. If you follow the GKE installation instructions, you should be able to navigate to https://[cluster].endpoints.[project].cloud.goog/ in your browser, where [cluster] is the name of your GKE cluster and [project] is your GCP project name.This should redirect you to a web page where you can use your GCP credentials to authenticate yourself.Follow the dialogue, and Kubeflow will create a namespace with you as the administrator. We’ll discuss later in this article how to invite others to your workspace.Build the Ray Worker ImageNext, let’s build the image we’ll be using for the Ray cluster. Ray is very sensitive when it comes to version compatibility (for example, the head and worker nodes must use the same versions of Ray and Python), so it is highly recommended to prepare and version-control your own worker images. Look for the base image you want from their Docker page here: rayproject/ray – Docker Image. The following is a functioning worker image using Ray 1.13 and Python 3.7:code_block[StructValue([(u’code’, u’FROM rayproject/ray:1.13.1-py37rnrnRUN pip install numpy tensorflowrnrnCMD [“bin/bash”]’), (u’language’, u”), (u’caption’, <wagtail.wagtailcore.rich_text.RichText object at 0x3e088f6f98d0>)])]Here is the same Dockerfile for a worker image running on GPUs if you prefer GPUs instead of CPUs:code_block[StructValue([(u’code’, u’FROM rayproject/ray:1.13.1-py37-gpurnrnRUN pip install numpy tensorflowrnrnCMD [“bin/bash”]’), (u’language’, u”), (u’caption’, <wagtail.wagtailcore.rich_text.RichText object at 0x3e088e75b9d0>)])]Use Docker to build and push both images to your image repository:code_block[StructValue([(u’code’, u’$ docker build -t <path-to-your-image> -f Dockerfile .rn$ docker push <path-to-your-image>’), (u’language’, u”), (u’caption’, <wagtail.wagtailcore.rich_text.RichText object at 0x3e088e75b790>)])]Build the Jupyter Notebook ImageSimilarly we need to build the notebook image that we are going to use. Because we are going to use this notebook to interact with the Ray cluster, we need to ensure that it uses the same version of Ray and Python as the Ray workers.The Kubeflow example Jupyter notebooks can be found at Example Notebook Servers. For this example, I changed the PYTHON_VERSION in components/example-notebook-servers/jupyter/Dockerfile to the following:code_block[StructValue([(u’code’, u’ARG MINIFORGE_VERSION=4.10.1-4rnARG PIP_VERSION=21.1.2rnARG PYTHON_VERSION=3.7.10′), (u’language’, u”), (u’caption’, <wagtail.wagtailcore.rich_text.RichText object at 0x3e088e75b110>)])]Use Docker to build and push the notebook image to your image repository, similar to the previous step:code_block[StructValue([(u’code’, u’$ docker build -t <path-to-your-image> -f Dockerfile .rn$ docker push <path-to-your-image>’), (u’language’, u”), (u’caption’, <wagtail.wagtailcore.rich_text.RichText object at 0x3e086da8c450>)])]Deploy a Ray ClusterNow we are ready to configure and deploy our Ray cluster.1. Copy the following sample yaml file from GitHub:code_block[StructValue([(u’code’, u’curl https://github.com/richardsliu/ray-on-gke/blob/main/manifests/ray-cluster.serve.yaml -o ray-cluster.serve.yaml’), (u’language’, u”), (u’caption’, <wagtail.wagtailcore.rich_text.RichText object at 0x3e086db809d0>)])]2. Edit the settings in the file:a. For the user namespace, change the value to match with your Kubeflow profile name:code_block[StructValue([(u’code’, u’namespace: %your_name%’), (u’language’, u”), (u’caption’, <wagtail.wagtailcore.rich_text.RichText object at 0x3e086e369850>)])]b. For the Ray head and worker settings, change the value to point to the image you have built previously:code_block[StructValue([(u’code’, u’image: %your_image%’), (u’language’, u”), (u’caption’, <wagtail.wagtailcore.rich_text.RichText object at 0x3e086da8c550>)])]c. Edit resource requests and limits, as required. For example, you can change the CPU or GPU requirements for worker nodes here:code_block[StructValue([(u’code’, u’resources: rn limits:rn cpu: 1rn requests:rn cpu: 200m’), (u’language’, u”), (u’caption’, <wagtail.wagtailcore.rich_text.RichText object at 0x3e086da8c0d0>)])]3. Deploy the cluster:code_block[StructValue([(u’code’, u’kubectl apply -f raycluster.serve.yaml’), (u’language’, u”), (u’caption’, <wagtail.wagtailcore.rich_text.RichText object at 0x3e088d5f6a10>)])]4. Your cluster should be ready to go momentarily. If you have enabled node auto-provisioning on your GKE cluster, you should be able to see the cluster dynamically scale up and down according to usage. You can check the status of your cluster by doing:code_block[StructValue([(u’code’, u’$ kubectl get pods -n <user name>rnNAME READY STATUS RESTARTS AGErnexample-cluster-head-8cbwb 1/1 Running 0 12srnexample-cluster-worker-large-group-75lsr 1/1 Running 0 12srnexample-cluster-worker-large-group-jqvtp 1/1 Running 0 11srnexample-cluster-worker-large-group-t7t4n 1/1 Running 0 12s’), (u’language’, u”), (u’caption’, <wagtail.wagtailcore.rich_text.RichText object at 0x3e088d5f6490>)])]You can also verify that the service endpoints are created:code_block[StructValue([(u’code’, u’$ kubectl get services -n <user name>rnNAME TYPE CLUSTER-IP EXTERNAL-IP PORT(S) AGErnexample-cluster-head-svc ClusterIP 10.52.9.88 <none> 8265/TCP,10001/TCP,8000/TCP,6379/TCP 18s’), (u’language’, u”), (u’caption’, <wagtail.wagtailcore.rich_text.RichText object at 0x3e088d5f6590>)])]Remember this service name – we will come back to it later.Now our ML Platform is all set up and we are ready to start Training a model.Training a ML ModelWe are going to use a Notebook to orchestrate our model training. We can access Ray from a Jupyter notebook session.1. In the Kubeflow dashboard, navigate to the “Notebooks” tab.2. Click on “New Notebook”.3. In the “Image” section, click on “Custom Image”, and input the path to the Jupyter notebook image that you have built here.4. Configure resource requirements for the notebook as needed. The default notebook uses half a CPU and 1G of memory. Note that these resources are only for the notebook session, and not for the Training resources. Later, we use Ray to orchestrated resources at scale on GKE.5. Click on “LAUNCH”.6. When the notebook finishes deploying, click on “Connect” to start a new notebook session.7. Inside the notebook, open a terminal by clicking on File -> New -> Terminal. 8. Install Ray 1.13 in the terminal:code_block[StructValue([(u’code’, u’pip install ray==1.13′), (u’language’, u”), (u’caption’, <wagtail.wagtailcore.rich_text.RichText object at 0x3e086da8c290>)])]9. Now you are ready to run an actual Ray application, using this notebook and the Ray cluster you just deployed in the previous section. I have made a .ipynb file using the canonical Ray trainer example here.10. Run through the cells in the notebook. The magic line that connects to the Ray cluster is:code_block[StructValue([(u’code’, u’ray.init(“ray://example-cluster-head-svc:10001″)’), (u’language’, u”), (u’caption’, <wagtail.wagtailcore.rich_text.RichText object at 0x3e085eda2b50>)])]This should match with the service endpoint that you created earlier. If you have several different Ray clusters, you can simply change the endpoint here to connect to a different one.11. The next few lines will start a Ray Trainer process on the cluster:code_block[StructValue([(u’code’, u’trainer = Trainer(backend=”tensorflow”, num_workers=4)rntrainer.start()rnresults = trainer.run(train_func_distributed)rntrainer.shutdown()’), (u’language’, u”), (u’caption’, <wagtail.wagtailcore.rich_text.RichText object at 0x3e085eda2050>)])]Note here that we specify 4 workers, which matches with our Ray cluster’s number of replicas. If we change this number, the Ray cluster will automatically scale up or down according to resource demands.Serving a ML ModelIn this section we will look at how we can serve the machine learning model that we have just trained in the last section.1. Using the same notebook, wait for the training steps to complete. You should see some output logs with metrics for the model that we have trained.2 Run the next cell:code_block[StructValue([(u’code’, u’serve.start(detached=True, http_options={“host”: “0.0.0.0”})rnTFMnistModel.deploy(TRAINED_MODEL_PATH)’), (u’language’, u”), (u’caption’, <wagtail.wagtailcore.rich_text.RichText object at 0x3e085eda2950>)])]This will start serving the model that we have just trained, using the same service endpoint we created before.3. To verify that the inference endpoint is now working, we can create a new notebook. You can use this one here.4. Note that we are calling the same inference endpoint as before, but using a different port:code_block[StructValue([(u’code’, u’resp = requests.get(rn “http://example-cluster-head-svc:8000/mnist”,rn json={“array”: np.random.randn(28 * 28).tolist()})’), (u’language’, u”), (u’caption’, <wagtail.wagtailcore.rich_text.RichText object at 0x3e088c4398d0>)])]5. You should see the inference results displayed in your notebook session.Sharing the Ray Cluster with OthersNow that you have a functional workspace with an interactive notebook and a Ray cluster, let’s invite others to collaborate.1. On Cloud Console, grant the user minimal cluster access here.2. In the left-hand panel of the Kubeflow dashboard, select “Manage Contributors”.3. In the “Contributors to your namespace” section, enter the email address of the user to whom you are granting access. Press enter.4. That user can now select your namespace and access your notebooks, including your Ray cluster.Using Ray DashboardFinally, you can also bring up the Ray Dashboard using Istio virtual services. Using these steps, you can bring up a dashboard UI inside the Kubeflow central dashboard console:1. Create an Istio Virtual Service config file:code_block[StructValue([(u’code’, u”apiVersion: networking.istio.io/v1alpha3rnkind: VirtualServicernmetadata:rn name: example-cluster-virtual-servicern Namespace: kubeflowrnspec:rn gateways:rn – kubeflow-gatewayrn hosts:rn – ‘*’rn http:rn – match:rn – uri:rn prefix: /example-cluster/rn rewrite:rn uri: /rn route:rn – destination:rn host: example-cluster-head-svc.$(USER_NAMESPACE).svc.localrn port:rn number: 8265″), (u’language’, u”), (u’caption’, <wagtail.wagtailcore.rich_text.RichText object at 0x3e088c439910>)])]Replace $(USER_NAMESPACE) with the namespace of your user profile. Save this to a local file. 2. Deploy the virtual service:code_block[StructValue([(u’code’, u’kubectl apply -f virtual_service.yaml’), (u’language’, u”), (u’caption’, <wagtail.wagtailcore.rich_text.RichText object at 0x3e088c439bd0>)])]3. In your browser window, navigate to https://<host>/_/example-cluster/. The Ray dashboard should be displayed in the window:ConclusionLet’s take a minute to recap what we have done. In this article, we have demonstrated how to deploy two popular ML frameworks, Kubeflow and Ray, in the same GCP Kubernetes cluster. The setup also takes advantage of GCP features like IAP (Identity-Aware Proxy) for user authentication, which protects your applications while simplifying the experience for cloud admins. The end result is a well-integrated and production-ready system that pulls in useful features offered by each system:Orchestrating distributed computing workloads using Ray APIs;Multi-user isolation using Kubeflow;Interactive notebook environment using Kubeflow notebooks;Cluster autoscaling and auto-provisioning using Google Kubernetes EngineWe’ve only scratched the surface of the possibilities, and you can expand from here:Integrations with other MLOps offerings, such as Vertex Model monitoring;Faster and safer image storage and management, through the Artifact Repository;High throughput storage for unstructured data using GCSFuse;Improve network throughput for collective communication with NCCL Fast Socket.We look forward to the growth of your ML Platform and how your team innovates with Machine Learning. Look out for future articles on how to enable additional ML Platform features.Related ArticleEnabling real-time AI with Streaming Ingestion in Vertex AIMany machine learning (ML) use cases, like fraud detection, ad targeting, and recommendation engines, require near real-time predictions….Read Article
Quelle: Google Cloud Platform

Benchmarking your Dataflow jobs for performance, cost and capacity planning

Calling all Dataflow developers, operators and users…So you developed your Dataflow job, and you’re now wondering how exactly will it perform in the wild, in particular:How many workers does it need to handle your peak load and is there sufficient capacity (e.g. CPU quota)?What is your pipeline’s total cost of ownership (TCO), and is there room to optimize performance/cost ratio?Will the pipeline meet your expected service-level objectives (SLOs) e.g. daily volume, event throughput and/or end-to-end latency?To answer all these questions, you need to performance test your pipeline with real data to measure things like throughput and expected number of workers. Only then can you optimize performance and cost. However, performance testing data pipelines is historically hard as it involves: 1) configuring non-trivial environments including sources & sinks, to 2) staging realistic datasets, to 3) setting up and running a variety of tests including batch and/or streaming, to 4) collecting relevant metrics, to 5) finally analyzing and reporting on all tests’ results.We’re excited to share that PerfKit Benchmarker (PKB) now supports testing Dataflow jobs! As an open-source benchmarking tool used to measure and compare cloud offerings, PKB takes care of provisioning (and cleaning up) resources in the cloud, selecting and executing benchmark tests, as well as collecting and publishing results for actionable reporting. PKB is a mature toolset that has been around since 2015 with community effort from over 30 industry and academic participants such as Intel, ARM, Canonical, Cisco, Stanford, MIT and many more.We’ll go over the testing methodology and how to use PKB to benchmark a Dataflow job. As an example, we’ll present sample test results from benchmarking one of the popular Google-provided Dataflow templates, Pub/Sub Subscription to BigQuery template, and how we identified its throughput and optimum worker size. There are no performance or cost guarantees since results presented are specific to this demo use case.Quantifying pipeline performance“You can’t improve what you don’t measure.” One common way to quantify pipeline performance is to measure its throughput per vCPU core in elements per second (EPS). This throughput value depends on your specific pipeline and your data, such as:Pipeline’s data processing stepsPipeline’s sources/sinks (and their configurations/limits)Worker machine sizeData element sizeIt’s important to test your pipeline with your expected real-world data (type and size), and in a testbed that mirrors your actual environment including similarly configured network, sources and sinks. You can then benchmark your pipeline by varying several parameters such as worker machine size. PKB makes it easy to A/B test different machine sizes and determine which one provides the maximum throughput per vCPU.Note: What about measuring pipeline throughput in MB/s instead of EPS?While either of these units work, measuring throughput in EPS draws a clear line with:underlying performance dependency (i.e. element size in your particular data), andtarget performance requirement (i.e. number of individual elements processed by your pipeline). Similar to how disk performance depends on I/O block size (KB), pipeline throughput depends on element size (KB). With pipelines processing primarily small element sizes (in the order of KBs), EPS is likely the limiting performance factor. The ultimate choice between EPS and MB/s depends on your use case and data.Note: The approach presented here expands on this prior post from 2020, predicting dataflow cost. However, we also recommend varying worker machine sizes to identify any potential cpu/network/memory bottlenecks, and determine the optimum machine size for your specific job and input profile, rather than assuming default machine size (i.e. n1-standard-2). The same applies to any other relevant pipeline configuration option such as custom parameters.The following are sample PKB results from benchmarking PubSub Subscription to BigQuery Dataflow template across n1-standard-{2,4,8,16} using the same input data, that is logs with element size of ~1KB. As you can see, while n1-standard-16 offers the maximum throughput at 28.9k EPS, the maximum throughput per vCPU is provided by n1-standard-4 at around 3.8k EPS/core slightly beating n1-standard-2 which is at 3.7k EPS/core, by 2.6%.Latency & throughput results from PKB testing of Pub/Sub to BigQuery Dataflow templateWhat about pipeline cost? Which machine size offers the best performance/cost ratio?Let’s look at resource utilization and total cost to quantify this. After each test run, PKB collects standard Dataflow metrics such as average CPU utilization and calculates the total cost based on reported resources used by the job. In our case, jobs running on n1-standard-4 incurred on average 5.3% more costs than jobs running on n1-standard-2. With an increased performance of only 2.6%, one might argue that from a performance/cost point of view, n1-standard-4 is less optimal than n1-standard-2. However, looking at CPU utilization, n1-standard-2 was highly utilized at > 80% on average, while n1-standard-4 utilization was at a healthy average of 68.57% offering room to respond faster to small load changes, without potentially spinning up a new instance.Utilization and cost results from PKB testing of Pub/Sub to BigQuery Dataflow templateChoosing optimum worker size sometimes involves a tradeoff between cost, throughput and freshness of data. The choice depends on your specific workload profile and target requirements namely throughput and event latency. In our case, the extra 5.3% in cost for n1-standard-4 is worth it, given the added performance and responsiveness. Therefore, for our specific use case and input data, we chose n1-standard-4 as the pipeline unit worker size with throughput of 3.8k EPS per vCPU.Sizing & costing pipelines“Provision for peak, and pay only for what you need.”Now that you measured (and hopefully optimized) your pipeline’s throughput per vCPU, you can deduce the pipeline size necessary to process your expected input workload as follows:Since your pipeline’s input workload is likely variable, you need to calculate the average and maximum pipeline sizes. Maximum pipeline size helps with capacity planning for peak load. Average pipeline size is necessary for cost estimation: you can now plug in the average number of workers and chosen instance type in the Google Cloud Pricing Calculator to determine TCO.Let’s go through an example. For our specific use case, let’s assume the following about our input workload profile:Daily volume to be processed: 10 TB/dayAverage element size: 1 KBTarget steady-state throughput: 125k EPSTarget peak throughput: 500k EPS (or 4x steady-state)Peak load occurs 10% of the timeIn other words, the average throughput is expected to be around 90% x 125k + 10% x 500k =162.5k (EPS).Let’s calculate the average pipeline size:To determine pipeline monthly cost, we can now plug in the average number of workers (11 workers) and instance type (n1-standard-4) into the pricing calculator. Note the number of hours per month (730 on average) given this is a continuously running streaming pipeline:How to get startedTo get up and running with PKB, refer topublic PKB docs. If you prefer walkthrough tutorials, check out this beginner lab, which goes over PKB setup, PKB command-line options, and how to visualize test results in Data Studio, similar to how we did above.The repo includes example PKB config files, including dataflow_template.yaml which you can use to re-run the sequence of tests above. You need to replace all <MY_PROJECT> and <MY_BUCKET> instances with your own GCP project and bucket. You also need to create an input Pub/Sub subscription with your own test data preprovisioned (since test results vary based on your data), and an output BigQuery tablewith correct schema to receive the test data. The PKB benchmark handles saving and restoring a snapshot of that Pub/Sub subscription for every test run iteration. You can run the entire benchmark directly from PKB root directory:code_block[StructValue([(u’code’, u’./pkb.py –project=$PROJECT_ID \rn –benchmark_config_file=dataflow_template.yaml’), (u’language’, u”), (u’caption’, <wagtail.wagtailcore.rich_text.RichText object at 0x3ee61e1d1f10>)])]To benchmark Dataflow jobs from a jar file (instead of a staged Dataflow template), refer to wordcount_template.yaml PKB config file as an example, which you can run as follows:code_block[StructValue([(u’code’, u’./pkb.py –project=$PROJECT_ID \rn –benchmark_config_file=wordcount_template.yaml’), (u’language’, u”), (u’caption’, <wagtail.wagtailcore.rich_text.RichText object at 0x3ee61e1cd310>)])]To publish test results in BigQuery for further analysis, you need to append BigQuery-specific arguments to above commands. For example:code_block[StructValue([(u’code’, u’./pkb.py –project=$PROJECT_ID \rn –benchmark_config_file=dataflow_template.yaml \rn –bq_project=$PROJECT_ID \rn –bigquery_table=example_dataset.dataflow_tests’), (u’language’, u”), (u’caption’, <wagtail.wagtailcore.rich_text.RichText object at 0x3ee61e2ee150>)])]What’s next?We’ve covered how performance benchmarking can help ensure your pipeline is properly sized and configured, in order to:meet your expected data volumes,without hitting capacity limits, andwithout breaking your cost budgetIn practice, there may be many more parameters that impact your pipeline performance beyond just the machine size, so we encourage you to take advantage of PKB to benchmark different configurations of your pipeline, and help you make data-driven decisions around things like:Planned pipeline’s features developmentDefault and recommended values for your pipeline parameters. See this sizing guideline for one of Google-provided Dataflow templates as an example of PKB benchmark results synthesized into deployment best practices.You can also incorporate these performance tests in your pipeline development process to quickly identify and avoid performance regressions. You can automate such pipeline regression testing as part of your CI/CD pipeline – no pun intended.Finally, there’s a lot of opportunity to further enhance PKB for Dataflow benchmarking, such as collecting more stats and adding more realistic benchmarks that’s in line with your pipeline’s expected input workload. While we have tested here pipeline’s unit performance (max EPS/vCPU) under peak load, you might want to test your pipeline’s auto-scaling and responsiveness (e.g. 95th percentile for event latency) under varying load which could be just as critical for your use case. You can file tickets to suggest features or submit pull requests and join the 100+ PKB developer community.On that note, we’d like to acknowledge the following individuals who helped make PKB available to Dataflow end-users:Diego Orellana, Software Engineer @ Google, PerfKit BenchmarkerRodd Zurcher, Cloud Solutions Architect @ Google, App/Infra ModernizationPablo Rodriguez Defino, PSO Cloud Consultant @ Google, Data & AnalyticsRelated ArticleWhat’s New with Google’s Unified, Open and Intelligent Data CloudGoogle’s unified, open and intelligent data cloud provides insights at every level of the enterprise to empower leaders to drive results.Read Article
Quelle: Google Cloud Platform

Building a Machine Learning Platform with Kubeflow and Ray on Google Kubernetes Engine

Increasingly more enterprises adopt Machine Learning (ML) capabilities to enhance their services, products, and operations. As their ML capabilities mature, they build centralized ML Platforms to serve many teams and users across their organization. Machine learning is inherently an experimental process requiring repeated iterations. An ML Platform standardizes the model development and deployment workflow to offer greater consistency for the repeated process. This facilitates productivity and reduces time from prototype to production.When first trying ML in the cloud, many practitioners will start with fully managed ML platforms like Google Cloud’s Vertex AI. Fully-managed platforms abstract out many complexities to simplify the end-to-end workflow. However, like with most decisions, there are tradeoffs. Organizations may choose to build their own custom, self-managed ML platform for various reasons such as control and flexibility. Building your own platform gives you more control over your resources. You can implement unique resource utilization constraints, access permissions, and infrastructure strategies that fit your organization’s specific needs. You also get more flexibility over tools and frameworks. Since the system is completely open, you can integrate any ML tools that you already are using. And lastly, these benefits help avoid vendor lock-in because cloud-native platforms are by definition portable across cloud providers.For self-managed ML Platforms, Open Source Software is an important driver of digital innovation. If you are following the evolution of ML technologies, then you are probably aware of the ever growing ecosystem of Open Source Machine Learning frameworks, platforms, and tools. However, no single Open Source library delivers a complete ML solution, so we must integrate multiple Open Source projects to build an ML platform.To start building an ML Platform, it should support the basic ML user journey of notebook prototyping to scaled training to online serving. For organizations with multiple teams, it additionally needs to support administrative requirements of multi-user support with identity-based authentication and authorization. Two popular Open Source projects – Kubeflow and Ray – together can support these needs. Kubeflow provides the multi-user environment and interactive notebook management. Ray orchestrates distributed computing workloads across the entire ML lifecycle, including training and serving.Google Kubernetes Engine (GKE) simplifies deploying Open Source ML software in the cloud with autoscaling and auto-provisioning. GKE reduces the effort to deploy and manage the underlying infrastructure at scale and offers the flexibility to use your ML frameworks of choice. In this article, we will show how Kubeflow and Ray can be  assembled into a seamless experience. We will demonstrate how platform builders can deploy them both to GKE to provide a comprehensive, production-ready ML platform.Kubeflow and RayFirst, let’s take a closer look at these two Open Source projects. While both Kubeflow and Ray deal with the problem of enabling ML at scale, they focus on very different aspects of the puzzle.Kubeflow is a Kubernetes-native ML platform aimed at simplifying the build-train-deploy lifecycle of ML models. As such, its focus is on general MLOps. Some of the unique features offered by Kubeflow include:Built-in integration with Jupyter notebooks for prototypingMulti-user isolation supportWorkflow orchestration with Kubeflow PipelinesIdentity-based authentication and authorization through Istio IntegrationOut-of-the-box integration with major cloud providers such as GCP, Azure, and AWSSource: https://www.kubeflow.org/docs/started/architecture/Ray is a general-purpose distributed computing framework with a rich set of libraries for large scale data processing, model training, reinforcement learning, and model serving. It is popular with customers as a simple API for building and scaling AI and Python workloads. Its focus is on the application itself – allowing users to build distributed computing software with a unified and flexible set of APIs. Some of the advanced libraries offered by Ray include:RLLib for reinforcement learningRay Tune for hyperparameter tuningRay Train for distributed deep learningRay Serve for scalable model servingRay Data for preprocessingSource: https://docs.ray.io/en/latest/index.html#what-is-rayIt should be noted that Ray is not a Kubernetes-native project. In order to deploy Ray on Kubernetes, the Open Source community has created KubeRay, which is exactly what it sounds like – a toolkit for deploying Ray in Kubernetes. KubeRay offers a powerful set of tools that include many great features, like custom resource APIs and a scalable operator. You can learn more about it here.Now that we have examined the differences between Kubeflow and Ray, you might be asking which is the right platform for your organization. Kubeflow’s MLOps capabilities and Ray’s distributed computing libraries are both independently useful with different advantages. What if we can combine the benefits of both systems? Imagine having an environment that:Supports Ray Train with autoscaling and resource provisioningIntegrated with identity-based authentication and authorizationSupports multi-user isolation and collaborationContains an interactive notebook serverLet’s now take a look at how we can put these two platforms together and take advantage of the  useful features offered by each. Specifically, we will deploy Kuberay in a GKE cluster installed with Kubeflow. The system looks something like this:In this system, the Kubernetes cluster is partitioned into logically-isolated workspaces, called “profiles”. Each new user will create their own profile, which is a container for all their resources in this Kubernetes cluster. The user can then provision their own resources within their designated namespace, including Ray Clusters and Jupyter Notebooks. If the user’s resources are provisioned through the Kubeflow dashboard, then Kubeflow will automatically place these resources in their profile namespace.Under this setup, each Ray cluster is by default protected by role-based access control policies (with Istio) preventing unauthorized access. This allows each user to interact with their own Ray clusters independently of each other, and allows them to share Ray clusters with other team members.For this setup, I used the following versions:Google Kubernetes Engine 1.21.12-gke.2200 Kubeflow 1.5.0Kuberay 0.3.0Python 3.7Ray 1.13.1The configuration files used for this deployment can be found here.Deploying Kubeflow and KuberayFor deploying Kubeflow, we will be using the GCP instructions here. For simplicity purposes, I have used mostly default configuration settings. You can freely experiment with customizations before deploying, for example, you can enable GPU nodes in your cluster by following these instructions.Deploying the KubeRay operator is pretty straightforward. We will be using the latest released version:code_block[StructValue([(u’code’, u’export KUBERAY_VERSION=v0.3.0rnkubectl create -k “github.com/ray-project/kuberay/manifests/cluster-scope-resources?ref=${KUBERAY_VERSION}”rnkubectl apply -k “github.com/ray-project/kuberay/manifests/base?ref=${KUBERAY_VERSION}”‘), (u’language’, u”), (u’caption’, <wagtail.wagtailcore.rich_text.RichText object at 0x3ead112f5950>)])]This will deploy the KubeRay operator in the “ray-systems” namespace in your cluster.Creating Your Kubeflow User ProfileBefore you can deploy and use resources in Kubeflow, you need to first create your user profile. If you follow the GKE installation instructions, you should be able to navigate to https://[cluster].endpoints.[project].cloud.goog/ in your browser, where [cluster] is the name of your GKE cluster and [project] is your GCP project name.This should redirect you to a web page where you can use your GCP credentials to authenticate yourself.Follow the dialogue, and Kubeflow will create a namespace with you as the administrator. We’ll discuss later in this article how to invite others to your workspace.Build the Ray Worker ImageNext, let’s build the image we’ll be using for the Ray cluster. Ray is very sensitive when it comes to version compatibility (for example, the head and worker nodes must use the same versions of Ray and Python), so it is highly recommended to prepare and version-control your own worker images. Look for the base image you want from their Docker page here: rayproject/ray – Docker Image. The following is a functioning worker image using Ray 1.13 and Python 3.7:code_block[StructValue([(u’code’, u’FROM rayproject/ray:1.13.1-py37rnrnRUN pip install numpy tensorflowrnrnCMD [“bin/bash”]’), (u’language’, u”), (u’caption’, <wagtail.wagtailcore.rich_text.RichText object at 0x3eacefa87550>)])]Here is the same Dockerfile for a worker image running on GPUs if you prefer GPUs instead of CPUs:code_block[StructValue([(u’code’, u’FROM rayproject/ray:1.13.1-py37-gpurnrnRUN pip install numpy tensorflowrnrnCMD [“bin/bash”]’), (u’language’, u”), (u’caption’, <wagtail.wagtailcore.rich_text.RichText object at 0x3ead12cd8110>)])]Use Docker to build and push both images to your image repository:code_block[StructValue([(u’code’, u’$ docker build -t <path-to-your-image> -f Dockerfile .rn$ docker push <path-to-your-image>’), (u’language’, u”), (u’caption’, <wagtail.wagtailcore.rich_text.RichText object at 0x3ead12cd8190>)])]Build the Jupyter Notebook ImageSimilarly we need to build the notebook image that we are going to use. Because we are going to use this notebook to interact with the Ray cluster, we need to ensure that it uses the same version of Ray and Python as the Ray workers.The Kubeflow example Jupyter notebooks can be found at Example Notebook Servers. For this example, I changed the PYTHON_VERSION in components/example-notebook-servers/jupyter/Dockerfile to the following:code_block[StructValue([(u’code’, u’ARG MINIFORGE_VERSION=4.10.1-4rnARG PIP_VERSION=21.1.2rnARG PYTHON_VERSION=3.7.10′), (u’language’, u”), (u’caption’, <wagtail.wagtailcore.rich_text.RichText object at 0x3ead10670ad0>)])]Use Docker to build and push the notebook image to your image repository, similar to the previous step:code_block[StructValue([(u’code’, u’$ docker build -t <path-to-your-image> -f Dockerfile .rn$ docker push <path-to-your-image>’), (u’language’, u”), (u’caption’, <wagtail.wagtailcore.rich_text.RichText object at 0x3ead10670490>)])]Deploy a Ray ClusterNow we are ready to configure and deploy our Ray cluster.1. Copy the following sample yaml file from GitHub:code_block[StructValue([(u’code’, u’curl https://github.com/richardsliu/ray-on-gke/blob/main/manifests/ray-cluster.serve.yaml -o ray-cluster.serve.yaml’), (u’language’, u”), (u’caption’, <wagtail.wagtailcore.rich_text.RichText object at 0x3ead103d1590>)])]2. Edit the settings in the file:a. For the user namespace, change the value to match with your Kubeflow profile name:code_block[StructValue([(u’code’, u’namespace: %your_name%’), (u’language’, u”), (u’caption’, <wagtail.wagtailcore.rich_text.RichText object at 0x3ead103d15d0>)])]b. For the Ray head and worker settings, change the value to point to the image you have built previously:code_block[StructValue([(u’code’, u’image: %your_image%’), (u’language’, u”), (u’caption’, <wagtail.wagtailcore.rich_text.RichText object at 0x3ead103d1550>)])]c. Edit resource requests and limits, as required. For example, you can change the CPU or GPU requirements for worker nodes here:code_block[StructValue([(u’code’, u’resources: rn limits:rn cpu: 1rn requests:rn cpu: 200m’), (u’language’, u”), (u’caption’, <wagtail.wagtailcore.rich_text.RichText object at 0x3ead103d18d0>)])]3. Deploy the cluster:code_block[StructValue([(u’code’, u’kubectl apply -f raycluster.serve.yaml’), (u’language’, u”), (u’caption’, <wagtail.wagtailcore.rich_text.RichText object at 0x3ead103d1ed0>)])]4. Your cluster should be ready to go momentarily. If you have enabled node auto-provisioning on your GKE cluster, you should be able to see the cluster dynamically scale up and down according to usage. You can check the status of your cluster by doing:code_block[StructValue([(u’code’, u’$ kubectl get pods -n <user name>rnNAME READY STATUS RESTARTS AGErnexample-cluster-head-8cbwb 1/1 Running 0 12srnexample-cluster-worker-large-group-75lsr 1/1 Running 0 12srnexample-cluster-worker-large-group-jqvtp 1/1 Running 0 11srnexample-cluster-worker-large-group-t7t4n 1/1 Running 0 12s’), (u’language’, u”), (u’caption’, <wagtail.wagtailcore.rich_text.RichText object at 0x3ead103d1890>)])]You can also verify that the service endpoints are created:code_block[StructValue([(u’code’, u’$ kubectl get services -n <user name>rnNAME TYPE CLUSTER-IP EXTERNAL-IP PORT(S) AGErnexample-cluster-head-svc ClusterIP 10.52.9.88 <none> 8265/TCP,10001/TCP,8000/TCP,6379/TCP 18s’), (u’language’, u”), (u’caption’, <wagtail.wagtailcore.rich_text.RichText object at 0x3ead103d16d0>)])]Remember this service name – we will come back to it later.Now our ML Platform is all set up and we are ready to start Training a model.Training a ML ModelWe are going to use a Notebook to orchestrate our model training. We can access Ray from a Jupyter notebook session.1. In the Kubeflow dashboard, navigate to the “Notebooks” tab.2. Click on “New Notebook”.3. In the “Image” section, click on “Custom Image”, and input the path to the Jupyter notebook image that you have built here.4. Configure resource requirements for the notebook as needed. The default notebook uses half a CPU and 1G of memory. Note that these resources are only for the notebook session, and not for the Training resources. Later, we use Ray to orchestrated resources at scale on GKE.5. Click on “LAUNCH”.6. When the notebook finishes deploying, click on “Connect” to start a new notebook session.7. Inside the notebook, open a terminal by clicking on File -> New -> Terminal. 8. Install Ray 1.13 in the terminal:code_block[StructValue([(u’code’, u’pip install ray==1.13′), (u’language’, u”), (u’caption’, <wagtail.wagtailcore.rich_text.RichText object at 0x3ead103d1d10>)])]9. Now you are ready to run an actual Ray application, using this notebook and the Ray cluster you just deployed in the previous section. I have made a .ipynb file using the canonical Ray trainer example here.10. Run through the cells in the notebook. The magic line that connects to the Ray cluster is:code_block[StructValue([(u’code’, u’ray.init(“ray://example-cluster-head-svc:10001″)’), (u’language’, u”), (u’caption’, <wagtail.wagtailcore.rich_text.RichText object at 0x3eacefa871d0>)])]This should match with the service endpoint that you created earlier. If you have several different Ray clusters, you can simply change the endpoint here to connect to a different one.11. The next few lines will start a Ray Trainer process on the cluster:code_block[StructValue([(u’code’, u’trainer = Trainer(backend=”tensorflow”, num_workers=4)rntrainer.start()rnresults = trainer.run(train_func_distributed)rntrainer.shutdown()’), (u’language’, u”), (u’caption’, <wagtail.wagtailcore.rich_text.RichText object at 0x3eacefab3bd0>)])]Note here that we specify 4 workers, which matches with our Ray cluster’s number of replicas. If we change this number, the Ray cluster will automatically scale up or down according to resource demands.Serving a ML ModelIn this section we will look at how we can serve the machine learning model that we have just trained in the last section.1. Using the same notebook, wait for the training steps to complete. You should see some output logs with metrics for the model that we have trained.2 Run the next cell:code_block[StructValue([(u’code’, u’serve.start(detached=True, http_options={“host”: “0.0.0.0”})rnTFMnistModel.deploy(TRAINED_MODEL_PATH)’), (u’language’, u”), (u’caption’, <wagtail.wagtailcore.rich_text.RichText object at 0x3eacefab3110>)])]This will start serving the model that we have just trained, using the same service endpoint we created before.3. To verify that the inference endpoint is now working, we can create a new notebook. You can use this one here.4. Note that we are calling the same inference endpoint as before, but using a different port:code_block[StructValue([(u’code’, u’resp = requests.get(rn “http://example-cluster-head-svc:8000/mnist”,rn json={“array”: np.random.randn(28 * 28).tolist()})’), (u’language’, u”), (u’caption’, <wagtail.wagtailcore.rich_text.RichText object at 0x3eacefab3e50>)])]5. You should see the inference results displayed in your notebook session.Sharing the Ray Cluster with OthersNow that you have a functional workspace with an interactive notebook and a Ray cluster, let’s invite others to collaborate.1. On Cloud Console, grant the user minimal cluster access here.2. In the left-hand panel of the Kubeflow dashboard, select “Manage Contributors”.3. In the “Contributors to your namespace” section, enter the email address of the user to whom you are granting access. Press enter.4. That user can now select your namespace and access your notebooks, including your Ray cluster.Using Ray DashboardFinally, you can also bring up the Ray Dashboard using Istio virtual services. Using these steps, you can bring up a dashboard UI inside the Kubeflow central dashboard console:1. Create an Istio Virtual Service config file:code_block[StructValue([(u’code’, u”apiVersion: networking.istio.io/v1alpha3rnkind: VirtualServicernmetadata:rn name: example-cluster-virtual-servicern Namespace: kubeflowrnspec:rn gateways:rn – kubeflow-gatewayrn hosts:rn – ‘*’rn http:rn – match:rn – uri:rn prefix: /example-cluster/rn rewrite:rn uri: /rn route:rn – destination:rn host: example-cluster-head-svc.$(USER_NAMESPACE).svc.localrn port:rn number: 8265″), (u’language’, u”), (u’caption’, <wagtail.wagtailcore.rich_text.RichText object at 0x3ead111f4c10>)])]Replace $(USER_NAMESPACE) with the namespace of your user profile. Save this to a local file. 2. Deploy the virtual service:code_block[StructValue([(u’code’, u’kubectl apply -f virtual_service.yaml’), (u’language’, u”), (u’caption’, <wagtail.wagtailcore.rich_text.RichText object at 0x3ead12985910>)])]3. In your browser window, navigate to https://<host>/_/example-cluster/. The Ray dashboard should be displayed in the window:ConclusionLet’s take a minute to recap what we have done. In this article, we have demonstrated how to deploy two popular ML frameworks, Kubeflow and Ray, in the same GCP Kubernetes cluster. The setup also takes advantage of GCP features like IAP (Identity-Aware Proxy) for user authentication, which protects your applications while simplifying the experience for cloud admins. The end result is a well-integrated and production-ready system that pulls in useful features offered by each system:Orchestrating distributed computing workloads using Ray APIs;Multi-user isolation using Kubeflow;Interactive notebook environment using Kubeflow notebooks;Cluster autoscaling and auto-provisioning using Google Kubernetes EngineWe’ve only scratched the surface of the possibilities, and you can expand from here:Integrations with other MLOps offerings, such as Vertex Model monitoring;Faster and safer image storage and management, through the Artifact Repository;High throughput storage for unstructured data using GCSFuse;Improve network throughput for collective communication with NCCL Fast Socket.We look forward to the growth of your ML Platform and how your team innovates with Machine Learning. Look out for future articles on how to enable additional ML Platform features.Related ArticleEnabling real-time AI with Streaming Ingestion in Vertex AIMany machine learning (ML) use cases, like fraud detection, ad targeting, and recommendation engines, require near real-time predictions….Read Article
Quelle: Google Cloud Platform

View policy enforcement metrics for ACM Policy Controller

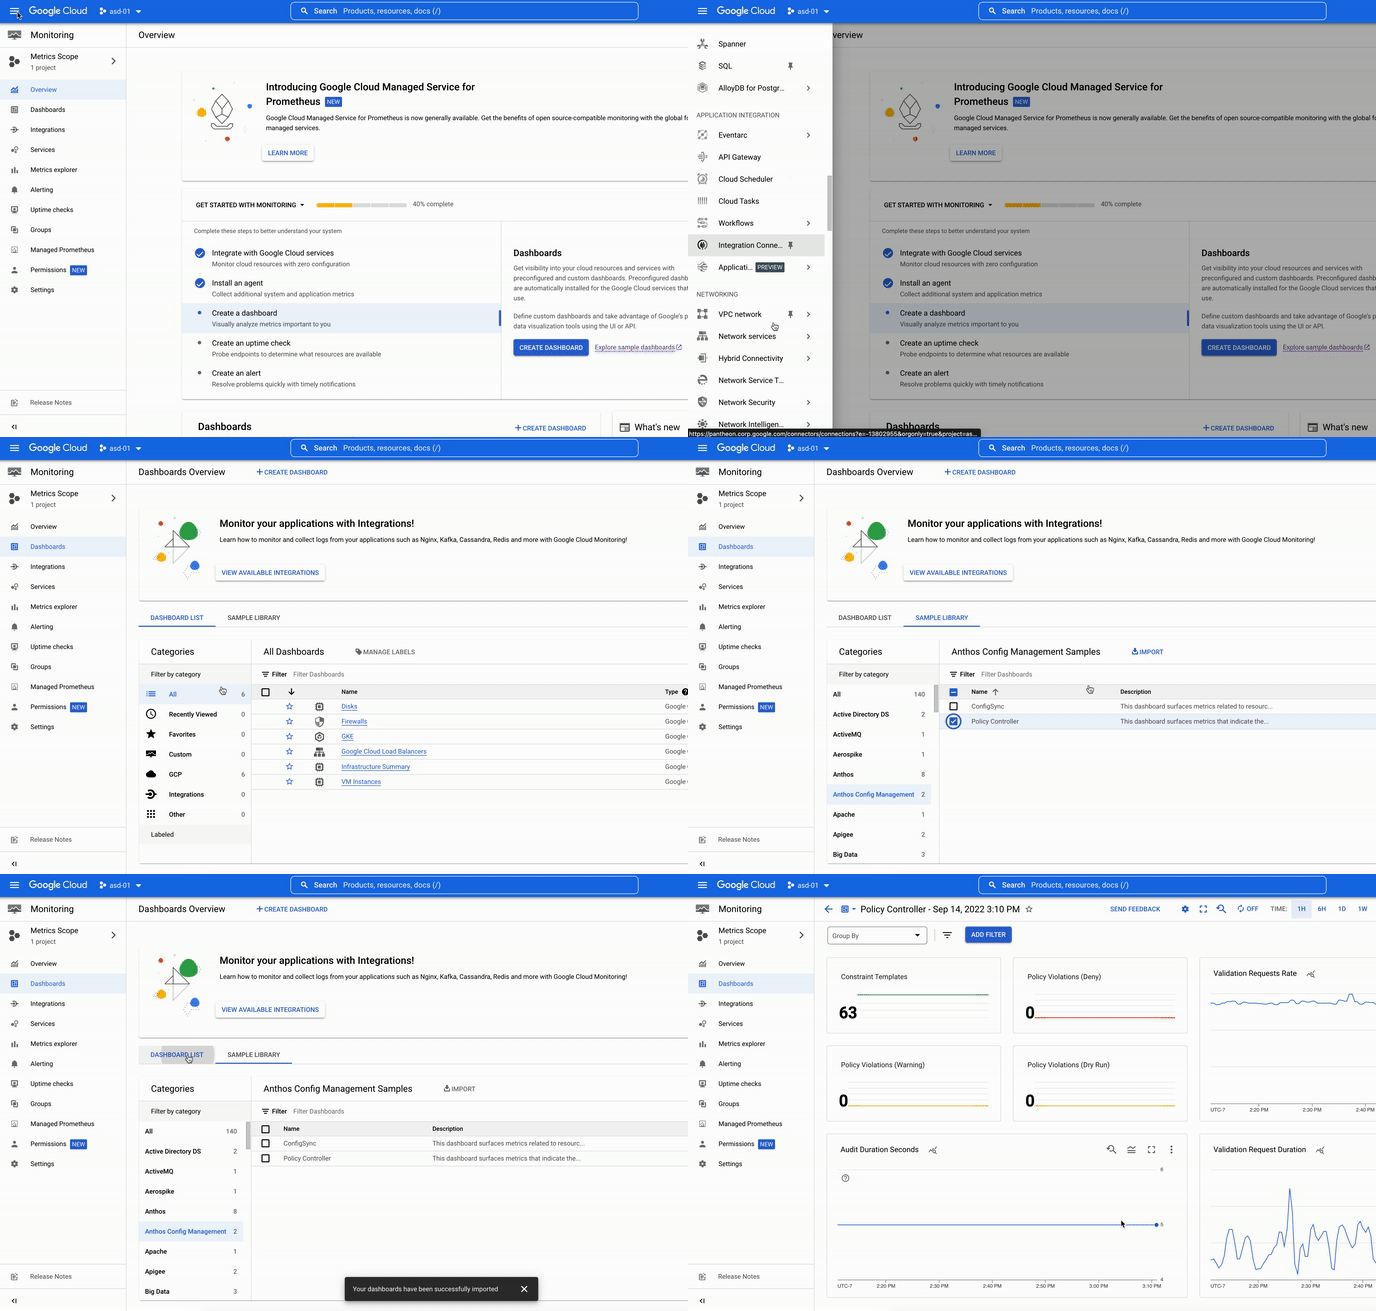
Policy Controller enables the enforcement of fully programmable policies for your clusters. These policies act as “guardrails” and prevent any changes from violating security, operational, or compliance controls at admission time, and post admission, using continuous audit.Through ongoing conversations with platform and security administrators, we have received feedback about increasing visibility into how the policies are applied i.e. enforced or audited across Anthos or GKE clusters.With the Anthos Config Management (ACM) 1.12.0 onwards, we have made it easier to export and visualize Policy Controller metrics.Policy Controller MetricsPolicy controller includes the metrics related to policy usage such as number of constraints, constraint templates, audit violations detected just to name a few (see list of metrics exposed).Exporting the metricsPolicy Controller uses OpenCensus to create and record metrics related to its processes and policy usage. Policy Controller can be easily configured to export these metrics to Prometheus and/or Cloud Monitoring at the install time. Default setting for exporting metrics for Policy controller will export the metrics to both Prometheus and Cloud monitoring. Viewing the metricsThese metrics are exported to the customer’s Cloud Monitoring project in Prometheus format. As a result, customers can view these metrics in the Cloud Monitoring UI or query them via the Cloud Monitoring API using either PromQL (the de-facto query language for Kubernetes metrics) or MQL (Google’s proprietary metrics query language). There is also a newly added cloud monitoring dashboard to view your metrics. This dashboard can be further edited to meet your business or operational needs.  This dashboard can be imported from within Cloud Console.Login to Cloud Console and click on the hamburger (collapsed) menu and click on More Products to expand the list of products in the menu.Select Monitoring > Dashboards and then click the Sample Library tab on the page.This will show all the samples available by category.Select Anthos Config Management from the list.Check Policy Controller from the list and click Import.Confirm that you want to import the dashboard.This will create a new dashboard.You can view by clicking on the Dashboards menu item and then selecting the newly created Policy Controller dashboard from the list.PricingThese metrics are available at no additional cost to our customers. Alerting on the metricsYou can create alerting policies in Cloud Alertingso you are notified in case something needs your attention. Third Party integration Any third party observability tool can ingest these metrics using Cloud Monitoring API. If you are using Grafana dashboards all you have to do is point it to the Cloud Monitoring API for it to work. Next stepsInstall Policy Controller Implement CIS benchmark using Policy ControllerExplore Policy controller constraint template libraryConfig Sync metricsRelated ArticleExtending Anthos to manage on-premises edge VMs: now generally availableVM support in Anthos extends Anthos on bare metal (Google Distributed Cloud Virtual) to run and manage both containers and VMs on a singl…Read Article
Quelle: Google Cloud Platform

Container analysis support for Maven and Go Automatic Scanning of Containers in Public Preview

Java and Go vulnerability scanning supportGoogle Cloud’s Container Scanning API now automatically scans Maven and Go packages for vulnerabilities.With the Container Scanning API enabled, any containers including Java (in Maven repositories) and Go language packages that are uploaded to an Artifact Registry repository will be scanned for vulnerabilities. This capability builds on existing Linux OS based vulnerability detection and provides customers with deeper insight into their applications. This feature is in Public Preview which makes it available to all Google Cloud customers.Get started with Artifact Registry via the instructions for Go or the instructions for Java.How it worksOnce the API is enabled, upload a container image which contains Go and/or Maven packages.Vulnerability totals for each image digest are displayed in the Vulnerabilities column. Customers can then drill down on the vulnerability to get CVE numbers, and if available, a suggested fix.Vulnerabilities can also be displayed via the gcloud CLI and the API.To view a list of vulnerabilities from the gcloud CLI, the following can be used.code_block[StructValue([(u’code’, u’gcloud artifacts docker images list –show-occurrences LOCATION-docker.pkg.dev/PROJECT_ID/REPOSITORY/IMAGE_ID –format=json’), (u’language’, u”), (u’caption’, <wagtail.wagtailcore.rich_text.RichText object at 0x3e36f7539950>)])]To view a list of vulnerabilities with the API, run the following command.code_block[StructValue([(u’code’, u’curl -X GET -H “Content-Type: application/json” -H \rn “Authorization: Bearer $(gcloud auth print-access-token)” \rn https://containeranalysis.googleapis.com/v1/projects/PROJECT_ID/occurrences’), (u’language’, u”), (u’caption’, <wagtail.wagtailcore.rich_text.RichText object at 0x3e36f4ebf290>)])]Integrate your Workflows via API and Pub/SubThis feature now makes it possible to scan Java (in Maven repositories) and Go language packages both via the existing On-Demand scan capability, and with an automatic scan on push to Artifact Registry. Language scanning is in addition to the Linux OS scanning which is already available.This capability can be combined with Pub/Sub notifications to trigger additional actions for the vulnerabilities and other metadata. An example of this is sending an e-mail notification to those who need the information.Organizations are increasingly concerned about the supply chain risks associated with building their applications using open source software. Being able to scan applications for vulnerabilities is an important step for customers to enhance their security posture. Language package vulnerabilities are available in the same formats that customers are already familiar with. They appear alongside OS vulnerabilities within the Artifact Registry UI, and are available through existing CLI and APIs. These steps aid customers in identifying the potential vulnerabilities introduced in software packages and make appropriate decisions with that information. Learn more about types of vulnerability scanning.Related ArticleBuilding a secure CI/CD pipeline using Google Cloud built-in servicesBuild a secure CI/CD pipeline using Google Cloud’s built-in services using Cloud Build, Cloud Deploy, Artifact Registry, Binary Authoriza…Read Article
Quelle: Google Cloud Platform

What’s New with Google’s Unified, Open and Intelligent Data Cloud

We’re fortunate to work with some of the world’s most innovative customers on a daily basis, many of whom come to Google Cloud for our well-established expertise in data analytics and AI. As we’ve worked and partnered with these data leaders, we have encountered similar priorities among many of them: to remove the barriers of data complexity, unlock new use cases, and reach more people with more impact. These innovators and industry disruptors power their data innovation with a data cloud that lets their people work with data of any type, any source, any size, and at any speed, without capacity limits. A data cloud that lets them easily and securely move across workloads: from SQL to Spark, from business intelligence to machine learning, with little infrastructure set up required. A data cloud that acts as the open data ecosystem foundation needed to create data products that employees, customers, and partners use to drive meaningful decisions at scale.On October 11, we will be unveiling a series of new capabilities at Google Cloud Next ‘22 that continue to support this vision. If you haven’t registered yet for the Data Cloud track at Google Next, grab your spot today! But I know you data devotees probably can’t wait until then. So, we wanted to take some time before Next to share some recent innovations for data cloud that are generally available today. Consider these the data hors d’oeuvres to your October 11 data buffet.Removing the barriers of data sharing, real-time insights, and open ecosystemsThe data you need is rarely stored in one place. More often than not data is scattered across multiple sources and in various formats. While data exchanges were introduced decades ago, their results have been mixed. Traditional data exchanges often require painful data movement and can be mired with security and regulatory issues. This unique use case led us to design Analytics Hub, now generally available, as the data sharing platform for teams and organizations who want to curate internal and external exchanges securely and reliably. This innovation not only allows for the curation and sharing of a large selection of analytics-ready datasets globally, it also enables teams to tap into the unique datasets only Google provides, such as Google Search Trends or the Data Commons knowledge graph.Analytics Hub is a first-class experience within BigQuery. This means you can try it now for free using BigQuery, without having to enter any credit card information. Analytics Hub is not the only way to bring data into your analytical environment rapidly. We recently launched a new way to extract, load, and transform data in real-time into BigQuery: the Pub/Sub “BigQuery subscription.” This new ELT innovation simplifies streaming ingestion workloads, is simpler to implement, and is more economical since you don’t need to spin up new compute to move data and you no longer need to pay for streaming ingestion into BigQuery. But what if your data is distributed across lakes, warehouses, multiple clouds, and file formats? As more users demand more use cases, the traditional approach to build data movement infrastructure can prove difficult to scale, can be costly, and introduces risk. That’s why we introduced BigLake, a new storage engine that extends BigQuery storage innovation to open file formats running on public cloud object stores. BigLake lets customers build secure, data lakes over open file formats.  And, because it provides consistent, fine-grained security controls for Google Cloud and open-source query engines, security only needs to be configured in one place to be enforced everywhere. Customers like Deutsche Bank, Synapse LLC, and Wizard have been taking advantage of BigLake in preview. Now that BigLake is generally available, I invite you to learn how it can help to build your own data ecosystem.Unlocking the ways of working with dataWhen data ecosystems expand to data of all shape, size, type, and format, organizations struggle to innovate quickly because their people have to move from one interface to the next, based on their workloads. This problem is often encountered in the field of machine learning, where the interface for ML is often different than that of business analysis. Our experience with BigQuery ML has been quite different: customers have been able to accelerate their path to innovation drastically because machine learning capabilities are built-in as part of BigQuery (as opposed to “bolted-on” in the case of alternative solutions).We’re now applying the same philosophy to log data by offering a Log Analytics service in Cloud Logging. This new capability, currently in preview, gives users the ability to gain deeper insights into their logging data with BigQuery. Log Analytics comes at no additional charge beyond existing Cloud Logging fees and takes advantage of soon-to-be generally available BigQuery features designed for analytics on logs: Search indexes,a JSON data type, and the Storage Write API. Customers that store, explore, and analyze their own machine generated data from servers, sensors, and other devices can tap into these same BigQuery features to make querying their logs a breeze. Users simply use standard BigQuery SQL to analyze operational log data alongside the rest of their business data!And there’s still more to come. We can’t wait to engage with you on Oct 11, during Next’22, to share more of the next generation of data cloud solutions. To tune into sessions tailored to your particular interests or roles, you can find top Next sessions for Data Engineers, Data Scientists, and Data Analysts — or create and share your own. Join us at Next’22 to hear how leaders like Boeing, Twitter, CNA Insurance, Telus, L’Oreal, and Wayfair, are transforming data-driven insights with Google’s data cloud. Related ArticleRegister for Google Cloud NextRegister now for Google Cloud Next ‘22, coming live to a city near you, as well as online and on demand.Read Article
Quelle: Google Cloud Platform
Meet Optimus, Gojek’s open-source cloud data transformation tool

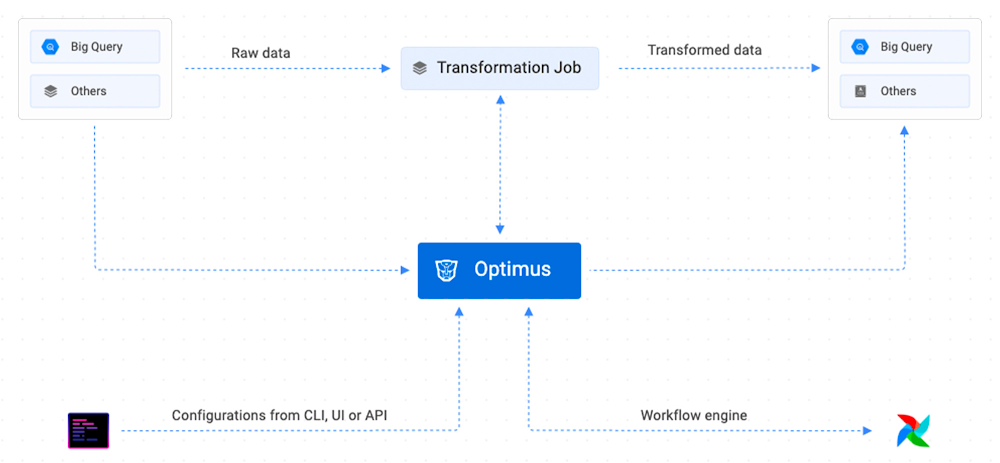
Editor’s note: Earlier this year, we heard from Gojek, the ​​on-demand services platform, about the open-source data ingestion tool it developed for use with data warehouses like BigQuery. Today, Gojek VP of Engineering Ravi Suhag is back to discuss the open-source data transformation tool it is building.In a recent post, we introduced Firehose, an open source solution by Gojek for ingesting data to cloud data warehouses like Cloud Storage and BigQuery. Today, we take a look at another project within the data transformation and data processing flow.As Indonesia’s largest hyperlocal on-demand services platform, Gojek has diverse data needs across transportation, logistics, food delivery, and payments processing. We also run hundreds of microservices across billions of application events. While Firehose solved our need for smarter data ingestion across different use cases, our data transformation tool, Optimus, ensures the data is ready to be accessed with precision wherever it is needed.The challenges in implementing simplicityAt Gojek, we run our data warehousing across a large number of data layers within BigQuery to standardize and model data that’s on its way to being ready for use across our apps and services. Gojek’s data warehouse has thousands of BigQuery tables. More than 100 analytics engineers run nearly 4,000 jobs on a daily basis to transform data across these tables. These transformation jobs process more than 1 petabyte of data every day. Apart from the transformation of data within BigQuery tables, teams also regularly export the cleaned data to other storage locations to unlock features across various apps and services.This process addresses a number of challenges:Complex workflows: The large number of BigQuery tables and hundreds of analytics engineers writing transformation jobs simultaneously creates a huge dependency on very complex database availability groups (DAGs) to be scheduled and processed reliably. Support for different programming languages: Data transformation tools must ensure standardization of inputs and job configurations, but they must also comfortably support the needs of all data users. They cannot, for instance, limit users to only a single programming language. Difficult to use transformation tools: Some transformation tools are hard to use for anyone that’s not a data warehouse engineer. Having easy-to-use tools helps remove bottlenecks and ensure that every data user can produce their own analytical tables.Integrating changes to data governance rules: Decentralizing access to transformation tools requires strict adherence to data governance rules. The transformation tool needs to ensure columns and tables have personally identifiable information (PII) and non-PII data classifications correctly inserted, across a high volume of tables. Time-consuming manual feature updates: New requirements for data extraction and transformation for use in new applications and storage locations are part of Gojek’s operational routine. We need to design a data transformation tool that could be updated and extended with minimal development time and disruption to existing use cases.Enabling reliable data transformation on data warehouses like BigQuery With Optimus, Gojek created an easy-to-use and reliable performance workflow orchestrator for data transformation, data modeling, data pipelines, and data quality management. If you’re using BigQuery as your data warehouse, Optimus makes data transformation more accessible for your analysts and engineers. This is made possible through simple SQL queries and YAML configurations, with Optimus handling many key demands including dependency management, and scheduling data transformation jobs to run at scale.Key features include:Command line interface (CLI): The Optimus command line tool offers effective access to services and job specifications. Users can create, run, and replay jobs, dump a compiled specification for a scheduler, create resource specifications for data stores, add hooks to existing jobs, and more.Optimized scheduling: Optimus offers an easy way to schedule SQL transformation through YAML based configuration. While it recommends Airflow by default, it is extensible enough to support other schedulers that can execute Docker containers.Dependency resolution and dry runs: Optimus parses data transformation queries and builds dependency graphs automatically. Deployment queries are given a dry-run to ensure they pass basic sanity checks.Powerful templating: Users can write complex transformation logic with compile time template options for variables, loops, IF statements, macros, and more.Cross-tenant dependency: With more than two tenants registered, Optimus can resolve cross-tenant dependencies automatically.Built-in hooks: If you need to sink a BigQuery table to Kafka, Optimus can make it happen thanks to hooks for post-transformation logic that extend the functionality of your transformations.Extensibility with plugins: By focusing on the building blocks, Optimus leaves governance for how to execute a transformation to its plugin system. Each plugin features an adapter and a Docker image, and Optimus supports Python transformation for easy custom plugin development.Key advantages of OptimusLike Google Cloud, Gojek is all about flexibility and agility, so we love to see open source software like Optimus helping users take full advantage of multi-tenancy solutions to meet their specific needs. Through a variety of configuration options and a robust CLI, Optimus ensures that data transformation remains fast and focused by preparing SQL correctly. Optimus handles all scheduling, dependencies, and table creation. With the capability to build custom features quickly based on new needs through Optimus plugins, you can explore more possibilities. Errors are also minimized with a configurable alert system that flags job failures immediately. Whether to email or Slack, you can trigger alerts based on specific requirements – from point of failure to warnings based on SLA requirements.How you can contributeWith Firehose and Optimus working in tandem with Google Cloud, Gojek is helping pave the way in building tools that enable data users and engineers to achieve fast results in complex data environments.Optimus is developed and maintained at Github and uses Requests for Comments (RFCs) to communicate ideas for its ongoing development. The team is always keen to receive bug reports, feature requests, assistance with documentation, and general discussion as part of its Slack community.Related ArticleIntroducing Firehose: An open source tool from Gojek for seamless data ingestion to BigQuery and Cloud StorageThe Firehose open source tool allows Gojek to turbocharge the rate it streams its data into BigQuery and Cloud Storage.Read Article
Quelle: Google Cloud Platform

Welcome Karen Dahut to Google Public Sector

We recently announced the launch of Google Public Sector, a new Google subsidiary focused on helping U.S. federal, state, and local governments, and educational institutions accelerate their digital transformations. Google Public Sector brings Google technologies to government and education customers at scale, including open and scalable infrastructure; advanced data and analytics, artificial intelligence, and machine learning; modern collaboration tools like Google Workspace; advanced cybersecurity products; and more—so that agencies and institutions can better serve citizens and achieve their missions.In just the few months since the introduction of Google Public Sector, we’ve seen continued momentum. We announced that Google Workspace has achieved the U.S. Department of Defense’s (DOD) Impact Level 4 (IL4) authorization. And building on the success with government customers like the U.S. Navy,Defense Innovation Unit, and the U.S. Department of Veteran Affairs, we’ve also shared how we’re helping educational institutions like ASU Digital Prep—an accredited online K–12 school offered through Arizona State University—make remote immersive learning technology more accessible to students across the United States and around the world. Today, it is my pleasure to introduce Karen Dahut as the new CEO of Google Public Sector. With more than 25 years of experience in technology, cybersecurity, and analytics, Karen is a highly accomplished executive who has built businesses, developed and executed large-scale growth strategies, and created differentiated solutions across both commercial and federal industries. Karen joins us on Oct. 31. At that time, Will Grannis, who designed and launched Google Public Sector as founding CEO, will return to his role as the CTO of Google Cloud. Karen was previously sector president at Booz Allen Hamilton, where she led the company’s $4 billion global defense business—representing half of the firm’s annual revenue—and global commercial business sector, which delivered next-generation cybersecurity solutions to Fortune 500 companies. Under her leadership, Booz Allen became the premier digital integrator helping federal agencies use technology in support of their missions.Karen also has deep experience in building innovative solutions that help organizations tackle their toughest challenges. For example, at Booz Allen, she served as chief innovation officer and built the firm’s Strategic Innovation Group, which delivered new capabilities in cybersecurity, data science, and digital technologies. Prior to Booz Allen, Karen was an officer in the U.S. Navy and served as the controller for the Navy’s premier biomedical research institute. We believe Google Public Sector will continue to play a critical role in applying cloud technology to solve complex problems for our nation—across U.S. federal, state, and local governments, and educational institutions. We’re excited today to have Karen leading this new subsidiary, providing more choice in the public sector and helping scale our services to more government agencies nationwide.
Quelle: Google Cloud Platform

Building trust in the data with Dataplex

Analytics data is growing exponentially and so is the dependence on the data in making critical business and product decisions.  In fact, the best decisions are said to be the ones which are backed by data. In data, we trust!  But do we trust the data ? As the data volumes have grown – one of the key challenges organizations are facing is how to maintain the data quality in a scalable and consistent way across the organization.  While data quality is not a newly found need,  the needs used to be  contained when the data footprint was small and data consumers were few. In such a world, data consumers knew who the producers were and producers knew what the consumers needed. But today, data ownership is getting distributed and data consumption is finding new users and use cases.  So the existing data quality approaches find themselves limited and are isolated to certain pockets of the organization.  This often exposes data consumers to inconsistent and inaccurate data which ultimately impacts the decisions made from that data.  As a result, organizations today are losing 10s of millions of dollars due to the low quality of data.These organizations are looking for solutions that empower their data producers to consistently create high quality data cloud scale. Building Trust with Dataplex data quality Earlier this year,  at Google Cloud,  we launched Dataplex, an intelligent data fabric that enables governance and data management across distributed data at scale.  One of the key things Dataplex enables out-of-box is for data producers to build trust in the data with a built-in data quality. Dataplex data quality task delivers a declarative, data-ops centric experience for validating data across BigQuery and Google Cloud Storage.  Producers can now easily build and publish quality reports or can easily include data validations as part of their data production pipeline.  Reports can be aggregated across various data quality dimensions and the execution is entirely serverless.Dataplex data quality task provides  – A declarative approach for defining “what good looks like” that can be managed as part of a CI/CD workflow.  A serverless and managed execution with no infrastructure to provision. Ability to validate across data quality dimensions like  freshness, completeness, accuracy and validity.Flexibility in execution – either by using Dataplex serverless scheduler (at no extra cost) or executing the data validations as part of a pipeline (e.g. Apache Airflow).Incremental execution – so you save time and money by validating new data only. Secure and performant execution with zero data-copy from BigQuery environments and projects. Programmatic consumption of quality metrics for Dataops workflows. Users can also execute these checks on data that is stored in BigQuery and Google Cloud Storage but is not yet organized with Dataplex.  For Google Cloud Storage data that is managed by Dataplex, Dataplex auto-detects and auto-creates tables for structured and semi-structured data. These tables can be referenced with the Dataplex data quality task as well. Behind the scenes – Dataplex makes use of an open source data quality engine – Cloud Data Quality Engine – to run these checks. Providing an open platform is one of our key goals and we have made contributions to this engine to integrate seamlessly with Dataplex’s  metadata and serverless environment.You can learn more about this in our product documentation. Building enterprise trust at American Eagle Outfitters One of our enterprise customers  – American Eagle Outfitters (AEO) – is continuing to build trust in their critical data using Dataplex Data Quality Task.  Kanhu Badtia, lead data engineer from AEO, shares their rationale and experience with Dataplex data quality task:  “AEO is a leading global specialty retailer offering high-quality & on-trend clothing under its American Eagle® and Aerie® brands. Our company operates stores in the United States, Canada, Mexico, and Hong Kong, and ships to 81 countries worldwide through its websites. We are a data-driven organization that utilizes data from physical and digital store fronts, from social media channels, from logistics/delivery partners and many other sources through established compliant processes. We have a team of data scientists and analysts who create models, reports and dashboards that inform responsible business decision-making on such matters as inventory, promotions, new product launches and other internal business reviews. As the data engineering team at AEO, our goal is to provide highly trusted data for our internal data consumers. Before Dataplex – AEO had methods for maintaining data quality that were effective for their purpose. However, those methods were not scalable with the continual expansion of data volume and demand for quality results from our data consumers.  Internal data consumers identified and reported quality issues where ‘bad data’ was impacting business critical dashboards/reports . As a result, our teams were often in “fire-fighting” mode – finding & fixing bad data. We were looking for a solution that would standardize and scale data quality across the production data pipelines. The majority of AEO’s business data is in Google’s BigQuery or in Google Cloud Storage (GCS). When Dataplex launched the data quality capabilities, we immediately started a proof-of-concept. After a careful evaluation, we decided to use it as the central data quality framework for production pipelines. We liked that – It provides an easy declarative (YAML) & flexible way of defining data quality. We were able to parameterize it to use across multiple tables. It allows validating data in any BigQuery table with a completely serverless and native execution using existing slot reservations. It allows executing these checks as part of the ETL pipelines using DataPlex Airflow Operators. This is a huge win as pipelines can now pause further processing if critical rules do not pass. Data quality checks are executed in parallel which gives us the required execution efficiency in pipelines. Data quality results are stored centrally in BigQuery & can be queried to identify which rules failed/succeeded and how many rows failed. This enables defining custom thresholds for success. Organizing data in Dataplex Lakes is optional when using Dataplex data quality. Our team truly believes that data quality is an integral part of any data-driven organization and Dataplex DQ capabilities align perfectly with that fundamental principle. For example, here is a sample Google Cloud Composer / Airflow DAG  that loads & validates the “item_master” table and stops downstream processing if the validation fails.It includes simple rules for uniqueness, completeness and more complex rules for referential integrity or business rules such as checking daily price variance. We publish all data quality results centrally to a BigQuery table, such as this:Sample data quality output tableWe query this output table for data quality issues & fail the pipeline in case of critical rule failure. This stops low quality data from flowing downstream. We now have a repeatable process for data validation that can be used across the key data production pipelines. It standardizes the data production process and effectively ensures that bad data doesn’t break downstream reports and analytics.”Learn moreHere at Google – we are excited to enable our customer’s journey to high quality, trusted data.  To learn more about our current data quality capabilities please refer to – Dataplex Data Quality OverviewSample Airflow DAG with Dataplex Data Quality taskRelated ArticleStreamline data management and governance with the unification of Data Catalog and DataplexData Catalog will be unified with Dataplex, providing an enterprise-ready data fabric that enables data management and governance at scale.Read Article
Quelle: Google Cloud Platform

Evolving our data processing commitments for Google Cloud and Workspace

At Google, we are constantly looking to improve our products, services, and contracts so that we can better serve our customers. To this end, we are pleased to announce that we have updated and merged our data processing terms for Google Cloud, Google Workspace (including Workspace for Education), and Cloud Identity (when purchased separately) into one combined Cloud Data Processing Addendum (the “CDPA”).The CDPA maintains the benefits of the previously separate Data Processing and Security Terms for Google Cloud customers and Data Processing Amendment for Google Workspace and Cloud Identity customers, while streamlining and strengthening Google’s data processing commitments. A corresponding new CDPA (Partners) offers equivalent commitments to Google Cloud partners.  As part of this update, we have also incorporated the new international data transfer addendum issued by the U.K. Information Commissioner (“U.K. Addendum”). The U.K. Addendum allows the EU Standard Contractual Clauses (“SCCs”) to be used for transfers of personal data under the U.K. GDPR, replacing the separate U.K. SCCs that previously formed part of our terms. For an overview of the European legal rules for data transfers and our approach to implementing the EU SCCs and U.K. Addendum, please see our updated whitepaper. You can view our SCCs here.While our data processing terms have been renamed, consolidated, and updated, our  commitment to protecting the data of all Google Cloud, Workspace and Cloud Identity customers and all Google Cloud partners, and to enabling their compliance with data transfer and other regulatory requirements, remains unchanged.For more information about our privacy commitments for Google Cloud, Google Workspace, and Cloud Identity, please see our Privacy Resource Center.Related ArticleLeading towards more trustworthy compliance through EU Codes of ConductGoogle Cloud explains how its public commitment to supporting EU data protection requirements can help develop more trustworthy complianc…Read Article
Quelle: Google Cloud Platform