DataStax brings Apache Cassandra as a service to Google Cloud

At Google Cloud, we are committed to bringing open source technologies to our customers. For the last decade, Apache Cassandra has been an open source database of choice behind many of the largest internet applications.  While Cassandra’s scale-out architecture can support applications with massive amounts of data, it can be complex to deploy, manage, and scale. This is why many enterprises, moving more of their workloads to the cloud, have been asking for an easier way to run Cassandra workloads on Google Cloud.We are excited to announce the general availability of DataStax’s Cassandra as a Service, called Astra, on the Google Cloud Marketplace. This means you can now get a single, unified bill for all Google Cloud services as well as DataStax Astra. In addition, Datastax Astra is integrated into our console to provide a seamless user experience. Developers can now create Cassandra clusters on Google Cloud in minutes and build applications with Cassandra as a database as a service without the operational overhead of managing Cassandra. Datastax Astra on Google Cloud is available in seven regions across the U.S., Europe, and Asia, with a free tier in either South Carolina (US-EAST1) or Belgium (EUROPE-WEST1).Astra deploys and manages your enterprise’s Cassandra databases directly on top of Google Cloud’s infrastructure so that your data sits in the same Google Cloud global infrastructure as your apps. This means users and enterprises can deliver a high-performance experience at a global scale. Astra users will find a consistent developer experience with open-source Cassandra tools and APIs, as well as REST and GraphQL endpoints and a browser-based CQL shell. Check out the DataStax documentation for additional details.DataStax Astra Cassandra as a Service topology deployed on Google Cloud, using OSS Kubernetes Operator to deploy Apache Cassandra across three Google Cloud zones.How enterprises are using CassandraCompanies like Cisco and METRO see strong opportunities in scaling infrastructure and building efficiency with DataStax Astra on Google Cloud.   Customers rely on Cisco technologies for networking, multi-cloud, and security. “Our team has been working for the past couple of years to ensure our infrastructure is set up to scale to meet unforeseen challenges,” said Maniyarasan Selvaraj, lead Cisco engineer. “Cassandra is at the center of this with its reliability, resilience, and scalability. We are looking forward to the new release of DataStax Astra that could offer us an easier, better experience for Cassandra deployment and application development in the cloud.”METRO, a B2B wholesaler and retail specialist, relies on DataStax and Google Cloud for its digital transformation. “At METRO, we decided to become a digital player and to change the way we build and run software. We moved from on-premises, waterfall and commercial systems to cloud, agile and open source, working with DataStax and Cassandra,” says Arnd Hannemann, technical architect at METRONOM, the tech unit at METRO. “To take us to the next stage, teams will need more flexibility of what and how they use cloud infrastructure. Since most of our application teams are already using Cassandra as a main data store, the new DataStax Astra on Google Cloud promises to deliver this flexibility with very low effort and maintenance.”Ready to start building Cassandra apps in the cloud? You can find Astra in the Google Cloud marketplace. Astra has a 10 GB free tier and billing is integrated within the Google Cloud experience. You can also take it for a test drive.
Quelle: Google Cloud Platform

Get to know Google Cloud with our new Architecture Framework

Are you using Google Cloud or thinking about making the move to the cloud? Are you a cloud architect or cloud engineer who needs to ensure your services are secure and reliable yet also manageable during day-to-day operations? We have heard feedback from many of you that you need a structured approach for efficiently running your business on Google Cloud and today we’re excited to deliver just that. Today we are making Google Cloud’s Architecture Framework available to everyone. This framework provides architecture best practices and implementation guidance on products and services to aid your application design choices based on your unique business needs. With the help of this framework, you can quickly identify areas where your approach differs from recommended best practices, so you can apply them across your organization to ensure standardization and achieve consistency. The framework provides a foundation for building and improving your Google Cloud deployments using four key principles: Operational excellence – Guidance on how to make design choices in the cloud to improve your operational efficiency. These include approaches for automating the build process, implementing monitoring and disaster recovery planning. Security, privacy and compliance – Guidance on various security controls you can choose along with a list of products and features best suited to support security needs for your deployments. Reliability – How to build reliable and highly available solutions. Recommendations include defining reliability goals, improving your approach to observability (including monitoring), establishing an incident management function, and techniques to measure and reduce the operational burden on your teams.Performance Cost Optimization – Suggestions on various available tools to tune your applications for a better end-user experience and analyze the cost of operation on Google Cloud, while maintaining an acceptable level of service.Each section provides details on strategies, best practices, design questions, recommendations, and more. You can use this framework during various stages of your cloud journey, from evaluating design choices across various products to incorporating various aspects of security and reliability into your design. You can also use the framework for your existing deployments to help you increase efficiency or incorporate new products and features into your solutions to simplify ongoing management.  How to use the frameworkWe recommend reviewing the “System Design Considerations” first and then dive into other specific sections based on your needs. Discover: Use the framework as a discovery guide for Google Cloud Platform offerings and learn how the various pieces fit together to build solutions.  Evaluate:  Use the design questions outlined in each section to guide your thought process while you’re thinking about your system design. If you’re unable to answer the design question, you can review the highlighted Google Cloud services and features to address them.Review:  If you’re already on Google Cloud, use the recommendations section to verify if you are following best practices or as a pulse check to review before deploying to production.The framework is modular so you can pick and choose sections most relevant to you, but we recommend reading all of the sections, because why not! You can learn more about the Google Cloud Architecture Framework here and contact us for additional insights. A special thanks to a village of Googlers who helped deliver this framework, Matt Salisbury, Gustavo Franco, Charles Baer, Tiffany Lewis, Vivek Rau, Shylaja Nukala, Jan Bultmann, Ryan Martin, Dom Jimenez, Hamidou Dia, Lindsey Scrase, Lakshmi Sharma, Amr Awadallah, Ben Jackson, Jim Travis
Quelle: Google Cloud Platform

Using logging for your apps running on Kubernetes Engine

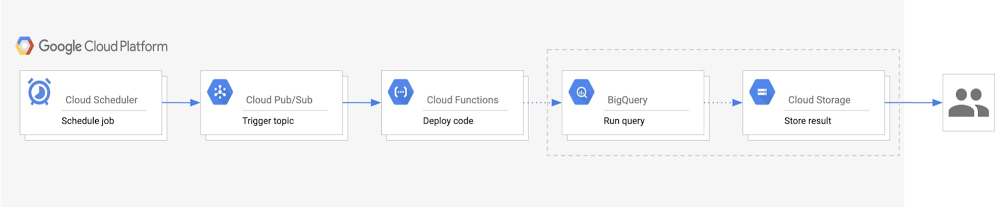
Whether you’re a developer debugging an application or on the DevOps team monitoring applications across several production clusters, logs are the lifeblood of the IT organization. And if you run on top of Google Kubernetes Engine (GKE), you can use Cloud Logging, one of the many services integrated into GKE, to find that useful information. Cloud Logging, and its companion tool Cloud Monitoring, are full featured products that are both deeply integrated into GKE. In this blog post, we’ll go over how logging works on GKE and some best practices for log collection. Then we’ll go over some common logging use cases, so you can make the most out of the extensive logging functionality built into GKE and Google Cloud Platform. What’s included in Cloud Logging on GKEBy default, GKE clusters are natively integrated with Cloud Logging (and Monitoring). When you create a GKE cluster, both Monitoring and Cloud Logging are enabled by default. That means you get a monitoring dashboard specifically tailored for Kubernetes and your logs are sent to Cloud Logging’s dedicated, persistent datastore, and indexed for both searches and visualization in the Cloud Logs Viewer. If you have an existing cluster with Cloud Logging and Monitoring disabled, you can still enable logging and monitoring for the cluster. That’s important because with Cloud Logging disabled, a GKE-based application temporarily writes logs to the worker node, which may be removed when a pod is removed, or overwritten when log files are rotated. Nor are these logs centrally accessible, making it difficult to troubleshoot your system or application. In addition to cluster audit logs, and logs for the worker nodes, GKE automatically collects application logs written to either STDOUT or STDERR. If you’d prefer not to collect application logs, you can also now choose to collect only system logs. Collecting system logs are critical for production clusters as it significantly accelerates the troubleshooting process. No matter how you plan to use logs, GKE and Cloud Logging make it simple and easy–simply start your cluster, deploy your applications and your logs appear in Cloud Logging!How GKE collects logsGKE deploys a per-node logging agent that reads container logs, adds helpful metadata, and then sends the logs to the logs router, which sends the logs to Cloud Logging and any of the Logging sink destinations that you have configured. Cloud Logging stores logs for the duration that you specify or 30 days by default. Because Cloud Logging automatically collects standard output and error logs for containerized processes, you can start viewing your logs as soon as your application is deployed.Where to find your logsThere are several different ways to access your logs in Logging depending on your use case. Assuming you’ve already enabled the workspace, you can access your logs using: Cloud Logging console – You can see your logs directly from the Cloud Logging console by using the appropriate logging filters to select the Kubernetes resources such as cluster, node, namespace, pod or container logs. Here are some sample Kubernetes-related queries to help get you started. GKE console – In the Kubernetes Engine section of the Google Cloud Console, select the Kubernetes resources listed in Workloads, and then the Container or Audit Logs links. Monitoring console – In the Kubernetes Engine section of the Monitoring console, select the appropriate cluster, nodes, pod or containers to view the associated logs. gcloud command line tool – Using the gcloud logging read command, select the appropriate cluster, node, pod and container logs.For custom log aggregation, log analytics or to integrate with third-party systems, you can also use the logging sinks feature to export logs to BigQuery, Cloud Storage and Pub/Sub. For example, you can export logs to BigQuery and then use SQL queries to analyze application logs over an entire year. Or you may need to export specific logs to an existing third-party system using an integration with Pub/Sub. The best way to access your logs depends on your use case.Logging recommendations for containerized applicationsBefore we dive into some typical use cases for logging in GKE, let’s first review some best practices for using Cloud Logging with containerized applications:Use the native logging mechanisms of containers to write the logs to stdout and stderr.If your application cannot be easily configured to write logs to stdout and stderr, you can use a sidecar pattern for logging.Log directly with structured logging with different fields. You can then search your logs more effectively based on those fields.Use severities for better filtering and reducing noise. By default, logs written to the standard output are on the INFO level and logs written to the standard error are on the ERROR level. Structured logs with JSON payload can include a severity field, which defines the log’s severity.Use the links to the logs directly from the Kubernetes Engine section of the Cloud Console for containers which makes it quick to find the logs corresponding to the container.Understand the pricing, quota, and limits of Cloud Logging to understand the associated costs. Use casesNow, let’s look at some simple yet common use cases for logs in a GKE environment: diagnosing application errors, analyzing simple log data, analyzing complex log data, and integrating Cloud Logging with third-party applications. Read on for more. Using Cloud Logging to diagnose application errors Imagine you’re a developer and need to diagnose an application error in a development cluster. To use a concrete example, we will work through a scenario based on a sample microservices demo app deployed to a GKE cluster. You can deploy this demo app in your own Google Cloud project or you can go through the Site Reliability Troubleshooting Qwiklab to deploy a version of this demo app that includes an error. In the demo app, there are many microservices and dependencies among them.Let’s say you start receiving ‘500’ Internal Server Errors from the app when you try to place an order:Let the debugging begin! There are two quick ways to find the logs:1. Use the Kubernetes Engine console – Start by opening the checkout service in the Kubernetes Engine console, which has all the technical details about the serving pod, the container and links to the container and audit logs. There, you can find the technical details about the pod along with the links for container and audit logs.If you click the log link for the container, you will be directed to the Cloud Logging’s logs viewer with a pre-populated search query similar to the one below. This is created for you and points you to the specific container logs for the application running in the checkoutservice pod.2. Use the Logs Viewer in the Cloud Logging console – you can go directly to the Cloud Logging console and use the Logs Viewer to search for error messages across specific logs. You can specify the resource types, search fields, and a time range to speed up your query (more tips here). The Logs Viewer provides both a Classic and a Preview option. The Query builder in the Logs Viewer Preview lets you specify those filtering conditions quickly. For instance, you can select the resources in the dropdown menus for the cluster, namespace, and container.This selection in the Query Builder yields the following query:If you are not familiar with the codebase for the app, you’ll need to do some debugging with the logs to fix the issue. One good starting point is to search for the error message in the logs to understand the context of the error. You can add the field jsonPayload.error to your query to look for the specific log message that you received. To keep your queries most efficient, make sure to include the resource.type field.One of the helpful features included in the Preview of the Logs Viewer is a histogram, which lets you visualize the frequency of the logs matched by your query. In this example, this helps us understand how often our error appears in the logs.Next, you can look at the specific log entries that matched the query.If you expand the log entries, the payment-related log entry provides you with details about the pod, container, and a stack trace of the error. The logs point to the exact location of the defective code. Alternatively, if you prefer to use the command-line interface, you can run the same commands via Cloud Shell. Notice the conditions used in the query and the stderr log it searches.Analyzing log dataAnother common use case for logging is to analyze the log data with complex and powerful queries using built-in logging query language. You can use the query builder to build your queries or use the autocomplete to build a custom query. To find log entries quickly, you can include the exact values for the indexed log fields such as resource.type, logName and severity. Below are several example queries. You can use this query to check if an authorized user is trying to execute a command inside a container by replacing cluster_name and location with your specific cluster’s name and zone values:You can use this query to check if a specific user is trying to execute a command inside a container by replacing cluster_name, location and principalEmail with your specific cluster’s name, zone and email address values:This query filters pod-related log entries within a given time period by replacing replacing cluster_name, location, pod and timestamp with your specific cluster’s name, zone, pod and time values:You can find more sample queries for product-specific examples of querying logs across Google Cloud. You can also find specific GKE audit log query examples to help answer your audit logging questions.Using Cloud Logging for advanced analytics For more advanced analytics, you may want to export your logs to BigQuery. You can then use standard SQL queries to analyze the logs, correlate data from other sources and enrich the output. For example, the following SQL query returns log data related to the email ‘user@example.com’ from the default namespace on a GKE cluster running the microservices demo app.This log data may also provide valuable business insights. For example, the query below lets you know how many times a particular product was recommended by the recommendationservice in the last two days:You can also analyze the activity and audit logs. For example, the following query returns all kubelet warnings in a specific timeframe:If you are interested, you can find more sample queries in the Scenarios for exporting Cloud Logging: Security and access analytics article.Using Cloud Logging for third-party tools or automationThe last use case we want to mention is integrating Cloud Logging with Pub/Sub. You can create sinks and export logs to Pub/Sub topics. This is more than simply exporting the log data. With Pub/Sub, you can create an event-driven architecture and process the log events in real time in an automated fashion. If you implement this event-driven architecture with serverless technologies such as Cloud Run or Cloud Functions, you can significantly reduce the cost and management overhead of the automation.Learn more about Cloud Logging and GKEWe built our logging capabilities for GKE into Cloud Logging to make it easy for you to store, search, analyze, and monitor your logs. If you haven’t already, get started with Cloud Logging on GKE and join the discussion on our mailing list.
Quelle: Google Cloud Platform

Automating BigQuery exports to an email

Data accessibility and analysis is a crucial part of getting value from your data. While there are many methods to view data when it comes to BigQuery, one common way is to export query results as an email on a scheduled basis. This lets end users get an email with a link to the most recent query results, and is a good solution for anyone looking for daily statistics on business processes, monthly summaries of website metrics, or weekly business reviews. Whatever the query may be, stakeholders who need the information can access data easily via email for relevant insights. In this post, we’ll describe a way to easily automate exporting results from BigQuery to email.Design considerations for results emailsAn important design consideration is the size and complexity of the data. Keep in mind the size constraints for email attachments and for exporting large queries from within BigQuery. In the case that the query results are over 1 GB, BigQuery will output the results into multiple tables. As a result, you would need to send multiple CSV attachments in the email.If you have G Suite access, you can do this using scheduled Apps Script, which uses the BigQuery API to run the query and export the results to a Google Sheet. A time-based trigger on the script will refresh the data at scheduled intervals. With this, you could easily send an email with a link to the Sheet using the Gmail Service. This method depends on G Suite. For a more general solution, we recommend using Google Cloud as the primary solution to automate BigQuery exports to an email. It involves a couple of Google Cloud products and the SendGrid API for sending the emails. Here’s how to do that.Automating BigQuery results to an email We’ll walk you through how to build an automated process to export BigQuery results into email, starting with the steps and a look at the architecture diagram.Create a Pub/Sub topic that will trigger your Cloud Functions code to run.Set up a BigQuery dataset and Cloud Storage bucket for your exports.Build a Cloud Function with the code that runs the query, exports results, and sends an email.Create a Cloud Scheduler job tied to the Pub/Sub topic to automatically run the function on a scheduled basis.Here’s a look at the architecture of this process:Click to enlargeWithin this architecture, you’ll see: Cloud Scheduler: A Cloud Scheduler job invokes the Pub/Sub topic to schedule the email export periodically.  Pub/Sub: A Pub/Sub topic triggers the Cloud Function. Cloud Function: A Cloud Function subscribes to the Pub/Sub topic and runs the code calling the BigQuery and Cloud Storage APIs.BigQuery: The BigQuery API generates the query results, stores them in a table, and then exports the results as a CSV into Cloud Storage. Cloud Storage: A Cloud Storage bucket stores the CSV file. The Cloud Storage API generates a signed URL for the CSV that is sent out as an email to users.  Last, the SendGrid API sends an email with the link to the signed URL to the specified recipients. Getting started with email exportsThere are a few one-time setup steps related to storing data and sending emails when you begin this process. First, create a BigQuery dataset that will host the tables created for each export. For example, if you want to receive an email every day, this dataset would have a table for each daily export with a naming convention such as “daily_export_${TIMESTAMP}.” Since this dataset can quickly increase in size, we recommend setting a default table expiration time. This way, the tables holding outdated data can be deleted.Next, create a Cloud Storage bucket to host the exported CSV files from BigQuery. Similar to the dataset expiration time, the bucket lifecycle management configuration can automatically delete the CSV or move the file to a different storage class after the time frame defined in the “Age” condition. The final setup step involves configuring access to the SendGrid API. To do this, create an account and generate a SendGrid API key, which will allow the Cloud Function to authenticate with the Email API and send an email. The free tier pricing for SendGrid applies for 40,000 messages per day for the first 30 days, and then 100 per day forever. (We’ll get to the implementation of the API in the next section.)Implementation details Creating a service accountYou will need to create a service account to authenticate SendGrid API. The service account must have the Service Account Token Creator role to generate signed credentials for Cloud Functions. It will also need access to perform the BigQuery and Storage actions, for which the BigQuery Admin and Storage Object Admin roles should be added. The following sample code creates a service account with the previously mentioned roles:Writing the Cloud Functions codeIn order to build this solution, use the Python Client Library to call Google BigQuery and Cloud Storage APIs. Instantiate the client library with the proper service account credentials for the correct authentication to perform the necessary tasks. If the main script will run in Cloud Functions, the credentials default to the Application Default Credentials. In the case that it will run locally, the credentials will use the service account key file provided by the environment variable GOOGLE_APPLICATION_CREDENTIALS. The following sample code demonstrates creating the credentials:Now, to instantiate the client libraries in your main function:Using the BigQuery and Cloud Storage client libraries, you can create a table, output your query results to that table, and export the table data as a CSV to Cloud Storage.Next, generate the signed URL for the CSV file stored in the bucket. This process includes setting an expiration time indicating the duration for which the link can be accessed. The expiration time should be set to the delta in time between emails to prevent recipients from accessing old data. For authentication, Function Identity fetches the function’s current identity (the service account executing the function). iam.Signer() sends a request to that service account to generate OAuth credentials for authenticating the generate_signed_url() function.To send the email using SendGrid API, follow the SendGrid implementation guide for the web API using the token you generated. The following sample shows what that looks like:As shown above, the SendGrid API key can be accessed as an environment variable on Cloud Functions. In order to store the API key more securely, you can also encrypt and store the key with Cloud Key Management Service.Deploying the pipelineTo build the pipeline, create a Pub/Sub topic, deploy the Cloud Function with the code from the previous section, and configure Cloud Scheduler to trigger the pipeline. This sample code shows how to deploy the pipeline locally, assuming that “main.py” holds the Cloud Function code:Now you have an automated pipeline that sends your BigQuery exports straight to a set of emails, allowing for easy data accessibility and analysis.Learn more about the Google Cloud tools used here:Get started with the BigQuery Client Libraries Schedule queries in BigQueryUse signed URLs in Cloud StorageHow to create a Cloud Scheduler job
Quelle: Google Cloud Platform

Get to know Cloud TPUs

Editor’s note: Yufeng Guo is a Developer Advocate who focuses on AI technologies.No matter what type of workloads we’re running, we’re always looking for more computational power. With general purpose processors, we’re quickly coming up against a hard limit: the laws of physics. At the same time, the things we’re trying to accomplish with machine learning keep getting more complex and compute intensive.This need for more specific computational power is what led to the creation of the first tensor processing unit (TPU). Google purpose-built the TPU to tackle our own machine learning workloads, and now they’re available to Google Cloud customers. The more we understand about TPUs, and why they were built the way they are, the better we can design machine learning architectures and software systems to tackle even more complex problems in the future.In this two-part video series, I look at the origins of the customer AI chip and what makes the TPU so specialized for your AI challenges. First dive into the history and hardware of TPUs. You’ll learn why Google created an application specific integrated circuit (ASIC) for AI workloads like Translate, Photos, and even Search. You’ll also learn about the TPU architecture and how it differs from CPUs and GPUs.Next, dive into the TPU v2 and v3, publicly available through Google Cloud. Learn more about their performance capabilities, like connecting thousands together in the form of Cloud TPU Pods. This video also covers basic benchmark examples, and new usability improvements with TensorFlow 2.0 and the Keras API.Learn more about Cloud TPUs and pricing at the website and check out the documentation to see how to get started. You can also join our Kaggle community and the second competition using TPUs to identify toxicity comments across multiple languages. For more information about AI in general, check out the AI Adventures series on YouTube.
Quelle: Google Cloud Platform

Manage logs from multiple clouds and on-premises workloads together

We’ve heard from our customers that you need visibility into metrics and logs from Google Cloud, other clouds, and on-prem in one place. Google Cloud has partnered with Blue Medora to bring you a single solution to save time and money in managing your logs in a single place. Google Cloud’s operations management suite gives you the same scalable core platform that powers all internal and Google Cloud observability. Adding Blue Medora’s software, BindPlane, helps collect the metrics and logs and push them into the open APIs that form our core observability platform. This solution is now generally available and comes at no additional cost for Google Cloud users.Eastbound Tech, a U.S.-based IT consulting company focused on infrastructures and databases, replaced their six-figure security information and event management (SIEM) solution. “The Blue Medora and Cloud Logging solution has allowed me to gather signals from a really diverse environment and see them in a single pane of glass,” says founder and CEO Timothy Wright. “This has saved us significant money and effort otherwise spent on managing additional tools and open source solutions.” How BindPlane Logs for Cloud Logging worksGetting started with BindPlane Logs is simple. Once a log source is ingested into Cloud Logging, you can view and search through the raw log data and create metrics off of those log files just like logs collected from Google Cloud. You can use all the features of Google Cloud’s operations management suite, including viewing logs in real time in the Cloud Console or through log-based metrics to view logs and metrics side by side and alert on logs. (Using BindPlane Logs has no additional charge over logs collected from within Google Cloud.)The BindPlane Logs agent is deployed via a single-line install command for Windows and Linux and a YAML file for Kubernetes to shorten the time it takes to get data streaming into Cloud Logging. The BindPlane Logs agent is based on Fluentd. For collection and parsing, your existing Fluentd input configuration can be shared between the Cloud Logging agent and the BindPlane log agent. BindPlane’s centralized collection simplifies updates and configuration changes, saving time as you update your agents from a central remote location all at once. BindPlane includes deployment templates to reduce the time it takes to deploy a log agent with the same source and destination configurations to clustered applications.Managing Blue Medora’s BindPlane logs for Google Cloud Logging.BindPlane log sources BindPlane for Cloud Logging today supports more than 50 log sources, including Oracle, mySQL, PostgreSQL, Apache Tomcat, NGINX, Palo Alto Networks, and more. Check out the BindPlane documentation page to see more supported resources.Learn more about BindPlane Logs for Cloud Logging and register to use these logs at no additional charge.
Quelle: Google Cloud Platform

How Sesame pivoted during COVID-19 to support local healthcare providers

COVID-19 is forcing us all to adapt to new realities. This is especially true for the healthcare industry. From large healthcare providers to pharmaceutical companies to small, privately run practices, nearly every customer in the healthcare industry is re-evaluating and shifting their strategies. To mitigate the spread of the coronavirus and protect frontline workers, most healthcare providers are limiting in-person patient visits to the critically ill and shifting nearly all other patient visits to virtual settings. However, for small, privately run practices, suddenly pivoting to a telehealth model is extremely daunting given their limited IT resources.To help these smaller providers, Sesame, a recent graduate from our Google Cloud for Startups program, quickly pivoted its offering to an easy-to-use platform that allows them to connect with patients in a fully remote setting. Through these telehealth services, more physicians are now available to handle non-COVID-related issues and ease the burden on the overall healthcare system. Let’s take a closer look at how Sesame made this change to its business so quickly and how it’s helping providers across the United States.Sesame’s pivot to offer telehealth servicesSesame was founded to provide a new, more innovative approach to connecting patients and physicians. With a mission to make healthcare more transparent, accessible, and affordable for all, Sesame created a direct-pay marketplace that connects patients and care providers directly via the web. The marketplace, which covers everything from skin screening to tooth cleaning to MRIs, highlights cash-based, up-front prices and clear descriptions of services, making it easier for patients to find the right care at the right price. It also gives small independent practices more clarity and control over patient scheduling and billing, and new patient acquisition.In January, when COVID-19 first entered the global vernacular, Sesame was still operating in two small markets: Kansas City and Oklahoma City. While telemedicine was on its roadmap, it wasn’t a top priority—nearly 100% of its business came through in-person visits with the local providers it had signed on. But, as the pandemic escalated, Sesame quickly transformed its business and introduced a new virtual appointment and telemedicine system built using Twilio and Google Cloud. As the pandemic progressed and small practices began shutting their doors to non-emergency care, the Sesame team went to work to come up with a way it could help these caregivers keep patients healthy, while finding new ways to care for them. The team quickly worked up a wireframe for a virtual appointment system that providers could use to administer healthcare remotely. Five days later, the service was up and running. As Dr. Rebecca Berens at Vida Family Medicine in Houston said, “Sesame allowed me to quickly and easily launch telemedicine to reach patients state-wide who are in need of virtual services during the pandemic. While I already offered these services locally, they gave me a larger platform which allows me to reach more patients.”Sesame is now operating in 48 states across the nation, with 86% of its bookings coming through virtual appointments—all because of the team’s ability to pivot and move fast. As Priya Patel, Sesame’s VP of product, explains, “We went from testing our product and strategies in two small markets to being a nationwide service in just a few weeks. It’s been a great experience for the entire company to come together and make a real impact during a critical time.”Building from the right foundationSesame points to the foundation it laid early on as the reason it could move so quickly. When the company was first founded, the product team spent a great deal of time up-front understanding the patient and provider experience, finding ways to make the process of searching, booking, and paying for services as easy as possible for people who might not be technically savvy. It was during this time they made the decision to build on Google Cloud and develop a microservices architecture powered by Google Kubernetes Engine that would allow them to adjust and scale as they learned. According to Michael Botta, co-founder of Sesame, that decision paid off when it came to developing a care platform that was not only HIPAA-compliant, but also could scale nationally in a matter of weeks. “The only way we could have done this was because we didn’t run a monolithic architecture,” he explained. “We could just build a new microservice, slot it in and have it work with our existing infrastructure to administer payments, manage connections between search and check out, connect to a video conference back-end, and guide customers through the process. Our architecture, the Google Cloud Platform, and our work with the Google team gave us exactly what we needed to build and integrate something of this magnitude.”The promise of virtual careWhile adapting to COVID-19, Sesame has been focused on getting even more providers on its virtual appointment system, making it available for free to providers. Since mid-April, Sesame estimates it has increased its provider network by more than 50%. With more healthcare providers coming on board, Sesame can now offer a greater range of services to help providers serve a wider group of patients, ultimately improving the economics for everyone involved—Sesame, its providers, and their patients. The situation is also opening many people’s eyes to the value of virtual care. “Even surgeons are surprised at how much can be accomplished through a virtual appointment,” said Sesame CEO David Goldhill. “Before COVID-19, telemedicine was very much a niche product. But circumstances have changed, and that is encouraging a broad variety of physicians and other care providers to figure out how good care can be delivered in this new way.”COVID-19 has changed the dynamics in the healthcare industry, fast-tracking the adoption of new technologies. Through partners like Sesame, as well as with our own products like our Cloud Healthcare API, we’re dedicated to working with healthcare organizations to deliver solutions that help them provide the best patient care, while keeping healthcare workers safe.Learn more about Google Cloud for healthcare.
Quelle: Google Cloud Platform

Keep your users safe with reCAPTCHA Enterprise

Globally, organizations across industries have been working to expand their online footprint to continue doing business. Whether it’s to help more workers safely do their job from home, to help customers interact with them more efficiently, or other reasons, this sudden shift has put a strain on IT teams, in particular. Cybercriminals are also taking advantage of current events to attempt and reframe malicious activities.reCAPTCHA Enterprise—which we made generally available earlier this year as a service for Google Cloud—can help protect your website from fraudulent activity, spam, and abuse. Today we’ll discuss how it can detect some of the most common web-based attacks and reduce your end users’ and business’ exposure to risk. How it worksreCAPTCHA Enterprise is a frictionless fraud detection service that leverages our experience from more than a decade of defending the internet and data for our network of four million sites. It can be installed on any web page at the point of action—whether it’s login verification, on the purchase page, or at account creation—to help detect and prevent fraud. Meanwhile, legitimate users will be able to login, make purchases, view pages, and create accounts and fake users will be blocked.At its core, reCAPTCHA Enterprise works by using advanced risk analysis strategies to tell humans and bots apart. It provides security teams with several features, including extra granular risk scores, reason codes for high-risk scores, and the ability to tune the risk analysis engine to your site’s specific needs. For example, any action can have a fraud risk score attached to it which can inform your team of suspicious activity.Using the reCAPTCHA Enterprise adaptive risk analysis engine, your countermeasures will stop bots and other automated attacks while approving valid users. Let’s take a look at some of the attacks reCAPTCHA can help stop.  Account Takeovers (ATOs) and Hijacking: This attack is when a bad actor uses a stolen or leaked credential to login and take over a legitimate user’s account. With the recent rise in credential losses, these attacks are rapidly rising to become the top threat. The correct password is no longer a sufficient form of authentication; it must be paired with a secondary layer of security.Fraudulent Transactions: Fraudsters use fake or stolen credit cards to make purchases online, which can often result in a chargeback or involvement with law enforcement. This not only costs your business time and money, but it also provides an avenue for organized crime to use their credit card databases on your site. Scraping: Companies in a variety of industries, including ecommerce, travel, social media, and news, rely on proprietary content as their primary differentiation. Less reputable organizations will often employ bots to steal this content, either for republishing or to gather competitive intelligence.Synthetic Accounts: All manner of fraud on marketplace, ecommerce, and social media sites starts with the creation of a synthetic account. This account can then be leveraged by fraudsters to commit a range of activities from abuse, to spreading misinformation, to creating false listings. To see reCAPTCHA Enterprise in action, watch our video below.To learn more about the different types of attacks reCAPTCHA can help prevent, visit our documentation. To get started with reCAPTCHA today, contact sales.
Quelle: Google Cloud Platform

Anthos in depth: Modern application development and delivery

“Keep calm and carry on.” While the words may resonate with the public, carrying on with business as usual these days is not an option for most enterprises—especially not application development and delivery teams. And to the 71% of CIOs who recently cited “improved agility and faster time to market” as top priorities for their businesses, today, we’re going to talk about how Anthos can help you improve application development and delivery in your organization. Traditionally, application development and delivery has been affected by several shortcomings, which slow your time to market: Siloed application operation teams and tools—one for on-prem and one for each of your cloud environmentsInfrequent rollouts with long lead times that increase risk and complexity of each production deploymentReliability and security issues that don’t get caught during developmentLack of scalability, observability, and governance as you add more applications, teams, and updatesPrinciples for fast, secure, and reliable CI/CDAdopting containerization and a consistent, policy-based platform like Anthos can help you create more secure and reliable applications faster, with more features, so you can stay ahead in a rapidly changing world. But just because you now drive your old sedan on a racetrack doesn’t mean it goes any faster. Likewise, keeping the same old application development and delivery tools and methodologies after adopting Anthos won’t materially change your application development speed.Over the years, Google has worked to build services that operate at tremendous scale. In that time we developed principles for application development and delivery and worked to bring you concepts like SRE and innovations like Kubernetes. With Anthos, you have access to application development and delivery tools that work across on-prem and cloud environments. These tools deliver a number of benefits:Automated build, test, and deployContinuous integration (CI) and continuous delivery (CD) lets you remove the constraints of traditional software delivery cycles and move to an on-demand model. Your application operators can push new code to users quickly by using fully-managed tools that enable easy scaling, maintenance, and updates. We provide guidance for these methodologies that integrate with your current tools: source control, artifact repositories, and issue management, both on-prem and in your multi-cloud environments. Policy-based securitySecurity should be based on policies that are managed centrally and enforced by automated tools. Anthos simplifies the implementation of this principle by creating a common management layer across all of your environments. Anthos Config Management enforces security and governance policies across those environments. Policies can be added or updated with a simplified workflow that does not require code changes. Anthos also includes technologies like Binary Authorization to help you secure your software supply chain, ensuring that the code you built is the code you deploy. With policy-based security, developers can focus on building products and features, not updating code for ever changing governance and compliance standards.Proactive reliability testingCI/CD lets you focus on issue prevention during development and test, rather than having to mitigate problems in production (otherwise known as a shift-left approach), with checks made by automation tools. Our approach to CI/CD supports automated rollouts and rollbacks, and thanks to having a consistent Anthos platform, your test and development environments more closely resemble production so you can find compatibility issues before they make it to production.  CI/CD users and toolsWhen you think about the makeup of a modern CI/CD pipeline, consider three roles within your organization: developers, operators, and security administrators. Let’s take a look at the tools that are available to each and how they interact with each other:Developers can use a git repository for source code management that provides storage for application and configuration code and allows for review of code changes. They can also employ a continuous integration (CI) tool such as Gitlab. This service tests and validates source code, and builds artifacts (container images, for Kubernetes) that can be consumed in the deployment environment. Lastly your developers can use a container registry, which stores the artifacts (container images) built during CI.Operators can also use a git repository where they can store the instructions for how applications will be deployed. Working with a configuration management tool such as Kustomize or Anthos Config Management, they can package together the artifacts created by CI and the deployment instructions. This allows for the reusability and extension of configuration primitives or blueprints. Finally, operators can use a service for continuous delivery (CD), which defines the rollout process of code across environments, facilitates the process between staging and production, and provides easy rollback for failed changes.Security administrators utilize a git repository to store the policies that are applied to your infrastructure (clusters). They work with a policy management service, which is also provided by Anthos Config Management, to provide a mechanism to enforce policies on their clusters (for example: role-based access control, quotas, etc). These clusters can be managed using Anthos GKE to provide container orchestration, run the artifacts built during CI, and provide scaling, health checking and rollout methodologies for workloads. Administrators review and approve changes to policies before they are merged into production clusters.All of these tools are designed to work within your Anthos environment so you can incorporate other Anthos capabilities such as Anthos Service Mesh, which gives you deep visibility into your services and how they are functioning contributing to better resiliency. With an overview of modern CI/CD practices, let’s take a look at how this would be implemented in conjunction with Anthos.CI/CD in an Anthos deploymentFor reasons such as business continuity, regulatory compliance, scalability, proximity to development teams or customers, and more, your software development and delivery process will most likely take place across more than one environment, whether that’s on-prem and cloud, multiple regions, or even across multiple clouds. Let’s take a look at how you can use Anthos to implement CI/CD across two regions where the first region is used for development, testing, and production, and the second region is also used for production:In this example architecture, Anthos Config Management keeps your cluster states in sync and helps security admins ensure that all deployments by application operators adhere to org policies (1). Development clusters are provisioned with Anthos GKE for developers to work on their applications before they enter the deployment process (2). Anthos Service Mesh provides service management capabilities across all clusters in your environment so operators know where they can deploy applications (3). Artifact Registry stores the container images built during the CI phase (4). And finally, applications are deployed uniformly and consistently across all environments by application operators (5). This is how you can harness the power of Anthos to deploy code quickly to production environments anywhere.Partnering for more optionsPart of what makes Google Cloud successful is an ecosystem of partners. GitLab provides CI/CD tooling that is used by more than 100,000 organizations with an active community of more than 2,200 contributors. In the example above, we used GitLab’s CI service to facilitate the process between staging and production. This commitment to partners and open source is core to Google Cloud’s value of avoiding vendor lock in. “Enterprises all over the world use our CI/CD tools to transform and improve their application development and delivery. We’ve partnered with Anthos because it provides a flexible application modernization platform for creating and delivering secure apps across hybrid and multi-cloud environments.” – Brandon Jung, VP of Alliances at GitLabGetting startedThe need to innovate faster has seldom been more critical than it is today. If your organization needs to move faster and you’re interested in getting started with Anthos, please reach out to your account team or fill out this form.  We will set up time with you to discuss how Anthos can help your developers reduce the time they spend on non-coding activities by 23% to 38%1, improve the productivity of your operations teams by 40% to 55%1 and improve productivity for security tasks by 60% to 96%1.1. Total Economic Impact report
Quelle: Google Cloud Platform

Last month today: Google Cloud in April

This month brought spring flowers, and plenty of adaptations to a work-from-home, virtually powered routine. At Google Cloud, we welcomed news of new certifications, lots of updates and news on conferencing with Google Meet, and security additions. Here’s a look at the top stories.Meet online, securely and at no costWe announced that Google Meet, our premium video conferencing product, is now free for everyone. Meet’s availability will be gradually expanding over the next few weeks, and can be used by anyone with an email address.Also last month, we announced that we’re extending our offer for all G Suite customers to use advanced Google Meet features for free until Sept. 30. This includes larger meetings for up to 250 participants, live streaming to 100,000 people within your domain, and meeting recording. Along with that news, we heard from customers about how they’re using Meet to adapt to work-from-home environments, speed up product launches, and more.In addition, Meet’s new features, launched last month, include some top-requested items. These include a tiled layout to see up to 16 meeting participants at once, the ability to present a Chrome tab for higher-quality video content with audio, and noise cancellation. Securing all-virtual meetingsIn an almost-entirely-virtual world, securing online interactions is more important than ever. Our approach to security is simple: Make products safe by default. We designed Meet to operate on a secure foundation, providing the protections needed to keep our users safe, their data secure, and their information private. Meet video meetings are encrypted in transit and we’re regularly updating safety measures and features to help prevent abuse. Learn more. To meet new requirements for remote work, businesses can now use BeyondCorp Remote Access. This is a cloud solution based on the zero-trust approach used within Google for almost a decade. BeyondCorp Remote Access lets your employees and extended workforce access internal web apps for just about any device anywhere—without needing a VPN.  New phishing and malware threats related to COVID-19 have emerged, and our ML models have evolved to understand and filter these threats. We continue to block more than 99.9% of spam, phishing, and malware from reaching our users. Learn more. Multi-cloud capabilities expand, bring flexibilityMulti-cloud platform Anthos can now support AWS applications, so you can consolidate your ops across on-prem, Google Cloud, and AWS, with Microsoft Azure coming soon. This brings flexibility to run apps where you want them without adding complexity. Additionally, Anthos now offers deeper support for virtual machines to make cloud management easier.Understanding API design modelsRPC and REST are the two primary models for API design, and there are varying options to implement modern APIs. This post explores some of the differences, when to choose one or the other, and offers tips on using HTTP for APIs, specifications like OpenAPI, and the benefits of gRPC.Keep learning from homeAll this month, you can explore free cloud learning resources from Qwiklabs and Pluralsight. You’ll find cloud basics and courses in on-demand skill areas, like data analytics, machine learning, and Kubernetes. Once you sign up, you’ll get 30 days of free access.That’s a wrap for April. Stay well and keep in touch on Twitter.
Quelle: Google Cloud Platform