Unlocking the value of unstructured data at scale using BigQuery ML and object tables

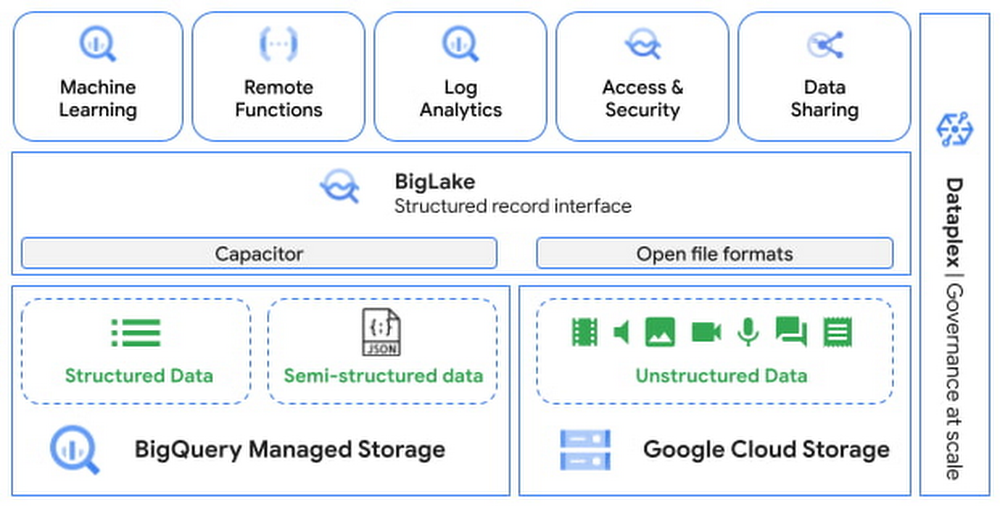
Most commonly, data teams have worked with structured data. Unstructured data, which includes images, documents, and videos, will account for up to 80 percent of data by 2025. However, organizations currently use only a small percentage of this data to derive useful insights. One of main ways to extract value from unstructured data is by applying ML to the data. This could be in the form of extracting objects from images, translating text from one language to another, character recognition from images, sentiment analysis and much more. Performing such tasks is currently achievable by using services that host ML models for these operations. However, business across industries are faced by three major challenges:  Data management: data scientists/analysts have to move stored data to where they build ML pipelines, a notebook or other AI platformsInfrastructure management: there is no security and governance guarantees desired by large enterprisesLimited data science resources: require developing custom solutions in Python, or use frameworks such as Spark or Beam/DataflowBigQuery is an industry leading, fully managed, cloud data warehouse that helps users manage and analyze all of their structured and semi-structured data. Taking advantage of its storage and compute scale, BigQuery also enables users to do in-database machine learning. Now, BigQuery is expanding these capabilities  to unstructured data by providing an integrated solution that eliminates data silos, democratizes compute without sacrificing enterprise-grade security and governance guarantees provided by the underlying Data Warehouse. Data practitioners  can now use familiar SQL constructs to analyze images, text, etc. at scale, and enrich the insights by combining structured and unstructured data in one system. In this article, you will learn:About object tables which enable access to unstructured dataHow to run SQL to get insights from imagesHow to expand unstructured data analytics leveraging Cloud AI servicesIntroducing Object Tables to enable access to unstructured dataAt Next ‘22, we announced the preview of object tables , a new table type in BigQuery that provides metadata for objects stored in Google Cloud Storage. Object tables are powered by BigLake, and serve as the fundamental infrastructure to bring structured and unstructured data under a single management framework. You can now build machine learning models to drive business insights from data in all shapes of forms, without the need to move your data.Run SQL to get insights from images  With easy access to the unstructured data, you can now write SQL on images, and predict results from machine learning models using BigQuery ML. You can import either state of the art TensorFlow Vision models (e.g. ImageNet and ResNet 50) or your own models to detect objects, annotate photos, extract text from images, and much more. You can unify the results of image analysis with structured data (website traffic, sales order, etc.) to train machine learning models to generate insights for better business outcomes. Let’s look at how Adswerve and Twiddy were able to incorporate rental listing images in their analytics to generate search results that resonated the most with their users. User Story from Adswerve & Twiddy Adswerve is a leading Google Marketing, Analytics and Cloud partner on a mission to humanize data. Twiddy & Co. is Adswerve’s client – a vacation rental company in North Carolina, dedicated to creating exceptional customer experiences by helping them to find dream vacation homes. “As a local family vacation rental business specializing in delivering southern hospitality for nearly 45 years, we’ve always strived for our vacation home images to convey the unique local experience that our homes offer. BigQuery ML made it really easy for our business analysts to figure out just the right image creatively by analyzing thousands of potential options and combining them with existing click-through data. This, otherwise, would have taken a lot longer or simply we wouldn’t have done it at all.” — Shelley Tolbert, Director of Marketing, Twiddy & CompanyTo further improve their customer search experience on the website, they are faced by three main challenges: Relying on structured data (e.g. location, size) only to predict what customers might likeThe editorial team uses a manual photo selection processRequire data science resources to build machine learning pipelines and processing data to resize images is labor intensive They wanted to build machine learning models using both website search data and rental listing images to predict the click-through rate of the rental properties. Here is how they accomplished this using BigQuery ML with the new capabilities of Object Table.Step 1: Access to image data by creating an object tableStep 2: Create image embeddings by importing a TensorFlow image modelStep 3: Train a wide and deep BigQuery ML supported model using both image and website data, and predict the click-through rate of rental properties  The results inferred that users are more likely to click on images that had water or other scenic properties. With these insights, Twiddy’s editorial team now makes a more data-driven approach for image selection and editing. This can all be done using SQL, which aligns with their existing analyst skills without having to recruit more specialized data scientists. Watch this demo from Adswerve to learn more.Expanding unstructured data analytics leveraging Cloud AI services Beyond using your own or public machine learning models to analyze unstructured data, we are bringing the Cloud AI services including Translation AI, Vision AI, Natural Language AI, and many others right inside BigQuery. You can translate text, detect objects from photos, perform sentiment analysis on user feedback, and much more all in SQL. You can then incorporate the results into your machine learning models for further analysis. The YouVersion Bible App has been installed on more than half a billion unique devices. It offers Bible text in more than 1,800 languages and supports search in 103 languages. At the start of the geo-political issues in Ukraine, the search volume in Ukrainian nearly doubled. The team wanted to understand what people were searching for and make sure the search results were providing content that would bring people hope and peace. However, without an auto-translate feature, the team had to manually copy and paste each search term into Google translate dozens of times per day for weeks, which was very time-consuming.  With translation capabilities using BigQuery ML, YouVersion will be able to easily learn what users are searching for in the app moving forward. The team will be able to quickly fine-tune search results and generate content that is relevant to their users. This aligns with YouVersion’s desire to serve its global community well by helping the team remove language barriers between them and the people they serve. Watch this demo from YouVersion to learn more. What’s next We will continue to expand these capabilities for different unstructured data types including documents, audios, videos, etc. in the near future. Submit this form to try these new capabilities that unlock the power of your unstructured data in BigQuery using BigQuery ML. You can find other BigQuery ML capabilities announced at Google Cloud Next.
Quelle: Google Cloud Platform

Build a modern, distributed Data Mesh with Google Cloud

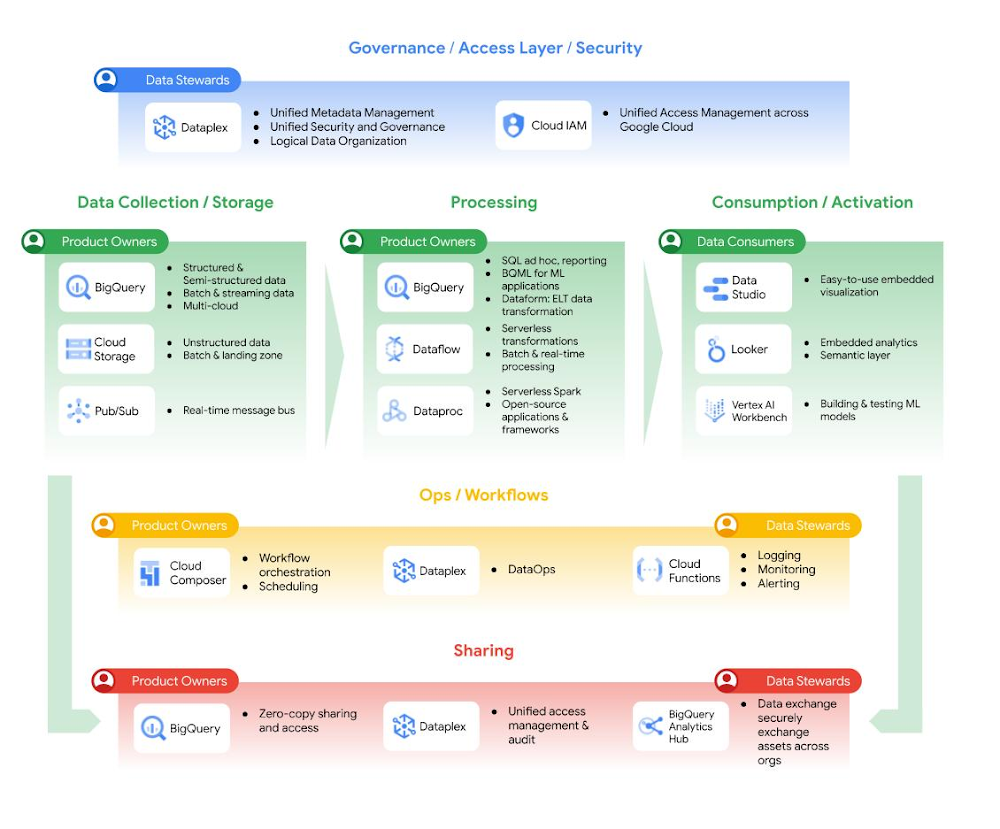
Data drives innovation, but business needs are changing more rapidly than processes can accommodate, resulting in a widening gap between data and value. Your organization has many data sources that  you use to make decisions, but how easy is it to access these new data sources? Do you trust the reports generated from these data sources? Who are the owners and producers of these data sources? Is there a centralized team who should be responsible for producing and serving every single data source in your organization? Or is it time to decentralize some data ownership and speed up data production? In other words, is it time to let the teams with the  most context around data own it?From a technology perspective, data platforms support these ambitions already. In the past, you were concerned about whether you had enough capacity or the amount of engineering time needed to incorporate new data sources into your analytics stack. The data processing, network, and storage barriers are now coming down, and you can ingest, store, process, and access much more data residing in different source systems without costing a fortune. But here’s the thing. Even though data platforms have evolved, the organizational model for  generating analytics data and processes users follow to access and use it haven’t. Many organizations rely on a central team to create a repository of all the data assets in the organization, and then make them useful and accessible to the users of that data. This slows  companies down from getting the value they want from their data. When we talk to our customers we see one of two problems:  The first problem is a data bottleneck. There’s only one team, sometimes just one person or system that can access the data, so every request for data  must go through them. The central team is also asked to interpret the use cases for that data, and make judgments on the data assets required without having much domain knowledge about the data. This situation causes a lot of frustration for data analysts, data scientists and ultimately any business user who requires data for decision making. Over time, people give up on waiting and make decisions without data.Data chaos is the other thing that happens, because people get fed up with the bottleneck. People copy the most relevant data they can find, not knowing if it is the best option available to them. This data duplication (and subsequent uses)  can happen enough times that users lose track of the source of truth of the data, its freshness, and what the data means. Aside from being a data governance nightmare, this creates unnecessary work and a waste of system resources, leading to increased complexity and cost. It slows everyone down and erodes trust in data. To address the above challenges, organizations may wish to give business domains autonomy in generating, analyzing, and exposing data as data products, as long as these data products have a justifiable use case. The same business domains would own their data products throughout their entire lifecycle.In this model, the need for a central data team remains, although without ownership of the data itself. The goal of the central team is to support users in generating value from data by enabling them to autonomously build, share, and use data products. The central team does this via a set of standards and best practices for domains to build, deploy, and maintain data products that are secure and interoperable, governance policies to build trust in these products (and the tooling to assist domains to adhere to them), and a common platform to enable self-serve discovery and use of data products  by domains. Their job is made easier by an already self-service and serverless data platform. In 2019, Zhamak Dehghani introduced to the world the notion of Data Mesh, applying a DevOps mentality that was developed through infrastructure modernization to data. Coincidentally, this is how Google has been operating internally over the last decade. A decentralized data platform is achieved by using BigQuery behind the scenes. As a result, instead of moving data from domains into a centrally owned data lake or platform, domains can host and serve their domain datasets in an easily consumable way. The business area generating data becomes responsible for owning and serving their datasets for access by teams with a business need for that data. We have been working with numerous customers over the last two years who are eager to try Data Mesh out for themselves. We have written about how to build a data mesh on Google Cloud in detail: you can read the full whitepaper here, and a follow up guide to implementation here. In a nutshell, Data Mesh is an architectural paradigm that decentralizes data ownership into the teams that have the greatest business context about that data. These teams take on the responsibility of keeping data fresh, trustworthy, and discoverable by data consumers elsewhere in the company. Data effectively becomes a product, owned and managed within a domain by the teams who know it best. For this approach to work, governance also needs to be federated across the domains, so that management of data and access can be customized, within boundaries, by the data owners as well.The idea of a Data Mesh is alluring; it combines business needs with technology in a way we don’t typically see. It promises a solution to help break down organizational barriers in extracting value from data. To do this, companies must adopt four principles of Discoverability, Accessibility, Ownership, and (Federated) Governance, which require a coordinated effort across technical and business unit leadership. In practice, each group that owns a data domain across a decentralized organization may need to employ a hybrid group of data workers  to take on the increased data curation, data management, data engineering, and data governance tasks required to own and maintain data products for that domain. From day-to-day operations of the team to employee management and performance evaluations, this significantly impacts an organization, so it is not a small change to make and needs buy-in from cross-functional stakeholders and leadership across the company. It is essential that the offices of the Chief Information Security Officer (CISO), Chief Data Officer (CDO), and Chief Information Officer (CIO) are engaged as the key stakeholders as early as possible to enable business units to manage data products in addition to their business-as-usual activities. There must also be business unit leaders willing to have their teams assume this new responsibility. If key stakeholders are less involved in your organizational planning, this may result in inadequate resources being allocated and the overall project failing. Fundamentally, Data Mesh is not just a technical architecture but rather an operating model shift towards distributed ownership of data and autonomous use of technology to enable business units to optimize locally for agility. Thinh Ha’s article on organizational features that are anti-candidates for Data Mesh is a must-read if you are considering this approach at your company. At Google Cloud, we have built managed services to help companies like Delivery Hero modernize their analytics stack and implement Data Mesh practices. Data Mesh promises domain-oriented, decentralized data ownership and architecture where each domain is responsible for creating and consuming data – which in turn allows faster scaling of the number of data sources and use cases. You can achieve this by having federated computation and access layers while keeping your data in BigQuery and BigLake. Then you can join data from different domains, even raw data if needed, with no duplication or data movement. Analytics Hub is then used for discovery together with Dataplex. In addition, Dataplex provides the ability to handle centralized administration and governance. This is further complemented by having Looker, which fits in perfectly as it allows scientists, analysts, and even business users to access their data with a single semantic model. This universal semantic layer abstracts data consumption for business users and harmonizes data access permissions.Figure 1: Data Mesh in Google’s Data CloudIn addition, BigQuery StorageApi allows data access from 20+ APIs at high performance without impacting other workloads, due to its true separation of storage and computation. In this way, BigQuery acts as a lakehouse, bringing together data warehouse and data lake functionality, and allowing different types and higher volumes of data. You can read more about lake houses in our recent open data lakehouse article. Through powerful federated queries, BigQuery can also process external data sources in object storage (Cloud Storage) for Parquet and ORC open source file formats, transactional databases (Bigtable, Cloud SQL), or spreadsheets in Drive. All this can be done without moving the data. These components come together in the example architecture as outlined in Figure 2.Figure 2: Data Mesh example architectureIf you think a Data Mesh may be the right approach for your business, we encourage you to read our whitepaper on how to build a Data Mesh on Google Cloud. But before you consider building a Data Mesh, think through your company’s data philosophy and whether you’re organizationally ready for such a change. We recommend you read “What type of data processing organization are you?” to get started on this journey. The answer to this question is critical as Data Mesh may not be suitable for your organization as a whole if you have existing processes that cannot be federated immediately. If you are looking to modernize your analytics stack as a whole, check out our white paper on building a unified analytics platform. For more interesting insights on Data Mesh, you can read the full whitepaper here. We also have a guide to implementing a data mesh on Google Cloud here, that details the architecture possible on Google Cloud, the key functions and roles required to deliver  on that architecture, and the considerations that should be taken into account in each major task in the data mesh.AcknowledgementsIt was an honor and privilege to work on this with Diptiman Raichaudhuri, Sergei Lilichenko, Shirley Cohen, Thinh Ha,  Yu-lm Loh, Johan Pcikard, Yu-lm Loh and  Maxime Lanciaux for support, work they have done and discussions.
Quelle: Google Cloud Platform

Powering up Firestore to COUNT() cost-efficiently

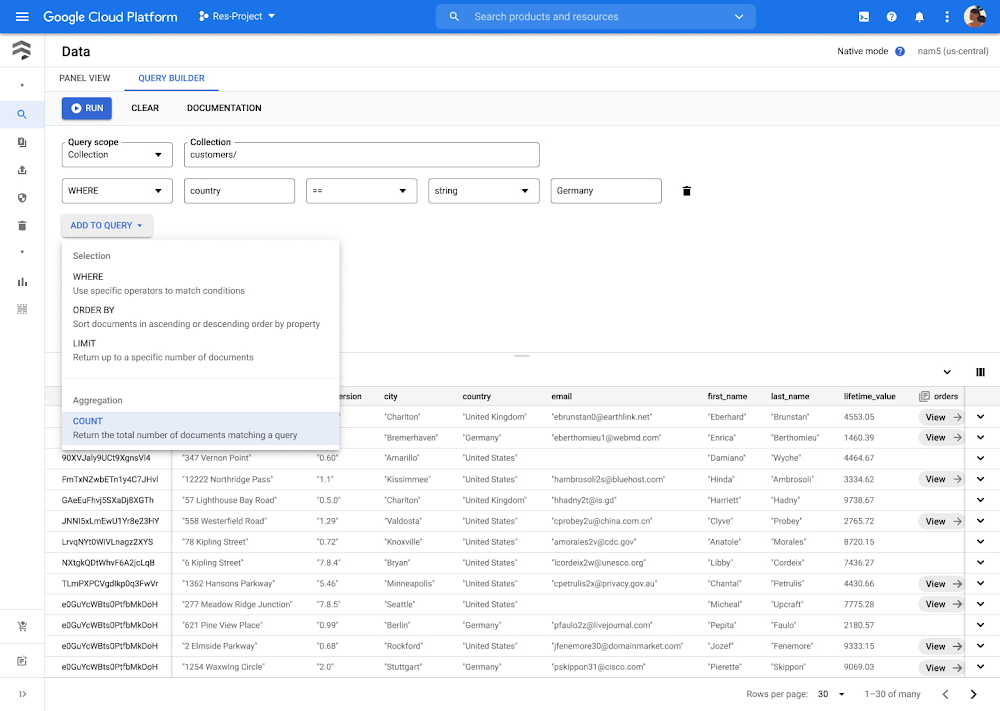
Frequently, your application may need to count the number of matches for a given query. For example, if you’re developing a social application, you may need to count the number of friends an individual has. With today’s Preview launch of count(), you can easily and cost-efficiently perform a count() directly in Firestore. It’s accessible via all our server, client SDKs, Google Cloud and Firebase console.Use CasesSupport for count() now enables you to utilize Firestore for building applications which need aggregation support eg. a dashboard displaying the number of active players in a gaming app or counting the number of friends on a social media app etc., without reading all the docs.  Count() can be leveraged to simply count the number of items in a collection or to count the results based on certain conditions in any application.For example, Let’s say you have a collection called “employees”. To get a count() of total number of employees, you run the below query:code_block[StructValue([(u’code’, u”async function getNumEmployees(db: Firestore): Promise<number> {rn const collection_ = collection(db, ‘employees’);rn const snapshot = await getCountFromServer(collection_);rn return snapshot.data().count;rn}”), (u’language’, u”), (u’caption’, <wagtail.wagtailcore.rich_text.RichText object at 0x3e778e148790>)])]Now, let’s say you want to get a total count of “developers” among your employees. To get a count of total developers among your employees,you run the below query:code_block[StructValue([(u’code’, u”async function getNumDevelopers(db: Firestore): Promise<number> {rn const collection_ = collection(db, ‘employees’);rn const query_ = query(collection_, where(‘role’, ‘==’, ‘dev’));rn const snapshot = await getCountFromServer(query_);rn return snapshot.data().count;rn}”), (u’language’, u”), (u’caption’, <wagtail.wagtailcore.rich_text.RichText object at 0x3e774ba88fd0>)])]How does COUNT work?Firestore computes count() based on index entry matches. Before we discuss the methodology used by the query planner, it’s important to familiarize yourself with two new terms:Index entries scanned: Number of index entries scanned to execute a query. Index entries matched: Number of index entries that match the query. When a query with a count() function is executed, we scan relevant index entries, and the index entries that match the query are then counted on the server. Since the matching documents never have to be retrieved, the performance of the query will primarily depend on the size of the number of index entries scanned. Pricing for COUNT()Firestore’s count() isn’t just easy to use, it is also cost-efficient! You’ll be charged for the number of index entries matched during the computation. Index entry matches will map to the existing Doc Reads SKU, where up to 1000 index entry matches will be equal to 1 doc read, 1,001 to 2,000 index entry matches will be equal to 2 document reads, etc.For example, a query utilizing a count aggregation function resulting in 1500 index entry matches, will be charged 2 document reads.Count () is also available for free-tier users. Since it is charged using document reads, it adheres to the existing free-tier quotas. COUNT() behavior For web and mobile users, during the Preview, count() will be an online only experience. You can use the count() function on any query when you are online. Support for real time listeners, and offline access to the count() function is not available at the moment. The count() function can be used with all our existing query patterns, including transactions. Next Steps Please refer to the documentation for more information.With the ease and cost-efficiency of this feature, we hope you’ll agree this is the one that really counts. Get counting now.
Quelle: Google Cloud Platform

Run interactive pipelines at scale using Beam Notebooks

To all Apache Beam and Dataflow users:If you’ve experimented with Beam, prototyped a pipeline, or verified assumptions about a dataset, you might have used Beam Notebooks or other interactive alternatives such as Google Colab or Jupyter Notebooks.You might also have noticed a gap between running a small prototype pipeline in a notebook and a production pipeline on Dataflow: What if you want to interactively process and inspect aggregations of bigger production datasets from within the notebook, but at scale? You cannot rely on the single machine that’s running your notebook to execute the pipeline because it simply lacks the capacity to do so.Allow me to introduce Interactive FlinkRunner on notebook-managed clusters. It lets you execute pipelines at scale and inspect results interactively with FlinkRunner on notebook-managed clusters. Under the hood, it uses Dataproc with its Flink and Docker components to provision long-lasting clusters.This post will introduce you to Interactive FlinkRunner using three examples:A starter word count example with a small notebook-managed cluster.An example using a much bigger cluster to process tens of millions of flight records to see how many flights are delayed for each airline.An example reusing the bigger cluster to run ML inference against 50,000 images with a pre-trained model – all from within a notebook.If you want to control the cost of these examples, you are free to use pipeline options to reduce the size of the data and the cluster. The starter example costs ~$1/hr and the other two cost ~$20/hr (estimated from Dataproc pricing and VM instance pricing). The actual cost may vary. Optionally, you can reduce the cost by configuring source data and pipeline options. PrerequisitesPrerequisitesOnce you have Beam Notebooks instantiated, create an empty notebook (ipynb) file and open it with a notebook kernel selected. Always use a notebook/IPython kernel with the newer Beam version to take advantage of bug fixes, optimizations and new features. For Dataflow-hosted Beam Notebooks, use notebook kernels with Beam versions >= 2.40.0.To get started, you have to check whether your project has the necessary services activated and permissions granted. You can find relevant information about the current user by executing the following in the notebook.code_block[StructValue([(u’code’, u’# Describe the user currently authenticated.rn!gcloud iam service-accounts describe $(gcloud config get-value account)rnrn# List the IAM roles granted to the user. If it’s already a Project Editor,rn# it should have all required IAM permissions. Otherwise, look for a projectrn# admin for missing grants if you encounter any permission issues in the examples.rn!gcloud projects get-iam-policy $(gcloud config get-value project) \rn –flatten=”bindings[].members” \rn –format=’table(bindings.role)’ \rn –filter=”bindings.members:$(gcloud config get-value account)”‘), (u’language’, u”), (u’caption’, <wagtail.wagtailcore.rich_text.RichText object at 0x3e7c8d3e6dd0>)])]Interactive Flink on notebook-managed clusters uses Dataproc under the hood.code_block[StructValue([(u’code’, u’!gcloud services enable dataproc.googleapis.com’), (u’language’, u”), (u’caption’, <wagtail.wagtailcore.rich_text.RichText object at 0x3e7c8d3e6b10>)])]A starter example – Word CountYou’ve probably already seen the word count example multiple times. You know how to process and inspect the counted words with an InteractiveRunner or a DirectRunner on a single machine.And you are able to run the pipeline on Dataflow as a one-shot job from within the exact same notebook without copying/pasting, moving across workspaces, or setting up the Cloud SDK.To run it interactively with Flink on a notebook-managed cluster, you only need to change the runner and optionally modify some pipeline options.The notebook-managed Flink cluster is configurable through pipeline options. You need these imports for this and the other examples.code_block[StructValue([(u’code’, u’from apache_beam.options.pipeline_options import FlinkRunnerOptionsrnfrom apache_beam.options.pipeline_options import GoogleCloudOptionsrnfrom apache_beam.options.pipeline_options import PipelineOptionsrnfrom apache_beam.options.pipeline_options import PortableOptionsrnfrom apache_beam.options.pipeline_options import SetupOptionsrnfrom apache_beam.options.pipeline_options import WorkerOptionsrnfrom apache_beam.runners.interactive.interactive_runner import InteractiveRunnerrnfrom apache_beam.runners.portability.flink_runner import FlinkRunner’), (u’language’, u”), (u’caption’, <wagtail.wagtailcore.rich_text.RichText object at 0x3e7c8d3e6590>)])]You can then set up the configurations for development and execution.code_block[StructValue([(u’code’, u”import loggingrnlogging.getLogger().setLevel(logging.ERROR)rnrnimport google.authrnproject = google.auth.default()[1]rnrn# IMPORTANT! Adjust the following to choose a Cloud Storage location.rn# Used to cache source recordings and computed PCollections.rnib.options.cache_root = ‘gs://YOUR-BUCKET/’rnrn# Define an InteractiveRunner that uses the FlinkRunner under the hood.rninteractive_flink_runner = InteractiveRunner(underlying_runner=FlinkRunner())rnrn# Set up the Apache Beam pipeline options.rnoptions = PipelineOptions()rnoptions.view_as(GoogleCloudOptions).project = project”), (u’language’, u”), (u’caption’, <wagtail.wagtailcore.rich_text.RichText object at 0x3e7c8d21a9d0>)])]Above are the minimum configurations needed; you’ll further customize them in later examples.You can find the source code of the word count example here. Modify it with the interactive_flink_runner to build the pipeline in the notebook. The example uses gs://apache-beam-samples/shakespeare/kinglear.txt as the input file.Inspecting the PCollection counts would implicitly start a Flink cluster, execute the pipeline, and render the result in the notebook.Example 2 – Find out how many flights are delayedThis example reads more than 17 million records from a public BigQuery dataset, bigquery-samples.airline_ontime_data.flights, and counts how many flights have been delayed since 2010 for all the airlines.On a normal InteractiveRunner running directly on a single notebook instance, it could take more than an hour for reading and processing due to the number of records (though the size of data is relatively small, ~ 1GB), and the pipeline can OOM or run out of disk space when the data is even bigger. With interactive Flink on notebook-managed clusters, you work with a higher capacity and performance (~ 4 mins for the example) while still being able to construct the pipeline step by step and inspect the results one by one within a notebook.You need to have BigQuery service activated.code_block[StructValue([(u’code’, u’!gcloud services enable bigquery.googleapis.com’), (u’language’, u”), (u’caption’, <wagtail.wagtailcore.rich_text.RichText object at 0x3e7c7b9a44d0>)])]Configure a much bigger cluster with the options below. You may add a “LIMIT 1000” or similar constraints in the BigQuery read query to limit the records read. Based on the size of data read from BigQuery, you may reduce the values of the options.code_block[StructValue([(u’code’, u”# Use cloudpickle to alleviate the burden of staging things in the main module.rnoptions.view_as(SetupOptions).pickle_library = ‘cloudpickle’rn# As a rule of thumb, the Flink cluster has about vCPU * #TMs = 8 * 40 = 320 slots.rnoptions.view_as(WorkerOptions).machine_type = ‘n1-highmem-8’rnoptions.view_as(WorkerOptions).num_workers = 40″), (u’language’, u”), (u’caption’, <wagtail.wagtailcore.rich_text.RichText object at 0x3e7c7b9a4b10>)])]Whenever you inspect the result of a PCollection through ib.show() or ib.collect() in a notebook, Beam implicitly runs a fragment of the pipeline to compute the data. You can adjust the parallelism of the execution interactively.code_block[StructValue([(u’code’, u’# The parallelism is applied to each step, so if your pipeline has 10 steps, yourn# end up having 150 * 10 tasks scheduled that can theoretically be executed in parallel byrn# the 320 (upper bound) slots/workers/threads.rnoptions.view_as(FlinkRunnerOptions).parallelism = 150′), (u’language’, u”), (u’caption’, <wagtail.wagtailcore.rich_text.RichText object at 0x3e7c7bf0fa50>)])]With the above configurations, when you inspect data in the notebook, you are instructing Beam to implicitly start or reuse a Flink cluster on Google Cloud (Dataproc under the hood) with 40 VMs and run pipelines with parallelism set to 150.code_block[StructValue([(u’code’, u’options.view_as(GoogleCloudOptions).temp_location = ib.options.cache_rootrnbq_p = beam.Pipeline(runner=interactive_flink_runner, options=options)rnrndelays_by_airline = (rn bq_prn | ‘Read Dataset from BQ’ >> beam.io.ReadFromBigQuery(rn project=project, use_standard_sql=True,rn # Read 17,692,149 records, ~1GB worth of datarn query=(‘SELECT airline, arrival_delay ‘rn ‘FROM `bigquery-samples.airline_ontime_data.flights` ‘rn ‘WHERE date >= “2010-01-01″‘))rn | ‘Rebalance Data to TM Slots’ >> beam.Reshuffle(num_buckets=1000)rn | ‘Extract Delay Info’ >> beam.Map(rn lambda e: (e[‘airline’], e[‘arrival_delay’] > 0))rn | ‘Filter Delayed’ >> beam.Filter(lambda e: e[1])rn | ‘Count Delayed Flights Per Airline’ >> beam.combiners.Count.PerKey())’), (u’language’, u”), (u’caption’, <wagtail.wagtailcore.rich_text.RichText object at 0x3e7c7bf0fe10>)])]You can include visualize_data=True when inspecting data through ib.show(). Binning the visualized data by their count, you can see that WN airline has the most delayed flights recorded in the dataset.Example 3 – Run ML inference at scale interactivelyThe RunInference example classifies 50,000 image files (~280GB) from within the notebook.The workload normally takes half a day for a single notebook instance or worker. With interactive Flink on notebook-managed clusters, it shows the result in ~1 minute. Looking at the Flink job dashboard, the actual inference only took a dozen seconds. The rest of the running time is overhead from staging the job, scheduling the tasks, writing the aggregated result to ib.options.cache_root, transferring the result back to the notebook, and rendering it in the browser.SetupFor the RunInference example, you need to build a container image. You can find more information about building a container image from a notebook in this guide.The extra Python dependencies needed for this example are:code_block[StructValue([(u’code’, u’%pip install torchrn%pip install torchvisionrn%pip install pillowrn%pip install transformers’), (u’language’, u”), (u’caption’, <wagtail.wagtailcore.rich_text.RichText object at 0x3e7c8d3e9fd0>)])]The example uses the validation image set from ImageNet and the PyTorch pre-trained ImageNetV2 model. You can download similar dependencies or use your own image dataset and model. Make sure you copy the pre-trained model to the container and use its file path in the Beam pipeline. You can find many image datasets from places such as ImageNet or COCO (Common Objects in Context) and pre-trained models such as MobileNetV2 in the ImageNet Models package.Configure the pipeline options to use the custom container you build.code_block[StructValue([(u’code’, u”options.view_as(PortableOptions).environment_config = f’gcr.io/{project}/flink'”), (u’language’, u”), (u’caption’, <wagtail.wagtailcore.rich_text.RichText object at 0x3e7c8d3e9ad0>)])]Build the pipelineTo run inference with a Beam pipeline, you need the following imports:code_block[StructValue([(u’code’, u’import iornfrom typing import Iterablernfrom typing import Optionalrnfrom typing import Tuplernrnimport torchrnfrom PIL import Imagernfrom torchvision import modelsrnfrom torchvision import transformsrnfrom torchvision.models.mobilenetv2 import MobileNetV2rnrnimport apache_beam as beamrnfrom apache_beam.io.filesystems import FileSystemsrnfrom apache_beam.ml.inference.base import KeyedModelHandlerrnfrom apache_beam.ml.inference.base import PredictionResultrnfrom apache_beam.ml.inference.base import RunInferencernfrom apache_beam.ml.inference.pytorch_inference import PytorchModelHandlerTensor’), (u’language’, u”), (u’caption’, <wagtail.wagtailcore.rich_text.RichText object at 0x3e7c8d3e9f50>)])]Then you can define processing logic for each step of the pipeline. You can use a mixture of DoFns and normal functions that yield or return and later incorporate them into the pipeline with different transforms.code_block[StructValue([(u’code’, u”def filter_empty_text(text: str) -> Iterable[str]:rn if len(text.strip()) > 0:rn yield textrnrndef preprocess_image(data: Image.Image) -> torch.Tensor:rn image_size = (224, 224)rn # Pre-trained PyTorch models expect input images normalized with thern # below values (see: https://pytorch.org/vision/stable/models.html)rn normalize = transforms.Normalize(rn mean=[0.485, 0.456, 0.406], std=[0.229, 0.224, 0.225])rn transform = transforms.Compose([rn transforms.Resize(image_size),rn transforms.ToTensor(),rn normalize,rn ])rn return transform(data)rnrndef read_image(image_file_name: str) -> Tuple[str, torch.Tensor]:rn with FileSystems().open(image_file_name, ‘r’) as file:rn data = Image.open(io.BytesIO(file.read())).convert(‘RGB’)rn return image_file_name, preprocess_image(data)rnrnclass PostProcessor(beam.DoFn):rn def process(self, element: Tuple[str, PredictionResult]) -> Iterable[str]:rn filename, prediction_result = elementrn prediction = torch.argmax(prediction_result.inference, dim=0)rn yield str(prediction.item())”), (u’language’, u”), (u’caption’, <wagtail.wagtailcore.rich_text.RichText object at 0x3e7c8d3e9d10>)])]Now define a few variables.code_block[StructValue([(u’code’, u”# Replace this with a file containing paths to your image files.rnimage_file_names = ‘gs://runinference/it_mobilenetv2_imagenet_validation_inputs.txt’rnmodel_state_dict_path = ‘/tmp/mobilenet_v2.pt’rnmodel_class = MobileNetV2rnmodel_params = {‘num_classes': 1000}rnrn# In this example we pass keyed inputs to the RunInference transform.rn# Therefore, we use KeyedModelHandler wrapper over PytorchModelHandler.rnmodel_handler = KeyedModelHandler(rn PytorchModelHandlerTensor(rn state_dict_path=model_state_dict_path,rn model_class=model_class,rn model_params=model_params))”), (u’language’, u”), (u’caption’, <wagtail.wagtailcore.rich_text.RichText object at 0x3e7c8d6a26d0>)])]And build the pipeline with the above building blocks.code_block[StructValue([(u’code’, u”pipeline = beam.Pipeline(interactive_flink_runner, options=options)rnrncounts = (rn pipelinern | ‘Read Image File Names’ >> beam.io.ReadFromText(rn image_file_names)rn | ‘Filter Empty File Names’ >> beam.ParDo(filter_empty_text)rn | ‘Shuffle Files to Read’ >> beam.Reshuffle(num_buckets=900)rn | ‘Read Image Data’ >> beam.Map(read_image)rn | ‘PyTorch Run Inference’ >> RunInference(model_handler)rn | ‘Process Output’ >> beam.ParDo(PostProcessor())rn | ‘Count Per Classification’ >> beam.combiners.Count.PerElement())rnrn# Further increase the parallelism from the starter example.rnoptions.view_as(FlinkRunnerOptions).parallelism = 300″), (u’language’, u”), (u’caption’, <wagtail.wagtailcore.rich_text.RichText object at 0x3e7c8c893610>)])]The pipeline reads a text file with 50,000 image file names in it. The Reshuffle is necessary to rebalance the image file names to all the workers before reading the image files. Without it, all 50,000 files will be read from a single task/thread/worker no matter how high the parallelism is.Once read, each image will be classified into 1 of 1000 classes (e.g., a cat, a dog, a flower). The final aggregation counts how many images there are for each class.In notebooks, Beam tries to cache the computed data of each PCollection that is assigned to a variable defined in the main module or watched by ib.watch({‘pcoll_name’: pcoll}). Here, to speed everything up, you only assign the final aggregation to a PCollection variable named counts as it’s the only data worth inspection.To inspect the data, you can use either ib.show or ib.collect. If it’s the first time you inspect the data, a Flink cluster is implicitly started. For later inspections, computed PCollections do not incur executions. For inspections of data by newly appended transforms, the same cluster will be reused (unless instructed otherwise).You can also inspect the cluster by running ib.clusters.describe(pipeline).And you can follow the link in the output to the Flink dashboard where you can review finished jobs or future running jobs.As you can see, the process took 1m45s to run inference for 50,000 images (~280GB).You can further enrich the data if you know the mappings between classifications and their human-readable labels.code_block[StructValue([(u’code’, u”idx_to_label = pipeline | ‘A sample class idx to label’ >> beam.Create(list({rn ‘242’: ‘boxer’,rn ‘243’: ‘bull mastiff’,rn ‘244’: ‘Tibetan mastiff’,rn ‘245’: ‘French bulldog’,rn ‘246’: ‘Great Dane’,rn ‘247’: ‘Saint Bernard, St Bernard’,rn ‘248’: ‘Eskimo dog, husky’,rn ‘249’: ‘malamute, malemute, Alaskan malamute’,rn ‘250’: ‘Siberian husky’,rn ‘251’: ‘dalmatian, coach dog, carriage dog’,rn ‘252’: ‘affenpinscher, monkey pinscher, monkey dog’,rn ‘253’: ‘basenji’,rn ‘254’: ‘pug, pug-dog’,rn}.items()))rnrndef cross_join(idx_count, idx_labels):rn idx, count = idx_countrn if idx in idx_labels:rn return {‘class': idx, ‘label': idx_labels[idx], ‘count': count}rnrnlabel_counts = (rn countsrn | ‘Enrich with human-readable labels’ >> beam.Map(rn cross_join, idx_labels=beam.pvalue.AsDict(idx_to_label))rn | ‘Keep only enriched data’ >> beam.Filter(lambda x: x is not None))”), (u’language’, u”), (u’caption’, <wagtail.wagtailcore.rich_text.RichText object at 0x3e7c7b45d4d0>)])]When inspecting the label_counts, the computed counts will be reused for the newly added transforms. After an aggregation, the output data size can be tiny compared with the input data. High parallelism does not help with processing small data and could introduce unnecessary overhead. You can interactively tune down the parallelism to inspect the result of processing only a handful of elements with the newly added transform.Clean UpExecute the code below to clean up clusters created by the notebook and avoid unintended charges.code_block[StructValue([(u’code’, u’ib.clusters.cleanup(force=True)’), (u’language’, u”), (u’caption’, <wagtail.wagtailcore.rich_text.RichText object at 0x3e7c8c893110>)])]Optionally, you can go to the Dataproc UI to manually manage your clusters.Open Source SupportApache Beam is open source software. The interactive features work with all IPython kernel-backed notebook runtimes. This also means the interactive FlinkRunner feature can be adapted to your own notebook and cluster setups.For example, you can use Google Colab (a free alternative to Dataflow-hosted Beam Notebooks) connected with a local runtime (kernel) on your own workstation and then interactively submit jobs to a Flink cluster that you host and manage.Set up Google Colab with local runtimeSet up a Flink cluster locallyTo use your own Flink cluster, simply specify the necessary options:code_block[StructValue([(u’code’, u”flink_options = options.view_as(FlinkRunnerOptions)rnflink_options.flink_master = ‘localhost:8081′ # Or any resolvable URL of your clusterrnflink_options.flink_version = ‘1.12’ # Or the version of Flink you use”), (u’language’, u”), (u’caption’, <wagtail.wagtailcore.rich_text.RichText object at 0x3e7c8c893390>)])]If you use Beam built from source code (a dev version), you can configure a compatible container image.code_block[StructValue([(u’code’, u”# Or any custom container you build to run the Python code you define.rnoptions.view_as(PortableOptions).environment_config = ‘apache/beam_python3.8_sdk:2.41.0′”), (u’language’, u”), (u’caption’, <wagtail.wagtailcore.rich_text.RichText object at 0x3e7c8c893a10>)])]Now you can run Beam pipelines interactively at scale on your own setup.CompatibilitiesInteractive Flink features are not patched back to older versions of (Interactive) Beam. Here is a compatibility table.Beam VersionsDataflow-hosted Beam NotebooksOther notebook and cluster setups<2.40.0Not supportedNot supported>=2.40.0,<2.43.0SupportedParallelism fixed to 1>=2.43.0SupportedSupportedThere is also a cluster manager UI widget in the JupyterLab extension apache-beam-jupyterlab-sidepanel. Dataflow-hosted Beam Notebooks have it pre-installed. If you use your own JupyterLab setup, you can install it from either NPM or source code. It’s not supported in other notebook runtime environments such as Colab or classic Jupyter Notebooks.Next StepsGo to the Vertex AI workbench and get started using Dataflow-hosted Beam Notebooks! You can create, share, and collaborate on your notebooks with ease. And you have the flexibility to control who can access your notebook and what resources to use any time you want to make a change.For the interactive Flink feature, check the public documentation for tips, caveats and FAQs when you run into issues.Your feedback, suggestions, and open source contributions are welcomed.
Quelle: Google Cloud Platform

Accelerating app development lifecycle with managed container platforms, Firebase and CI/CD

We understand that for startups in the build phase, the highest priority task is to continuously ship features based on your users’ needs. There are three main focus areas when building applications: Development: When it comes to development, focus on tasks that make your app unique by offloading backend setup and processing to someone else. For example, instead of setting up your own API servers and managing backend services, Firebase offers a managed experience. Hosting: Once you’ve built your app, the next step is to host it. Containers have become the de facto way of packaging applications today. You can easily run your containers in managed environments, such as Google Kubernetes Engine or Cloud Run. Improvements: A one-time deployment is not enough. Growth is about taking in feedback from the market and improving our applications based on the same. We recommend incorporating CI/CD and automating improvements in your software delivery pipelines.In this blog post, you can learn more about the tools that help you with the above three focus areas.Develop apps faster by shifting focus to business logic with FirebaseIn a traditional app architecture, you would need to set up and manage an API server to direct requests to your backend. With Firebase, you can easily add features in your mobile or web app with a few lines of code, without worrying about the infrastructure. The products on Firebase help you Build, Release & Monitor, and Engage. Doing so will allow your teams to:Add features like authentication and databases with only a few lines of codeUnderstand your users and apps better using Google Analytics for Firebase, Crashlytics, and Performance MonitoringSend messages to engage your users with Firebase Cloud Messaging and In-App MessagingWith simple-to-use cross-platform SDKs, Firebase can help you develop applications quicker and reduce your time to market, improve app quality in less time with less effort,  and optimize your app experience. Find out how you can put together these building blocks in our video on Working with Firebase.Host apps easily with managed container platforms on Google CloudFor startups who are looking to utilize resources better, containerization becomes the next step. With our investment in Google Kubernetes Engine (GKE) and Cloud Run, Google Cloud gives you the freedom to build with containers on a tech stack based on open source tools like Kubernetes, Knative and Istio. This means no vendor lock-in for you.Google Kubernetes EngineWe understand that our customers are looking for autonomous and extensible platforms that are expertly run. GKE gives you a managed environment to run applications, simplified consoles to create/update your clusters with a single click, and lets you deploy applications with minimal operational overhead.Google manages your control plane, and 4-way autoscaling gives you the option to fine tune to get the most optimized utilization for the resources used.These best practices are applied by default with the second mode of operation for GKE – Autopilot. It dynamically adjusts compute resources so you don’t have to worry about unused capacity and you pay only for the pods you use , billed per second for vCPU, memory and disk resource requests. This means that you can reduce operational costs, while still optimizing for production and higher workload availability.Head to Compute with Google Kubernetes Engine to quickly get started with GKE.Cloud RunCloud Run lets you run containers in a fully managed serverless environment and gives you the ability to scale down to ‘zero’ when there are no requests coming in. It is a great fit for stateless applications like web frontends, REST APIs, lightweight data transformation jobs, etc. There are 3 steps to any Cloud Run deployment –Create a build using your source code. Submit the build to store it in a container registry.Deploy the application using a simple command. This process is very similar to the usual steps followed for deployments on other platforms but what makes Cloud Run special is that all of this can be achieved in one single command – `gcloud run deploy –source . `Watch this in action in the video to Get started on Cloud RunImprove and iterate more often with CI/CD solutionsSoftware systems are living things and need to adapt to reflect your changing priorities. Continuous integration/Continuous deployments (CI/CD)  as the term suggests, means that you are adding code updates and deploying them continuously. Our developer’s time should be spent writing code, so CI/CD steps should be triggered and run in the background when code is pushed. Let’s look at the components of a CI/CD pipeline and how Google Cloud tools support them – Cloud Code integrates with your IDE and lets you easily write, run and debug your applications.Cloud Build lets you run your build steps to package and deploy your applications on any platform on Google Cloud. You can set up triggers to start builds automatically. Artifact Registry is where we store the intermediate artifacts created during a build. Container images stored here can be used to create newer deployments to other platforms as well.Cloud Deploy automates the delivery of your updated application to target environments specified by you. Both Cloud Run and GKE come integrated with Cloud Operations Suite so you can monitor your application for any errors or performance issues. We know that you want to deliver bug-free features to your customers. So when you are shipping code, consider how a CI/CD pipeline can help you catch performance issues early and improve developer workflows. To set up your CI/CD pipeline on Google Cloud, refer to CI/CD on Google Cloud.Stay in touch for moreThe Google Cloud Technical Guides for Startups series has many more detailed videos and resources to support you on all steps of your growth journey. Check out our full playlist on the Google Cloud Tech channel and handbooks and sample architectures on our website. Don’t forget to subscribe to stay up to date. If you’re ready to get started with Google Cloud, apply now for the Google for Startups Cloud Program.See you in the cloud.Related ArticleBootstrap your startup with the Google Cloud Technical Guides for Startups : A Look into the Start SeriesAnnouncing the summary of the first phase of the Google Cloud Technical Guides for Startups, a video series for technical enablement aime…Read Article
Quelle: Google Cloud Platform

Cloud Logging pricing for Cloud Admins: How to approach it & save cost

Flexera’sState of the Cloud Report 2022 pointed out that significant cloud spending is wasted, a major issue that is getting more critical as cloud costs continue to rise. In the current macroeconomic conditions, companies focus on identifying ways to reduce spending. To  effectively do that, we need to understand the pricing model. We can then work towards the challenges of cost monitoring, optimization, and forecasting. One area that often gets overlooked in budgeting is observability—logging, monitoring, tracing. This can represent a significant cost, especially if it’s not optimized. Let’s explore how to understand and optimize our most voluminous data source—logs—within Google Cloud.Cloud Logging is a fully managed real-time log solution that allows you to ingest, route, store, search and analyze your logs to easily troubleshoot incidents using your log data. It can collect data from on-prem, Google Cloud and other clouds with open source agents that support over 150+ services. Unlike traditional licensing models or self hosted logging solutions, Cloud Logging pricing model is simple and based on actual usage. Let’s explore the various components of Cloud Logging and address a few commonly asked questions about pricing. Cloud Logging – Components & PurposeTo understand pricing better and be able to predict future costs, we need to understand the high-level components of Cloud Logging and where billing occurs in our system. There are three important components within Cloud Logging: Cloud Logging API, Cloud Logging Router (Log Router) and log buckets (Log Storage).The below table outlines the high-level components, purpose and pricing information for Cloud Logging. As indicated above, today billing in Cloud Logging occurs only for a log that is routed and ingested into a log bucket. “Ingestion” in Cloud Logging is the process of saving log data into a log bucket, not simply processing it in the Log Router. There are three options for log buckets – RequiredDefault User-defined or Custom. Only Default and User-defined buckets are billed.Today, ourlogging pricing is based on the volume of logs ingested in a chargeable log bucket—default or user-defined. All charges in Cloud Logging occur at the log bucket and all log types incur the same cost.  Logs dropped using sink filters or exclusion filters are not charged by Cloud Logging, even if these logs are routed to a destination outside of Cloud Logging. Now, we’ll address frequently asked questions about the Cloud Logging pricing model.  What Cloud Logging charges will I see on my bill?There are two types of charges your logs can potentially incur: An ingestion charge of 0.50 cents/GB which includes default storage of 30 days. Note that the first 50 GB in a project fall under the free tier quota. You get charged based on the volume of logs ingested into the Default and User-defined log buckets.Logs stored beyond 30 days will incur a retention charge of $0.01/GiB/month for non-required buckets. Note that this pricing is not currently enforced. We will begin charging in early 2023.For the latest pricing, check here.How can I reduce my bill?Because Cloud Logging pricing is based on actual usage, you can reduce your pricing by adjusting the ingestion volume or retention period.Reduce the volume of logs ingested per log bucket by identifying and keeping (ingesting) only valuable log data for analysis. If you do not need to keep data beyond the included 30 days, reduce the retention period. Because the first 30 days of retention are included with ingestion, reducing retention to less than 30 days will have no impact on your bill.Does Cloud Logging charge based on the number of queries, searches either from Cloud Logging UI or Client SDK/APIs?No, Cloud Logging does not charge for the number of queries, searches, logs read from disks during queries, or varied log types.  There is a quota limit for querying logs, though, so for integrations with SIEMs or other logging tools, it’s a best practice to set up a log sink via Pub/Sub to push the logs to the downstream system.Can I incur multiple ingestion charges?It is possible to be charged for ingesting the same log entry into Cloud Logging log buckets multiple times.  For example, if your sinks route a log entry to two log buckets, you will pay ingestion costs at two buckets. You may choose to do this to have independent retention of logs or to keep copies of logs in multiple regions for compliance reasons. Are there different costs for hot and cold storage?No, there are no differences between hot and cold storage. The beauty of Cloud Logging is that all logs are accessible throughout their lifespan. Cloud Logging is designed to scale easily and efficiently, which makes logs accessible for troubleshooting, investigating and compliance reasons whether they are seconds or years old. How much does it cost to route logs to other destinations?Today, Cloud Logging does not charge for centrally collecting and routing logs to other destinations like Cloud Storage, BigQuery, Pub/Sub. Usage rates for the destination services, Cloud Storage, BigQuery and Pub/Sub apply.Do Logs have a generation fee?For network telemetry logs such as VPC Logs, Firewall rules logs and Cloud NAT logs, you might incur an additional network generation charge if logs are not stored in Cloud Logging. If you store your logs in Cloud Logging, networking logs generation charges are waived, and only Cloud Logging charges apply. How do I understand my ingestion volume in Cloud Billing?To determine the cost per Project:Go to Cloud Console -> Billing -> Select the Billing Account -> Reports (left pane) On the right side, under filters -> Services -> select “Cloud Logging”Now, Let’s drill down to learn about the cost incurred by each log bucket. Select the Project on the top bar. On the Left pane, go to Logging -> Logs Storage. Now you should be able to see the log volume per bucket.Putting it all togetherNow that we understand pricing for Cloud Logging, we can optimize our usage. Here are four best practices:Recommendation #1: Use a log router to centralize your collection; get a 360 view of your log world and then use an exclusion filter to reduce noisy logs and send only valuable logs to the log bucket. Logs dropped using sink filters or exclusion filters are not charged by Cloud Logging, even if these logs are routed to a destination outside of Cloud Logging. Recommendation #2: Admin activity audit logs are captured by default for all GCP services for no additional cost. Leverage the audit logs from Required Bucket by identifying use-cases for your organizations and configure log-based-alerts on them. Recommendation #3: Logs can be stored cost effectively for up to 10 years and easily accessed via Cloud Logging. Cloud Logging will begin charging customers for long term log retention starting Jan 2023. Between now and Jan 2023, determine the required lifespan of a log and set the appropriate retention period for each log bucket.Recommendation #4: If you are a new customer, estimate your bills. This is a great way to compare costs with your current Cloud Logging solution. If you are an existing customer, create a budgetand set up alerts on your Cloud Logging bills. In addition to analyzing log volumes by buckets, customers may want to analyze the sources, projects, etc. Metrics explorer in Cloud Monitoring can also be used to identify costs. We will discuss this in the next blog.  For more information, join us in ourdiscussion forum. As always, we welcome your feedback. Interested in using Cloud Logging to save costs in your organization, contact us here. We are hosting a webinar to talk about how you can leverage Log Analytics, powered by BigQuery in Cloud Logging for no additional cost. Register here.
Quelle: Google Cloud Platform

From the NFL to Google’s Data Centers: Why KP Philpot still values teamwork over everything

Editor’s note: KP Philpot is the Environmental Health & Safety Manager at Alphabet’s data center campus in Douglas County, Georgia. It’s a long way from both a childhood in Chicago’s South Side, and standing in football stadiums with thousands of fans, but one thing has always held true for him: The importance of personal and team performance. How did you come to Google?At surface level, it was pretty direct. I was working as a site safety engineer for a contractor that was building a Google data center, and I was offered a job at Google. On a deeper level, it was a long and unexpected journey. I grew up in inner city Chicago, and we didn’t hear a lot about data center technicians and environmental engineering. We had blue collar jobs you stuck to, or you played sports. I played football and basketball, and was recruited by colleges for both. I set three NCAA records playing linebacker at Eastern Michigan University, and then I was with the Detroit Lions and played some Arena Football. A few years after that someone I played with in college brought me into the construction industry, and that’s what I did at three other companies before arriving at Google. How different is Google from other places?One thing that’s a breath of fresh air is that when you come to Google, it’s okay to not have all the answers. I think you work more freely and more confidently when there’s no expectation to know everything from day one. If someone you ask doesn’t know the answer, they’re interested in finding it out. There’s a healthy curiosity that you don’t find in most places. One other difference is that Google tends to be team oriented. That part comes naturally to me,  even if it is tech.  I’ve played on teams since I was a kid, and both my parents were athletes. On a team, everyone has a part to play. You have different people, with different skill sets, but everyone belongs. Their contributions are different, but the goal is the same.What is a typical day like?Many people see data centers as rooms full of servers and switches, but I assure you no two days are alike. There are many things to think about in terms of safety, since a data center has a lot of moving parts, especially when working with electricity, we have rigorous protocols to ensure safety for everyone on the site. We also take our environmental impact seriously. A big part of our environmental work is the innovative cooling system we have here in Douglas County — we recycle local sewer water that would otherwise be put in the Chattahoochee River. As for leftover water that does not evaporate, we treat it before returning it to the river. More than that, though, it’s the diversity of people you find in a data center. There may be construction people, who tend to have a lot of hands-on experience and are task focused; there are engineers and managers, who are more focused on how to optimize a process;and of course, there are Googlers. We all become interesting to each other. I get to coordinate and work alongside all of them, which I enjoy a lot.So is team building part of the job?Teamwork is the lens through which I see the world. I was raised by very principled people, who taught me how much your individual actions impact everyone. A family is a team as well. My grandfather would point at his first name, and say, “That’s my name,” then point at my last name, and say, “that’s our name. Every time you walk out the door, that’s who you are.” When I work, I see the world the same way, the need to be a principled person who’s part of a larger team, and constantly working to build respect and trust. Being in the NFL was more expected than being at Google, but these things don’t change.Related ArticleSales specialist, mentor, and woman in Web3: Anella Bokhari is building community and helping others tell their story along the waySales Specialist, Mentor, and Woman in Web3: Anella Bokhari Wears Many Hats But Has the Same “Why” – Helping Others Find & Tell Their Sto…Read Article
Quelle: Google Cloud Platform

The new Google Cloud Region in Israel is now open

Today, we are excited to announce that the new Google Cloud region in Israel is open.  We’ll be celebrating the launch at an event in Tel Aviv on November 9 — register to join us.  Israel is known as the startup nation, and has long been a hub of technology innovation for startups and Google alike. We’re excited to extend that innovation-first approach to other industries, accelerating digital transformation to help create new jobs and digital experiences that better serve users in Israel. According to recent research commissioned by Google, AlphaBeta Economics (part of Access Partnership) estimates that by 2030, the Google Cloud region in Tel Aviv will contribute a cumulative USD 7.6 billion to Israel’s GDP, and support the creation of 21,200 jobs in that year alone1. The Google Cloud region in Tel Aviv (me-west1), joins our network of cloud regions around the world, delivering high-performance, low-latency services to customers of all sizes and across industries. Now that the Israel cloud region is part of the Google Cloud network, it will help local organizations connect with users and customers around the globe, and help fuel innovation and digital transformation across every sector of the economy. Last year, Google Cloud was selected by the Israeli government to provide cloud services to government ministries. This partnership can enable the government, and private companies operating in regulated industries, to simplify the way in which users are served, create a uniform approach to digital security, and support compliance and residency requirements. Over a number of years we’ve grown our local Googler presence in both Tel Aviv and Haifa to support the growing number of customers, and bring a culture of innovation to every sector of the economy.  From technology, retail, and media and entertainment, to financial services and the public sector, leading organizations come to Google Cloud as their trusted innovation partner. “With Google Cloud we are changing the way millions of people read and write, by serving our own Large Language Models on top of the most advanced GPU platform that offers unparalleled performance, availability and elasticity.” – Ori Goshen, CEO, AI21 Labs“PayBox is supervised by the Bank of Israel and is completely hosted in the cloud. Google Cloud provides us with the tools needed to meet regulatory compliance and security obligations as well as the flexibility and agility to serve the millions of customers that rely on our app every day.” – Dima Levitin, CIO, PayboxIsrael has long been a hub of technology innovation, and we’re excited to support customers Like AI21, Paybox, and others with a cloud that helps them:Better understand and use data: Google Cloud helps customers make better decisions with a unified data platform. We help customers reduce complexity and combine unstructured and structured data — wherever it resides — to quickly and easily produce valuable insights. Establish an open foundation for growth: When customers move to Google Cloud, they get a flexible, secure, and open platform that can evolve with their organization. Our commitment to multicloud, hybrid cloud, and open source offers organizations the freedom of choice, helping to allow their developers to build faster.Create a collaborative environment: In today’s hybrid work environment, Google Cloud provides the tools needed to help transform how people connect, create, and collaborate. Protect systems and users: As every company rethinks its security posture, we help customers protect their data using the same infrastructure and security services that Google uses for its own operations. Build a cleaner, more sustainable future: Google has been carbon neutral for our operations since 2007, and we are working to operate entirely on carbon-free energy by 2030. Today, when customers run on Google Cloud — the cleanest cloud in the industry — the energy that powers their workloads is matched with 100% renewable energy. We’re excited to see what you build with the new Google Cloud region in Israel. Learn more about ourglobal cloud infrastructure, including new and upcoming regions. And don’t miss the Israel launch event.Related ArticleGoogle Cloud announces new region to support growing customer base in IsraelThe new Google Cloud region in Israel will bring low-latency for users in the area, as well as a full complement of Google Cloud services.Read Article
Quelle: Google Cloud Platform

Using Envoy to create cross-region replicas for Cloud Memorystore

In-memory databases are a critical component that deliver the lowest possible latency for your users who might be adding items to online shopping carts, getting personalized content recommendations, or checking their latest account balances. Memorystore makes it easy for developers building these types of applications on Google Cloud to leverage the speed and powerful capabilities of the most loved in-memory store: Redis. Memorystore for Redis offers zonal high availability with a 99.9% SLA for its Standard Tier instances. In some cases, users are looking to expand their Memorystore footprint to multiple regions to support disaster recovery scenarios for regional failure or to provide the lowest possible latency for a multi-region application deployment. We’ll show you how to deploy such an architecture today with the help of the Envoy proxy Redis filter, which we introduced in our previous blog, Scaling to new heights with Cloud Memorystore and Envoy. Envoy makes creating such an architecture both simple and extensible due to its numerous supported configurations. Let’s get started with a hands-on tutorial which demonstrates how you can build a similar solution.Architecture OverviewLet’s start by discussing an architecture of Google Cloud native services combined with open-source software which enables a multi-region Memorystore architecture. To do this, we’ll be using Envoy to mirror traffic to two Memorystore instances which we’ll create in separate regions. For simplicity, we’ll be using Memtier Benchmark, a popular CLI for Redis load generation, as a sample application to simulate end user traffic. In practice, feel free to use your existing application or write your own.Because of Envoy’s traffic mirroring configuration, the application does not need to be aware of the various backend instances that exist and only needs to connect to the proxy. You’ll find a sample architecture below and we’ll briefly detail each of the major components.Before we start, you’ll also want to ensure compatibility with your application by reviewing the list of the Redis commands which Envoy currently supports.  Prerequisites To follow along with this walkthrough, you’ll need a Google Cloud project with permissions to do the following: Deploy Cloud Memorystore for Redis instances (required permissions)Deploy GCE instances with SSH access (required permissions)Cloud Monitoring viewer access (required permissions) Access to Cloud Shell or another gCloud authenticated environment Deploying the multi-region Memorystore backend You’ll start by deploying a backend Memorystore for Redis cache which will serve all of your application traffic. You’ll deploy two instances in separate regions so that we can protect our deployment against regional outages. We’ve chosen regions US-West1 and US-Central1 though you are free to choose whichever regions work best for your use case. From an authenticated cloud shell environment, this can be done as follows:$ gcloud redis instances create memorystore-primary –size=1 –region=us-west1 –tier=STANDARD –async$ gcloud redis instances create memorystore-standby –size=1 –region=us-central1 –tier=STANDARD –asyncIf you do not already have the Memorystore for Redis API enabled in your project, the command will ask you to enable the API before proceeding. While your Memorystore instances deploy, which typically takes a few minutes, you can move onto the next steps. Creating the Client and Proxy VMsNext, you’ll need a VM where you can deploy a Redis client and the Envoy proxy. To protect against regional failures, we’ll create a GCE instance per region. On each instance, you will deploy the two applications, Envoy and Memtier Benchmark, as containers. This type of deployment is referred to as a “sidecar architecture” which is a common Envoy deployment model. Deploying in this fashion nearly eliminates any added network latency as there is no additional physical network hop that takes place. You can start by creating the primary region VM: $ gcloud compute instances create client-primary –zone=us-west1-a –machine-type=e2-highcpu-8 –image-family cos-stable –image-project cos-cloud Next, create the secondary region VM: $ gcloud compute instances create client-standby –zone=us-central1-a –machine-type=e2-highcpu-8 –image-family cos-stable –image-project cos-cloud Configure and Deploy the Envoy Proxy Before deploying the proxy, you need to gather the necessary information to properly configure the Memorystore endpoints. To do this, you need the host IP addresses for the Memorystore instances you have already created. You can gather these like: gcloud redis instances describe memorystore-primary –region us-west1 –format=json | jq -r “.host”gcloud redis instances describe memorystore-standby –region us-central1 –format=json | jq -r “.host”Copy these IP addresses somewhere easily accessible as you’ll use them shortly in your Envoy configuration. You can also find these addresses in the Memorystore console page under the “Primary Endpoint” columns. Next, you’ll need to connect to each of your newly created VM instances, so that you can deploy the Envoy Proxy. You can do this easily via SSH in the Google Cloud Console. More details can be found here.After you have successfully connected to the instance, you’ll create the Envoy configuration. Start by creating a new file named envoy.yaml on the instance with your text editor of choice. Use the following .yaml file, entering the IP addresses of the primary and secondary instances you created:code_block[StructValue([(u’code’, u’static_resources:rn listeners:rn – name: primary_redis_listenerrn address:rn socket_address:rn address: 0.0.0.0rn port_value: 1999rn filter_chains:rn – filters:rn – name: envoy.filters.network.redis_proxyrn typed_config:rn “@type”: type.googleapis.com/envoy.extensions.filters.network.redis_proxy.v3.RedisProxyrn stat_prefix: primary_egress_redisrn settings:rn op_timeout: 5srn enable_hashtagging: truern prefix_routes:rn catch_all_route:rn cluster: primary_redis_instancern request_mirror_policy:rn cluster: secondary_redis_instancern exclude_read_commands: truern – name: secondary_redis_listenerrn address:rn socket_address:rn address: 0.0.0.0rn port_value: 2000rn filter_chains:rn – filters:rn – name: envoy.filters.network.redis_proxyrn typed_config:rn “@type”: type.googleapis.com/envoy.extensions.filters.network.redis_proxy.v3.RedisProxyrn stat_prefix: secondary_egress_redisrn settings:rn op_timeout: 5srn enable_hashtagging: truern prefix_routes:rn catch_all_route:rn cluster: secondary_redis_instancern clusters:rn – name: primary_redis_instancern connect_timeout: 3srn type: STRICT_DNSrn lb_policy: RING_HASHrn dns_lookup_family: V4_ONLYrn load_assignment:rn cluster_name: primary_redis_instancern endpoints:rn – lb_endpoints:rn – endpoint:rn address:rn socket_address:rn address: <primary_region_memorystore_ip>rn port_value: 6379 rn – name: secondary_redis_instancern connect_timeout: 3srn type: STRICT_DNS rn lb_policy: RING_HASHrn load_assignment:rn cluster_name: secondary_redis_instancern endpoints:rn – lb_endpoints:rn – endpoint:rn address:rn socket_address:rn address: <secondary_region_memorystore_ip>rn port_value: 6379rn rnadmin:rn address:rn socket_address:rn address: 0.0.0.0rn port_value: 8001′), (u’language’, u”), (u’caption’, <wagtail.wagtailcore.rich_text.RichText object at 0x3e4ff3ba9090>)])]The various configuration interfaces are explained below:Admin: This interface is optional, it allows you to view configuration and statistics etc. It also allows you to query and modify different aspects of the envoy proxy. Static_resources: This contains items that are configured during startup of the envoy proxy. Inside this we have defined clusters and listeners interfaces. Clusters:  This interface allows you to define clusters which we are defining per region. Inside cluster configuration you define all the available hosts and how to distribute load across those hosts. We have defined two clusters, one in the primary region and another in the secondary region. Each cluster can have a different set of hosts and different load balancer policies. Since there is only one host in each cluster, you can use any load balancer policy as all the requests will be forwarded to that single host.Listeners: This interface allows you to expose the port on which the client would connect, and define behavior of traffic received. In this case we have defined two listeners, one for each regional Memorystore instance.Once you’ve added your Memorystore instance IP addresses, save the file locally to your container OS VM where it can be easily referenced. Make sure to repeat these steps for your secondary instance as well. Now, you’ll use Docker to pull the official Envoy proxy image and run it with your own configuration. On primary region client machine, run this command: $ docker run –rm -d -p 8001:8001 -p 6379:1999 -v $(pwd)/envoy.yaml:/envoy.yaml envoyproxy/envoy:v1.21.0 -c /envoy.yaml On the standby region client machine, run this command: $ docker run –rm -d -p 8001:8001 -p 6379:2000 -v $(pwd)/envoy.yaml:/envoy.yaml envoyproxy/envoy:v1.21.0 -c /envoy.yamlFor our standby region, we have changed the binding port to port 2000. This is to ensure that traffic from our standby clients are routed to the standby instance in the event of a regional failure which makes our primary instance unavailable.In this example, we are deploying envoy proxy manually, but, in practice, you will implement a CI/CD pipeline which will deploy the envoy proxy and bind ports depending on your region based configuration. Now that Envoy is deployed, you can test it by visiting the admin interface from the container VM: $ curl -v localhost:8001/statsIf successful, you should see a print out of the various Envoy admin stats in your terminal. Without any traffic yet, these will not be particularly useful, but they allow you to ensure that your container is running and available on the network. If this command does not succeed, we recommend checking that the Envoy container is running. Common issues include syntax errors within your envoy.yaml and can be found by running your Envoy container interactively and reading the terminal output. Deploy and Run Memtier Benchmark After reconnecting to the primary client instance in us-west1 via SSH, you will now deploy the Memtier Benchmark utility which you’ll use to generate artificial Redis traffic. Since you are using Memtier Benchmark, you do not need to provide your own dataset. The utility will populate the cache for you using a series of set commands.code_block[StructValue([(u’code’, u’$ for i in {1..5}; do docker run –network=”host” –rm -d redislabs/memtier_benchmark:1.3.0 -s 127.0.0.1 -p 6379 u2014threads 2 u2013clients 10 –test-time=300 –key-maximum=100000 –ratio=1:1 –key-prefix=”memtier-$RANDOM-“; done’), (u’language’, u”), (u’caption’, <wagtail.wagtailcore.rich_text.RichText object at 0x3e4ff3ba4910>)])]Validate the cache contents Now that we’ve generated some data from our primary region’s client, let’s ensure that it has been written to both of our regional Memorystore instances. We can do this by using cloud monitoring metrics-explorer. Next, you’ll configure the chart via “MQL” which can be selected at the top of the explorer pane. For ease, we’ve created a query which you can simply paste into your console to populate your graph:code_block[StructValue([(u’code’, u”fetch redis_instancern| metric ‘redis.googleapis.com/keyspace/keys’rn| filterrn (resource.instance_id =~ ‘.*memorystore.*’) && (metric.role == ‘primary’)rn| group_by 1m, [value_keys_mean: mean(value.keys)]rn| every 1m”), (u’language’, u”), (u’caption’, <wagtail.wagtailcore.rich_text.RichText object at 0x3e4ff25a6210>)])]If you have created your Memorystore instances with a different naming convention or have other Memorystore instances within the same project, you may need to modify the resource.instance_id filter. Once you’re finished, ensure that your chart is viewing the appropriate time range, and you should see something like:In this graph, you should see two like lines which show the same number of keys in both Memorystore instances. If you want to view metrics for a single instance, you can do this by using the default monitoring graphs which are available from the Memorystore console after selecting a specific instance. Simulate Regional Failure Regional failure is a rare event. We will simulate this by deleting our primary Memorystore instance and primary client VM. Let’s start by deleting our primary Memorystore instance like: $ gcloud redis instances delete memorystore-primary –region=us-west1And then our client VM like: $ gcloud compute instances delete client-primaryNext, we’ll need to generate traffic from our secondary region client VM which we are using as our standby application. For the sake of this example, we’ll manually perform a failover and generate traffic to save time. In practice, you’ll want to devise a failover strategy to automatically divert traffic to the standby region when the primary region becomes unavailable. Typically, this is done with the help of services like Cloud Load Balancer. Once more, ssh into the secondary region client VM from the console and run the Memtier benchmark application as mentioned in the previous section. You can validate that reads and writes are properly routing to our standby instance by viewing the console’s monitoring graphs once more.  Once the original primary Memorystore instance is available again, it will become the new standby instance based on our Envoy configuration. It will also be out of sync with our new primary instance as it has missed writes during its unavailability. We do not intend to cover a detailed solution in this post, but we find that most users opt to rely on TTL which they have set on their keys to determine when their caches will eventually be in sync.  Clean UpIf you have followed along, you’ll want to spend a few minutes cleaning up resources to avoid accruing unwanted charges. You’ll need to delete the following: Any deployed Memorystore instances Any deployed GCE instancesMemorystore instances can be deleted like: $ gcloud redis instances delete <instance-name> –region=<region>The GCE container OS instance can be deleted like: $ gcloud compute instances delete <instance-name>If you created additional instances, you can simply chain them in a single command separated by spaces. ConclusionWhile Cloud Memorystore Standard tier provides high availability, some use cases require an even higher availability guarantee. Envoy and its Redis filter make creating a multi-regional deployment simple and extensible. The outline provided above is a great place to get started. These instructions can easily be extended to support automated region failover or even dual region active-active deployments. As always, you can learn more about Cloud Memorystore through our documentation or request desired features via our public issue tracker.Related ArticleScaling to new heights with Cloud Memorystore and EnvoyLearn how to scale your Google Cloud Memorystore for Redis database for high volume use cases in just a few minutes with the help of Envo…Read Article
Quelle: Google Cloud Platform

Introducing lock insights and transaction insights for Spanner: troubleshoot lock contentions with pre-built dashboards

As a developer, DevOps engineer or a database administrator, you have to typically deal with database lock issues. Often, rows locked by queries cause lags and can slow down applications resulting in poor user experience. Today, we are excited to announce the launch of lock insights and transaction insights for Cloud Spanner that provide a set of new visualization tools for developers and database administrators to quickly diagnose lock contention issues on Spanner. If you observe application slowness, a common issue could be lock contentions, which happen when multiple transactions are trying to modify the same row. Debugging lock contentions is not easy as it requires identifying the row ranges and columns on which transactions are contending for locks. This process can be tedious and time consuming without a visual interface. Today, we are solving this problem for customers.Lock insights and transaction insights provide pre-built dashboards that make it easy to detect row ranges with the highest lock wait time, find transactions reading or writing on these row ranges, and identify the transactions with highest latencies causing these lock conflicts.Earlier this year, we launched query insights for debugging query performance issues. Together with lock insights and transaction insights, these capabilities provide developers easy-to-use observability tools to troubleshoot issues and optimize the performance of their Spanner databases.Lock insights and transaction insights are available at no additional cost.”Lock insights will be very helpful to debug lock contention which typically takes hours.” said Dominick Anggara, MSc., Staff Software Engineer at Kohl’s. “It allows the user to see the big picture, and make it easy to make correlations, and then narrow down to specific transactions. That’s what makes it powerful. Really looking forward to using this in production”.Why do lock issues happen?Most databases take locks on data to prohibit other transactions from concurrently changing the data to preserve data integrity. When you access data with the intent to change it, a lock prohibits other transactions from accessing the data while it is being modified. But when the data is locked, it can negatively impact application performance as other tasks wait to access the data. Cloud Spanner, Google Cloud’s fully managed horizontally scalable relational database service, offers the strictest concurrency-control guarantees, so that you can focus on the logic of the transaction without worrying about data integrity. To give you this peace of mind, and to ensure consistency of multiple concurrent transactions, Spanner uses a combination of shared locks and exclusive locks at the table cell level (granularity of row-and-column) and not at the whole row level. You can learn more about different types of Lock modes for Spanner in our documentation.Follow a visual journey with pre-built dashboardsWith lock insights and transaction insights, developers can smoothly move from detection of latency issues to diagnosis of lock contentions, and ultimately identification of transactions that are contending for locks. Once the transactions causing the lock conflicts are identified, you can then try to identify issues in each transaction that are contributing to the problem.You could do this by following a simple journey where you can quickly confirm if the application slowness is due to lock contentions, correlate row ranges and columns which have the highest lock wait time with the transactions taking locks on these row ranges, identify the transactions with the highest latencies, and analyze these transactions which are contending on locks. Let’s walk through an example scenario. Diagnose application slownessThis journey will start by setting up an alert on Google Cloud Monitoring for latency (api/request_latencies) going above a certain threshold. The alert could be configured in a way that if this threshold is crossed, you will be notified with an email alert, with a link to the “Monitoring” dashboard.Once you receive this alert, you would click on the link in the email, and navigate to the “Monitoring” dashboard. If you observe a spike in read/write latency, no observable spike in CPU utilization, and a dip in Throughput and/or Operations per second, a possible root cause could be lock contentions. A combination of these patterns in these metrics could be a strong signal that the system is locking due to the transactions contending on the same cells, even though the workload remains the same. Below, you can observe a spike between 5:45 PM and 6:00 PM. This could be due to new application code deployment which might have introduced a new access pattern.The next step is to confirm that this application slowness is indeed due to the lock contentions. This is where lock insights comes in. You can get to this tool by clicking on “Lock insights” in the left navigation of the Spanner Instance view in your Cloud Console. Here, the first graph that you see will be for Total lock wait time. If you observe a corresponding spike on this graph in the corresponding time window, this would confirm that the application’s slowness is due to lock contentions.Co-relating row ranges, columns and transactionsNow you can select the database which is seeing the spike in total lock wait time, and drill down to see the row ranges with the highest lock wait times. When a user clicks on a row-range which has the highest lock wait times, a right panel will open up. This will show sample lock requests for that row range which includes the columns which were read from or written to, the type of lock which was acquired on this row-column combination (database cell), and links to view the transactions which were contending for these locks. This helps co-relate row ranges, columns and transactions makes this journey seamless to switch between lock insights and transaction insights as explained in the next section.In the above screenshot, we can see that at 5:53 PM, the first row range in the table (order_item(82,12)) is showing the highest lock wait times. You can investigate further by looking at the transactions which were acting on the sample lock columns. Identifying transactions with highest write latencies causing locksWhen you click on “View transactions” on the lock insights page, you will navigate to the transaction insights page with the topN transactions table (by latency) filtered on the Sample lock Columns from the previous page (lock insights), so you will view the topN transactions in the context of the locks (and row ranges) which were identified earlier in the journey.In this example we can see that the first transaction reading from and writing to columns item_inventory._exists, item_inventory.count has the highest latencies and could be one of the transactions causing lock contentions. We can also see that the second transaction in the table is also trying to read from the same column, and could be waiting on locks since the average latency is high. We should drill deep and investigate both these transactions.Analyzing transactions to fix lock contentionsOnce you have identified the transactions causing the locks, you can drill down into these transaction shapes to analyze the root cause of lock contentions.You can do this by clicking on the Fingerprint ID for the specific transactions from the topN table, and navigating to the Transaction Details page where you will be able to see a list of metrics (Latency, CPU Utilization, Execution count, Rows Scanned / Rows Returned) over a time series for that specific transaction.In this example, we notice that when we drill down into the second transaction, this transaction is only attempting to read and not write. By definition, the topN transactions table (on the previous page) only shows read-write transactions which take locks. We can also see that the abort count / total attempt count ratio (28/34) is very high, which means that most of the attempts are getting aborted.Fixing the issueTo fix the problem in this scenario, you can convert this transaction from a read-write transaction to a read-only transaction, which would prevent it from taking locks on the cell, and thereby reducing lock contention and reducing write latencies.By following this simple visual journey, you can easily detect, diagnose and fix lock contention issues on Spanner.When looking at potential issues in your application, or even when designing your application, consider these best practices to reduce the number of lock conflicts in your database.Get started with lock insights and transaction insights todayTo learn more about lock insights and transaction insights, review the documentation here, and watch the explainer video here.Lock insights and transaction insights are enabled by default. In the Spanner console, you can click on “Lock insights” and “Transaction insights” in the left navigation and start visualizing lock issues and transaction performance metrics! New to Spanner? Create a 90-day Spanner free trial instance. Try Spanner for free.Related ArticleIntroducing Query Insights for Cloud Spanner: troubleshoot performance issues with pre-built dashboardsSpanner’s ‘Query insights’ – a new tool that makes it easy to debug query performance issues.Read Article
Quelle: Google Cloud Platform