How Vodafone Hungary migrated their data platform to Google Cloud

Vodafone is currently the second largest telecommunication company in Hungary, and recently  acquired UPC Hungary to extend its previous mobile services with fix portfolio. Following the acquisition, Vodafone Hungary serves approximately 3.8 million residential and business subscribers. This story is about how Vodafone Hungary benefited from moving its data and analytics platform to Google Cloud. To support this acquisition, Vodafone Hungary went through a large business transformation that required changes in many IT systems to create a future-ready IT architecture. The goal of the transformation was to provide future-proof services for customers in all segments of the Hungarian mobile market. During this transformation, Vodafone’s core IT systems changed, which created the challenge of building a new data and analytics environment in a fast and effective way. During the project data had to be moved from the previous on-premises analytics service to the cloud. This was achieved by  migrating existing data and merging them with data coming from the new systems in a very short timeframe of  around six months.  During the project there were several changes in the source system data structure that needed to be adapted quickly on the analytics side to reach the Go Live date.Data and  analytics in Google CloudTo answer this challenge, Vodafone Hungary decided to partner with Google Cloud. The partnership was based on implementing a full metadata-driven analytics environment in a multi-vendor project using cutting edge Google Cloud solutions such as Data Fusion and BigQuery. The Vodafone Hungary Data Engineering team gained significant knowledge of the new Google Cloud solutions, which meant the team was able to support the company’s long-term initiatives.Based on data loaded by this metadata-driven framework, Vodafone Hungary built up a sophisticated data and analytics service on Google Cloud that helped it become a data-driven company.By analyzing data from throughout the company with the help of Google Cloud, Vodafone was able to gain insights that provided a clearer picture of the business. They now have a holistic view of customers across all segments. Along with these core KPIs, the advanced analytics and Big Data models built on the top of this data and analytics services ensures that customers get more personalized offers than was previously possible.. It used to be the case that a business requestor needed to define a project to send new data to the data warehouse. The new metadata-driven framework allows the internal data engineering team to onboard new systems and new data in a very short time (within days), thus speeding up the BI development and decision-making process.Technical solutionThe solution uses several technical innovations to meet the requirements of the business. The local data extraction solution is built on the top of the CDAP and Hadoop technologies written in CDAP pipelines, PySpark jobs, and Unix shell script. In this layer, the system gets data from several sources in several formats including database extracts and different file types. The system needs to manage around 1,900 loads on a daily basis, and most data arriving in a five-hour time frame. Therefore, the framework needs to be a highly scalable system that can handle the high loading peaks without generating unexpected cost during the low peaks.Once collected, the data from the extraction layer goes to the cloud in an encrypted and anonymized format. In the cloud, the extracted data lands in a Google Cloud Storage bucket. By arriving at the file, it triggers the Data Fusion pipelines in an event-based way by using the Log Sink, Pub/Sub, Cloud Function, and REST API. After triggering the data load, Cloud Composer controls the execution of the metadata-driven, template-based, auto-generated DAGs. Data Fusion ephemeral clusters were chosen as they adapt to the size of each data pipeline while also controlling costs during low peaks. The principle of limited liability is important. Each component has a relatively limited range of responsibilities, which means that Cloud Function, DAGs, and Pipelines contain the minimum responsibilities and logic that is necessary to finish their own tasks.After loading this data into a raw layer, several tasks are triggered in Data Fusion to build up an historical aggregated layer. The Vodafone Hungary data team can use this to create their own reports in a Qlik environment (which also runs on the Google Cloud environment) and build up Big Data and advanced analytical models using the Vodafone standard Big Data framework. The most critical point of the architecture is the custom triggering function, which handles scheduling and execution of processes. The process triggers more than 1,900 DAGs per day, while also moving and processing around 1 TB of anonymized data per day.The way forwardAfter the stabilization, the optimization of the processes started taking into account cost and efficiency levels. The architecture was upgraded to use Airflow 2 and Composer 2 as these systems became available. Moving the architecture to these versions increased performance and manageability. Going forward, Vodafone Hungary will continue searching for even more ways to improve processes with the help of the Google Support team. To support fast and effective processing, Vodafone Hungary recently decided to move the control tables to Google Cloud Spanner and keep only the business data in BigQuery. This delivered a great improvement in  processing.In the analytics area, Vodafone Hungary plans to move to more advanced and cutting-edge technologies, which will allow the Big Data team to improve their performance by using Google Cloud native machine learning tools such as Auto ML and Vertex AI. These will further improve the effectiveness of the targeted campaigns and offer the benefit of advanced data analysis.To get started, we recommend you check out BigQuery’s free trial and BigQuery’s Migration Assessment.
Quelle: Google Cloud Platform

Carbon Health transforms operating outcomes with Connected Sheets for Looker

Everyone wants affordable, quality healthcare but not everyone has it. A 2021 report by the Commonwealth Fund ranked the U.S. in last place among 11 high-income countries in healthcare access.1 Carbon Health is working to change that. We are doing so by combining the best of virtual care, in-person visits, and technology to support patients with their everyday physical and mental health needs.Rethinking how data and analytics are accessed at Carbon Health Delivering premium healthcare for the masses that’s accessible and affordable is an ambitious undertaking. It requires a commitment to operating the business in an efficient and disciplined way. To meet our goals, our teams across the company require detailed, daily insights into operating results.In the last year, we realized our existing BI platform was inaccessible to most of our employees outside of R&D. Creating the analytics, dashboards, and reports needed by our clinic leaders and executives required direct help from our data scientists. However, this has all changed since deploying Looker as our new BI platform. We initially used Looker to build tables, charts, and graphs that improved how people could access and analyze data about our operating efficiency. As we continued to evaluate how our data and analytics should be experienced by our in-clinic staff, we learned about Connected Sheets for Looker, which has unlocked an entirely new way of sharing insights across the company.A new way to deliver performance reporting and drive resultsConnected Sheets for Looker gives Carbon Health employees who work in Google Sheets—practically everyone—a familiar tool for working with Looker data. For instance, one of our first outputs using the Connected Sheets integration has been a daily and weekly performance push-report for the clinic’s operating leaders, including providers. Essentially a scorecard, the report tracks the most important KPIs for measuring clinics’ successes, including appointment volume, patient satisfaction such as net promoter score (NPS), reviews, phone call answer rates, and even metrics about billing and collections. To provide easy access, we built a workflow through Google App Script that takes our daily performance report and automatically emails a PDF to key clinic leaders each morning. Within the first 30 days of the report’s creation, clinic leaders were able to drive noticeable improvements in operating results. For instance, actively tracking clinic volume has enabled us to manage our schedules more effectively, which in turn drives more visits and enables us to better communicate expectations with our patients. Other clinics have dramatically improved their call answer rates by tracking inbound call volume, which has also led to better patient satisfaction. Greater accountability, greater collaborationAs you can imagine, a report that holds people accountable for outcomes in such a visible way can create some anxiety. We’ve eased those concerns by using the information constructively, with the goal to use reporting as a positive feedback mechanism to bolster open collaboration and identify operational processes that need improvement. For example, data about our call answer rates initiated an investigation that led to an operational redesign of how phones are deployed and managed at more than 120 clinics across the U.S.Looker as a scalable solution with endless applicationsWe’re now rolling out Connected Sheets for Looker to deliver performance push-reporting across all teams at Carbon Health. Additionally, we continue to find new ways to leverage Connected Sheets for Looker to meet other needs of the business. For instance, we’ve recently been able to better understand our software costs by analyzing vendor spend from our accounting systems directly in Google Sheets. Going forward, this will allow us to build a basic workflow to monitor subscription spend and employee application usage, which will lead to us saving money on unnecessary licenses and underutilized software. We’ve come a long way in the last year. Between Looker and its integration with Google Sheets, we can meet the data needs of all our stakeholders at Carbon Health. Connected Sheets for Looker has been an impactful solution that’s going to help us drive measurable results in how we deliver premium healthcare to the masses.1. Mirror, Mirror 2021: Reflecting Poorly2.  HEALTHCARE EDITORS’ PICK Meet The Immigrant Entrepreneurs Who Raised $350 Million To Rethink U.S. Primary CareRelated ArticleAnalyze Looker-modeled data through Google SheetsConnected Sheets for Looker brings modeled, trusted data into Google Sheets, enabling users to work in a way that is comfortable and conv…Read Article
Quelle: Google Cloud Platform

Using budgets to automate cost controls

TL;DR – Budgets can do more than just track costs! You can set up automated cost controls using programmatic budget notifications, and we have an interactive walkthrough with sample architecture to help get you started.Budgets can help you answer cost questions, and so much more!There’s a few blog posts on what Google Cloud Budgets are and how to use them for more than just sending emails by using programmatic budget notifications. These are important steps to take when using Google Cloud, so you can accurately ask and answer questions about your costs and get meaningful answers in the systems you already use. As your cloud usage grows and matures, you may also need to be more proactive in dealing with your costs.More than just a budgetTo recap: budgets let you create a dynamic way of being alerted about your costs, such as getting emails when you’ve spent or are forecasted to spend a certain amount. When creating a budget, you can provide a fixed amount or you can have the amount based on the previous period, so you could set up a budget that alerts you if your spending has changed significantly in a monthly cadence. In addition, you can have budgets send data to Pub/Sub on a regular basis (programmatic budget notifications) that can be used however you’d like, such as sending messages to Slack.Budgets that send out notifications are flexible enough to do just about anything, but that’s also where things can become a bit tricky to set up. If you’re monitoring the costs for a large company with a lot of cloud usage, that could involve multiple environments with lots of products being used in different ways. Being informed about the costs is a good starting point, but you’ll likely want to set up automated cost controls to protect yourself and your cloud spending.In essence, setting up automated cost controls is the same as using programmatic budget notifications: the budget occasionally sends out a Pub/Sub message, and you create a Cloud Function (or similar) subscriber that receives that message and runs some code. Of course, the specifics of that code might be anything and will heavily depend on your business logic needs, ranging from sending a text message all the way to shutting down cloud resources. While the specifics are up to you, we made a few things to make getting started easier!aside_block[StructValue([(u’title’, u’Get started with building a cost-enforcement solution’), (u’body’, <wagtail.wagtailcore.rich_text.RichText object at 0x3e46f43f9c10>), (u’btn_text’, u’Try it out!’), (u’href’, u’https://console.cloud.google.com/?walkthrough_id=billing–budget–cost_enforcement’), (u’image’, None)])]Show me the wayWe’ve created an interactive walkthrough to help you with all of the steps needed in getting programmatic budget notifications up and running.Following the walkthrough, you’ll set up a budget, Pub/Sub topic, and Cloud Function that work together to respond to programmatic notifications. Not only will you get a sense of all the pieces involved, you can easily modify the code from the function for your specific purposes, so it serves as a great starting point. That also leads to a question I’ve heard often: “This is great, but what code am I supposed to use?” And that is why we’ve expanded our walkthrough to include a full, one-click architecture deployment!It’s like a sentry, but for your cloud costsCost Sentry, powered by DeployStack, takes the next step in programmatic budget notifications and sets up all the pieces needed to create basic automated cost-enforcement, as well as some example architecture to test it on! In fact, the overall architecture isn’t much more than just setting up the programmatic budget notifications alone, but it gives a good example of how that could work in a full environment. This architecture will get deployed for you, along with the working code to handle a programmatic budget notification and interact with Compute Engine and Cloud Run.Both the walkthrough and deploying the Cost Sentry stack can be used as the starting point for a full automated cost-enforcement solution. With these samples, you’ll want to take a look at the Cloud Function code that receives data from your budget, and how it interacts with the Google Cloud APIs to shut down resources. In this example, any Compute Engine instances or Cloud Run deployments that have been labeled with ‘costsentry’ will be shut-down/disabled when your budget exceeds the configured amount.While this is a great solution for getting an automated cost-enforcement solution started, the hard part is probably in the next questions you’ll need to answer for your use case. Questions like “What do I actually want to have happen when I hit my budget?” and “Will stopping all of these instances automatically have ramifications?” (spoiler alert: probably) are important ones to figure out when looking at the full scope of a cost-enforcement solution.Setting up a full automated cost enforcement solution gives you the flexibility to customize your response to budget updates, such as sending higher-priority messaging as you get closer to your budget total, and taking action by shutting down services when you greatly exceed your budget. Any way that you want to build a solution, this is a great starting point!Go forth, and doThis may seem like a lot, and I’m a big fan of the “crawl, walk, run” philosophy. If you’re new to Google Cloud, get started by just setting up a budget for all of your costs. From there, you can work with programmatic budget notifications to start expanding how you use budgets. As you get more familiar with Google Cloud, you’ll likely need to customize your cost controls and start with Cost Sentry to set up your automated cost-enforcement solution.Check out the interactive walkthrough and Cost Sentry architecture to get started!Related ArticleCosts meet code with programmatic budget notificationsTL;DR – More than just alerts, budgets can also send notifications to Pub/Sub. Once they’re in Pub/Sub, you can hook up all kinds of serv…Read ArticleRelated ArticleProtect your Google Cloud spending with budgetsBudgets are the first and simplest way to get a handle on your cloud spend. In this post, we break down a budget and help you set up aler…Read Article
Quelle: Google Cloud Platform

Building out your support insights pipeline

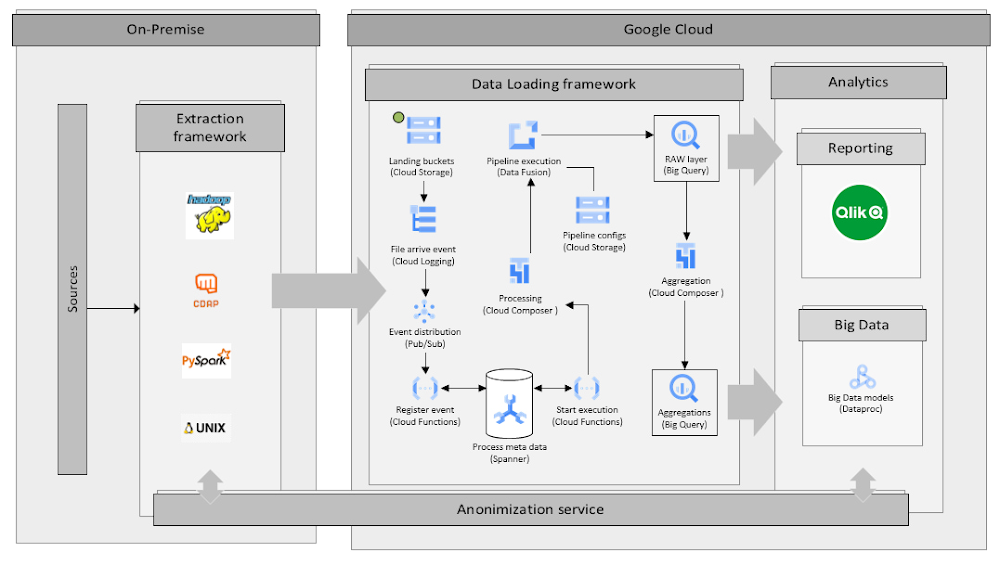
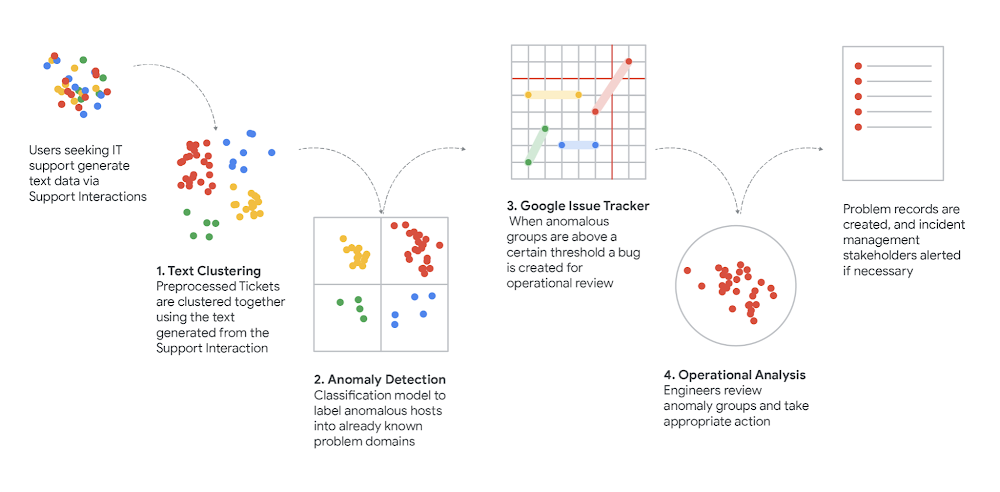
Getting into the detailsWe wrote previously about how we used clustering to connect requests for support (in text form) to the best tech support articles so we could answer questions faster and more efficiently. In a constantly changing environment (and in a very oddball couple of years) we wanted to make sure we’re focused on preserving our people’s productivity by isolating, understanding and responding to new support trends as fast as we can.Now we’d like to get into a bit more detail about how we did all that and what went on behind the scenes of our process: ExtractionGoogle’s historical support ticket data and metadata are stored in BigQuery, as are the analysis results we generate from that data. We read and write that content using the BigQuery API. However, much of these tickets contain information that is not useful to the ML pipeline and should not be included in the preprocessing and text modeling phases. For example, boilerplate generated from our case management tools must be stripped out using regex and other technologies in order to isolate the IT interaction between the tech and users. Furthermore, once all boilerplate has been removed, we use part-of-speech tagging to isolate only the nouns within the interaction, since nouns themselves proved to be the best features for modeling an interaction and differentiating a topic. Any one interaction could have 100+ nouns depending on the complexity.  Using these nouns, we take one more step and use stemming and lemmatization to remove any suffix that may be placed on the noun (e.g., “computers” becomes “computer”). This allows for any modification of the root words to be modeled as the same feature and reduces noise in our clustering results.Once each interaction is transformed into a set of nouns (and unique identifier), we can then move on to more advanced preprocessing techniques.Text ModelingTo cluster the ticket set, it must first be converted into a robust feature space. The core technology underlying our featurization process is TensorFlow transformers, which can be invoked using the TFX API. TensorFlow parses and annotates the tickets’ natural-language contents and these annotations, once normalized and filtered, form a sparse feature space. The Cloud Data Loss Prevention (DLP) API redacts several categories of sensitive information — e.g., person names — from the tickets’ contents, which both mitigates privacy leakage and prunes low-relevance tokens from the feature space.Although clustering can be performed against a sparse space, it is typically more effective if the space is densified to prune excessive dimensionality. We accomplish this using the term frequency-inverse document frequency (TF-IDF) statistical technique with a predefined maximum feature count – we also investigated more heavy-duty densification strategies using trained embedding models, but found that the quality improvements over TF-IDF were marginal for our use case, at the cost of a substantial reduction in human interpretability.ClusteringThe generated ticket feature set is partitioned into clusters using ClustOn. As this is an unsupervised learning problem, we arrived at the clustering process’s hyper-parameterization values via experimentation and human expert analysis. The trained parameters produced by the algorithm are persisted between subsequent runs of the pipeline in order to maintain consistent cluster IDs; this allows later operational systems to directly track and evaluate a cluster’s evolution over real time. The resulting cluster set is sanity-checked by some basic heuristic measures, such a silhouette score, and then rejoined with the initial ticket data for analysis. Moreover, for privacy purposes, each cluster whose ticket cohort size falls below a predefined threshold is omitted from the data set; this ensures that cluster metadata in the output, such as feature data used to characterize the cluster, cannot be traced with high confidence back to individual tickets.Scoring & Anomaly DetectionOnce a cluster has been identified, we need a way to automatically estimate how likely it is that the cluster has recently undergone a state change which might indicate an incipient event, as opposed to remaining in a steady state. “Anomalous” clusters — i.e. those which exhibit a sufficiently high likelihood of an event — can be flagged for later operational investigation, while the rest can be disregarded.Modeling a cluster’s behavior over time is done by distributing its tickets into a histogram according to their time of creation — using 24-hour buckets, reflecting the daily business cycle — and fitting a zero-inflated Poisson regression to the bucket counts using statsmodel1. However, our goal is not just to characterize a cluster’s state, but to detect a discrete change in that state. This is accomplished by developing two models of the same cluster: one of its long-term behavior, and the other of its short-term behavior. The distinction between “long-term” and “short-term” can be as simple as partitioning the histogram’s buckets at some age threshold. But we chose a slightly more nuanced approach: both models are fitted to the entire histogram, but under two different weighting schemata; both decay exponentially by age, but at different rates, so that recent buckets are weighted relatively more heavily in the short-term model than the long-term one.Both models are “optimized,” in that each achieves the maximum log-likelihood in its respective context. But if the long-term model is evaluated in the short-term context instead, its log-likelihood will show some amount of loss relative to the maximum achieved by the short-term model in the same context. This loss reflects the degree to which the long-term model fails to accurately predict the cluster’s short-term behavior — in other words, the degree to which the cluster’s short-term behavior deviates from the expectation established by its short-term behavior — and thus we refer to it as the deviation score. This score serves as our key measure of anomaly; if it surpasses a defined threshold, the cluster is deemed anomalous.OperationalizeUsing the IssueTracker API, bugs are auto-generated each time an anomalous cluster is detected. These bugs contain some summary of the tokens found within the cluster itself as well as a parameterized link to the DataStudio dashboard. These dashboards show the size of the cluster over time, the deviation score and the underlying tickets. These bugs are picked up by Techstop operations engineers and investigated to determine the root causes, allowing for quicker boots on the ground for any outages that may be occurring, as well as a more harmonious flow of data between support operations and change and incident management teams.Staying within the IssueTracker product, operations engineers create Problem Records in a separate queue detailing the problem, stakeholders and any solution content. These problem records are shared widely with frontline operations to help address any ongoing issues or outages.However, the secret sauce does not stop there. Techstop then uses Google’s Cloud AutoML engine to train a supervised model to classify any incoming support requests against known Problem Records (IssueTracker bugs). This model acts as a service for two critical functions:The model is called by our Chrome extension (see this handy guide) to recommend Problem Records to frontline techs based on the current ongoing chat. For a company like Google that has a global IT team, this recommendation engine allows for coverage and visibility of issues in near real timeThe model answers the “how big” question: Many stakeholders want to know how big the problem was, how many end users did this problem affect and so on. By training an AutoML model we can now give good estimators about impact and more importantly we can measure impact of project work that addresses these problems.Resampling & User Journey MappingGoing beyond incident response, we then semi-automatically extracts user journeys from these trends by sampling each cluster to discover the proportion of user intents. These intents are then used to map user pitfalls and generate a sense of topic for each emerging cluster.Since operations are constrained by tech evaluation time, a solution to limit the number of reviews necessary that each agent would need to inspect, while still maintaining the accuracy of analysis, was derived. User intents are defined as user “Goals” an employee may have when engaging with IT support. For example, “I want my cell phone to boot” or “I lost access to an internal tool” are good examples. Therefore, we propose a two-step procedure (to be applied for each cluster).First, we sample chats until the probability that we discover a new intent is small (say <5% or whatever number we want). We can evaluate this probability at each step through the Good-Turing method.A simple Good-Turing estimate of this probability can be found as E(1) / N, where N is the number of sampled chats so far and E(1) is approximately the number of intents that have only been seen once so far. This number should be lightly smoothed for better accuracy; it’s easy to implement this smoothing on our own2 or call a library.Once we have finished, we take the intents that we consider representative (say there are k of them) and create one additional category for “other intents.” Then, we estimate the sample size for multinomial estimation (with k+1 categories) that we still need to reach, given composition accuracy (say, that each intent fraction is within e.g., 0.1 or 0.2 of the actual fraction). To do so, we consider Thompson’s procedure3, but take advantage of the data collected so far to be used as a plugin estimate for the possible values of the parameters, plus we should also consider a grid of parameter values within a confidence interval of the current plugin estimate, to be sufficiently conservative. The procedure is described on page 43 in this article, steps (1) and (2). The procedure is easy to implement and under our current setup, it will be a few lines of code. The procedure gives us the target sample size. If we have already reached this sample size in step 1, we are done. Otherwise, we sample a few more chats to reach this sample size.This work along with the AutoML model allows Google to understand not only the problem impact size, but also key information about user experiences and where the CUJ users are struggling the most. In many cases a problem record will contain multiple CUJs (user intents) with separate personas and root causes. Helping the businessOnce we can make good estimators for different user goals we can work with domain experts to map clear user journeys, i.e., we can now use the data that this pipeline has generated to construct a user journey in a bottoms-up approach. This same amount of work, sifting through data, aggregating similar cases and estimating proportions of user goals would take an entire team of engineers and case scrubbers. With this ML solution we can now get the same (if not better) results with much lower operational costs.These user journeys then can be fed to internal dashboards for key decision makers to understand the health of their products and service areas. It allows for automated incident management and acts as a safeguard against unplanned changes or user-affecting changes that did not go through the proper change management processes. Furthermore, it is critical for problem management and other core functions within our IT service. By having a small team of operational engineers reviewing the output of this ML pipeline, we can create healthy problem records and keep track of our team’s top user issues.How do I do this too?Want to make your own system for insights into your support pipeline? Here’s a recipe to follow that will help you build all the parts you needLoad your data into BigQuery – Cloud BigQueryVectorize it with TF-IDF – TensorFlow VectorizerPerform clustering – TensorFlow ClusteringScore Clusters – Statsmodels Poisson RegressionAutomate with Dataflow – Cloud DataFlowOperationalize – IssueTracker API1. When modeling a cluster, that cluster’s histogram serves as the regression’s endogenous variable. Additionally, the analogous histogram of the entire ticket set, across all clusters, serves as an exogenous variable. The latter histogram captures the overall ebb and flow in ticket generation rates due to cluster-agnostic business cycles (e.g. rates tend to be higher on weekdays than weekends), and its inclusion mitigates the impact of such cycles on each cluster’s individual model.2. Gale, William A., and Geoffrey Sampson. “Good‐turing frequency estimation without tears.” Journal of quantitative linguistics 2.3 (1995): 217-237.3. Thompson, Steven K. “Sample size for estimating multinomial proportions.” The American Statistician 41.1 (1987): 42-46.
Quelle: Google Cloud Platform

How StreamNative facilitates integrated use of Apache Pulsar through Google Cloud

StreamNative, a company founded by the original developers of Apache Pulsar and Apache BookKeeper, is partnering Google Cloud to build a streaming platform on open source technologies. We are dedicated to helping businesses generate maximum value from their enterprise data by offering effortless ways to realize real-time data streaming. Following the release of StreamNative Cloud in August 2020, which provides scalable and reliable Pulsar-Cluster-as-a-Service, we introduced StreamNative Cloud for Kafka. This is to enable a seamless switch between Kafka API and Pulsar. We then launched StreamNative Platform to support global event streaming data platforms in multi-cloud and hybrid-cloud environments.By leveraging our fully-managed Pulsar infrastructure services, our enterprise customers can easily build their event-driven applications with Apache Pulsar and get real-time value from their data. There are solid reasons why Apache Pulsar has become one of the most popular messaging platforms in modern cloud environments, and we have strong beliefs in its capabilities of simplifying building complex event-driven applications. The most prominent benefits of using Apache Pulsar to manage real-time events include:Single API: When building a complex event-driven application, it traditionally requires linking multiple systems to support queuing, streaming and table semantics. Apache Pulsar frees developers from the headache of managing multiple APIs by offering one single API that supports all messaging-related workloads.Multi-tenancy: With the built-in multi-tenancy feature, Apache Pulsar enables secure data sharing across different departments with one global cluster. This architecture not only helps reduce infrastructure costs, but also avoids data silos.Simplified application architecture: Pulsar clusters can scale to millions of topics while delivering consistent performance, which means that developers don’t have to restructure their applications when the number of topic-partitions surpasses hundreds. The application architecture can therefore be simplified.Geo-replication: Apache Pulsar supports both synchronous and asynchronous geo-replication out-of-the-box, which makes building event-driven applications in multi-cloud and hybrid-cloud environments very easy.Facilitating integration between Apache Pulsar and Google CloudTo allow our customers to fully enjoy the benefits of Apache Pulsar, we’ve been working on expanding the Apache Pulsar ecosystem by improving the integration between Apache Pulsar and powerful cloud platforms like Google Cloud. In mid-2022, we added Google Cloud Pub/Sub Connector for Apache Pulsar, which enables seamless data replication between Pub/Sub and Apache Pulsar, and Google Cloud BigQuery Sink Connector for Apache Pulsar, which synchronizes Pulsar data to BigQuery in real time, to the Apache Pulsar ecosystem.Google Cloud Pub/Sub Connector for Apache Pulsar uses Pulsar IO components to realize fully-featured messaging and streaming between Pub/Sub and Apache Pulsar, which has its own distinctive features. Using Pub/Sub and Apache Pulsar at the same time enables developers to realize comprehensive data streaming features on their applications. However, it requires significant development effort to establish seamless integration between the two tools, because data synchronization between different messaging systems depends on the functioning of applications. When applications stop working, the message data cannot be passed on to the other system.Our connector solves this problem by fully integrating with Pulsar’s system. There are two ways to import and export data between Pub/Sub and Pulsar. The first, is the Google Cloud Pub/Sub source that feeds data from Pub/Sub topics and writes data to Pulsar topics. Alternatively, the Google Cloud Pub/Sub sink can pull data from Pulsar topics and persist data to Pub/Sub topics. Using Google Cloud Pub/Sub Connector for Apache Pulsar brings three key advantages:Code-free integration: No code-writing is needed to move data between Apache Pulsar and Pub/Sub.High scalability: The connector can be run on both standalone and distributed nodes, which allows developers to build reactive data pipelines in real time to meet operational needs.Less DevOps resources required: The DevOps workloads of setting up data synchronization are greatly reduced, which translates into more resources to be invested in unleashing the value of data.By using the BigQuery Sink Connector for Apache Pulsar, organizations can write data from Pulsar directly to BigQuery. This is unlike before, where developers could only use Cloud Storage Sink Connector for Pulsar to move data to Cloud Storage, and then query the imported data with external tables in BigQuery which had many limitations,  including low query performance and no support for clustered tables.Pulling data from Pulsar topics and persisting data to BigQuery tables, our BigQuery sink connector supports real-time data synchronization between Apache Pulsar and BigQuery. Just like our Pub/Sub connector, Google Cloud BigQuery Sink Connector for Apache Pulsar is a low-code solution that supports high scalability and greatly reduces DevOps workloads. Furthermore, our BigQuery connector possesses the Auto Schema feature, which automatically creates and updates BigQuery table structures based on the Pulsar topic schemas to ensure smooth and continuous data synchronization.Simplifying Pulsar resource management on KubernetesAll the products of StreamNative are built on Kubernetes, and we’ve been developing tools that can simplify resource management on Kubernetes platforms like Google Cloud Kubernetes (GKE). In August 2022, we introduced Pulsar Resources Operator for Kubernetes, which is an independent controller that provides automatic full lifecycle management for Pulsar resources on Kubernetes.Pulsar Resources Operator uses manifest files to manage Pulsar resources, which allows developers to get and edit resource policies through the Topic Custom Resources that render the full field information of Pulsar policies. It enables easier Pulsar resource management compared with using command line interface (CLI) tools, because developers no longer need to remember numerous commands and flags to retrieve policy information. Key advantages of using Pulsar Resources Operator for Kubernetes include:Easy creation of Pulsar resources: By applying manifest files, developers can swiftly initialize basic Pulsar resources in their continuous integration (CI) workflows when creating a new Pulsar cluster.Full integration with Helm: Helm is widely used as a package management tool in cloud-native environments. Pulsar Resource Operator can seamlessly integrate with Helm, which allows developers to manage their Pulsar resources through Helm templates.How you can contributeWith the release of Google Cloud Pub/Sub Connector for Apache Pulsar, Google Cloud BigQuery Sink Connector for Apache Pulsar, and Pulsar Resources Operator for Kubernetes, we have unlocked the application potential of open tools like Apache Pulsar by making them simpler to build, easier to manage, and extended their capabilities. Now, developers can build and run Pulsar clusters more efficiently and maximize the value of their enterprise data. These three tools are community-driven services and have their source codes hosted in the StreamNative GitHub repository. Our team welcomes all types of contributions for the evolution of our tools. We’re always keen to receive feature requests, bug reports and documentation inquiry through GitHub, emails or Twitter.
Quelle: Google Cloud Platform

How to build comprehensive customer financial profiles with Elastic Cloud and Google Cloud

Financial institutions have vast amounts of data about their customers. However, many of them struggle to leverage data to their advantage. Data may be sitting in silos or trapped on costly mainframes. Customers may only have access to a limited quantity of data, or service providers may need to search through multiple systems of record to handle a simple customer inquiry. This creates a hazard for providers and a headache for customers. Elastic and Google Cloud enable institutions to manage this information. Powerful search tools allow data to be surfaced faster than ever – Whether it’s card payments, ACH (Automated Clearing House), wires, bank transfers, real-time payments, or another payment method. This information can be correlated to customer profiles, cash balances, merchant info, purchase history, and  other relevant information to enable the customer or business objective. This reference architecture enables these use cases:1. Offering a great customer experience: Customers expect immediate access to their entire payment history, with the ability to recognize anomalies. Not just through digital channels, but through omnichannel experiences (e.g. customer service interactions).2. Customer 360: Real-time dashboards which correlates transaction information across multiple variables, offering the business a better view into their customer base, and driving efforts for sales, marketing, and product innovation.Customer 360: The dashboard above looks at 1.2 billion bank transactions and gives a breakdown of what they are, who executes them, where they go, when and more. At a glance we can see who our wealthiest customers are, which merchants our customers send the most money to, how many unusual transactions there are – based on transaction frequency and transaction amount, when folks spend money and what kind spending and income they have.3. Partnership management: Merchant acceptance is key for payment providers. Having better access to present and historical merchant transactions can enhance relationships or provide leverage in negotiations. With that, banks can create and monetize new services.4. Cost optimization: Mainframes are not designed for internet-scale access. Along-side with technological limitation, the cost becomes a prohibitive factor. While Mainframes will not be replaced any time sooner, this architecture will help to avoid costly access to data to serve new applications.5. Risk reduction: By standardizing on the Elastic Stack, banks are  longer limited in the number of data sources they can ingest. With this, banks can better respond to call center delays and potential customer-facing impacts like natural disasters. By deploying machine learning and alerting features, banks can detect and stamp out financial fraud before it impacts member accounts.Fraud detection: The Graph feature of Elastic helped a financial services company to identify additional cards that were linked via phone numbers and amalgamations of the original billing address on file with those two cards. The team realized that several credit unions, not just the original one where the alert originated from, were being scammed by the same fraud ring.ArchitectureThe following diagram shows the steps to move data from Mainframe to Google Cloud, process and enrich the data in BigQuery, then provide comprehensive search capabilities through Elastic Cloud.This architecture includes the following components:Move Data from Mainframe to Google CloudMoving data from IBM z/OS to Google Cloud is straightforward with the Mainframe Connector, by following simple steps and defining configurations. The connector runs in z/OS batch job steps and includes a shell interpreter and JVM-based implementations of gsutil, bq and gcloud command-line utilities. This makes it possible to create and run a complete ELT pipeline from JCL, both for the initial batch data migration and ongoing delta updates.A typical flow of the connector includes:Reading the mainframe datasetTranscoding the dataset to ORCUploading ORC file to Cloud StorageRegister ORC file as an external table or load as a native tableSubmit a Query job containing a MERGE DML statement to upsert incremental data into a target table or a SELECT statement to append to or replace an existing tableHere are the steps to install the BQ MainFrame Connector:copy mainframe connector jar to unix filesystem on z/OScopy BQSH JCL procedure to a PDS on z/OSedit BQSH JCL to set site specific environment variablesPlease refer to the BQ Mainframe connector blog for example configuration and commands.Process and Enrich Data in BigQueryBigQuery is a completely serverless and cost-effective enterprise data warehouse. Its serverless architecture lets you use SQL language to query and enrich Enterprise scale data. And its scalable, distributed analysis engine lets you query terabytes in seconds and petabytes in minutes. An integrated BQML and BI Engine enables you to analyze the data and gain business insights. Ingest Data from BQ to Elastic CloudDataflow is used here to ingest data from BQ to Elastic Cloud. It’s a serverless, fast, and cost-effective stream and batch data processing service. Dataflow provides an Elasticsearch Flex Template which can be easily configured to create the streaming pipeline. This blog from Elastic shows an example on how to configure the template.Cloud Orchestration from MainframeIt’s possible to load both BigQuery and Elastic Cloud entirely from a mainframe job, with no need for an external job scheduler.To launch the Dataflow flex template directly, you can invoke the gcloud dataflow flex-template run command in a z/OS batch job step.If you require additional actions beyond simply launching the template, you can instead invoke the gcloud pubsub topics publish command in a batch job step after your BigQuery ELT steps are completed, using the –attribute option to include your BigQuery table name and any other template parameters. The pubsub message can be used to trigger any additional actions within your cloud environment.To take action in response to the pubsub message sent from your mainframe job, create a Cloud Build Pipeline with a pubsub trigger and include a Cloud Build Pipeline step that uses the gcloud builder to invoke gcloud dataflow flex-template run and launch the template using the parameters copied from the pubsub message. If you need to use a custom dataflow template rather than the public template, you can use the git builder to checkout your code followed by the maven builder to compile and launch a custom dataflow pipeline. Additional pipeline steps can be added for any other actions you require.The pubsub messages sent from your batch job can also be used to trigger a Cloud Run service or a GKE service via Eventarc and may also be consumed directly by a Dataflow pipeline or any other application.Mainframe Capacity PlanningCPU consumption is a major factor in mainframe workload cost. In the basic architecture design above, the Mainframe Connector runs on the JVM and runs on zIIP processor. Relative to simply uploading data to cloud storage, ORC encoding consumes much more CPU time. When processing large amounts of data it’s possible to exhaust zIIP capacity and spill workloads onto GP processors. You may apply the following advanced architecture to reduce CPU consumption and avoid increased z/OS processing costs.Remote Dataset Transcoding on Compute Engine VMTo reduce mainframe CPU consumption, ORC file transcoding can be delegated to a GCE instance. A gRPC service is included with the mainframe connector specifically for this purpose. Instructions for setup can be found in the mainframe connector documentation. Using remote ORC transcoding will significantly reduce CPU usage of the Mainframe Connector batch jobs and is recommended for all production level BigQuery workloads. Multiple instances of the gRPC service can be deployed behind a load balancer and shared by all Mainframe Connector batch jobs.Transfer Data via FICON and InterconnectGoogle Cloud technology partners offer products to enable transfer of mainframe datasets via FICON and 10G ethernet to Cloud Storage. Obtaining a hardware FICON appliance and Interconnect is a practical requirement for workloads that transfer in excess of 500GB daily. This architecture is ideal for integration of z/OS and Google Cloud because it largely eliminates data transfer related CPU utilization concerns.We really appreciate Jason Mar from Google Cloud who provided rich context and technical guidance regarding the Mainframe Connector, and Eric Lowry from Elastic for his suggestions and recommendations, and the Google Cloud and Elastic team members who contributed to this collaboration.
Quelle: Google Cloud Platform

Google’s Virtual Desktop of the Future

Did you know that most Google employees rely on virtual desktops to get their work done? This represents a paradigm shift in client computing at Google, and was especially critical during the pandemic and the remote work revolution. We’re excited to continue enabling our employees to be productive, anywhere! This post covers the history of virtual desktops and details the numerous benefits Google has seen from their implementation. BackgroundIn 2018, Google began the development of virtual desktops in the cloud. A whitepaper was published detailing how virtual desktops were created with Google Cloud, running on Google Compute Engine, as an alternative to physical workstations. Further research had shown that it was feasible to move our physical workstation fleet to these virtual desktops in the cloud. The research began with user experience analysis – looking into how employee satisfaction of cloud workstations compared with physical desktops. Researchers found that user satisfaction of cloud desktops was higher than that of their physical desktop counterparts! This was a monumental moment for cloud-based client computing at Google, and this discovery led to additional analyses of Compute Engine to understand if it could become our preferred (virtual) workstation platform of the future.Today, Google’s internal use of virtual desktops has increased dramatically. Employees all over the globe use a mix of virtual Linux and Windows desktops on Compute Engine to complete their work. Whether an employee is writing code, accessing production systems, troubleshooting issues, or driving productivity initiatives, virtual desktops are providing them with the compute they need to get their work done. Access to virtual desktops is simple: some employees access their virtual desktop instances via Secure Shell (SSH), while others use Chrome Remote Desktop — a graphical access tool. In addition to simplicity and accessibility, Google has realized a number of benefits from virtual desktops. We’ve seen an enhanced security posture, a boost to our sustainability initiatives, and a reduction in maintenance effort associated with our IT infrastructure. All these improvements were achieved while improving the user experience compared to our physical workstation fleet.Example of Google Data CenterAnalyzing Cloud vs Physical DesktopsLet’s look deeper into the analysis Google performed to compare cloud virtual desktops and physical desktops. Researchers compared cloud and physical desktops on five core pillars: user experience, performance, sustainability, security, and efficiency.User ExperienceBefore the transition to virtual desktops got underway, user experience researchers wanted to know more about how they would affect employee happiness. They discovered that employees embraced the benefits that virtual desktops offered. This included freeing up valuable desk space to provide an always-on, always available compute experience, accessible from anywhere in the world, and reduced maintenance overhead compared to physical desktops. PerformanceFrom a performance perspective, cloud desktops are simply better than physical desktops. For example, running on Compute Engine makes it easy to spin-up on-demand virtual instances with predictable compute and performance – a task that is significantly more difficult with a physical workstation vendor. Virtual desktops rely on a mix of Virtual Machine (VM) families that Google developed based on the performance needs of our users. These include Google Compute EngineE2 high-efficiency instances, which employees might use for day-to-day tasks, to higher-performance N2/N2D instances, which employees might use for more demanding machine learning jobs. Compute Engine offers a VM shape for practically any computing workflow. Additionally, employees no longer have to worry about machine upgrades (to increase performance, for example) because our entire fleet of virtual desktops can be upgraded to new shapes (with more CPU and RAM) with a single config change and a simple reboot — all within a matter of minutes. Plus, Compute Engine continues to add features and new machine types, which means our capabilities only continue to grow in this space.SustainabilityGoogle cares deeply about sustainability and has been carbon neutral since 2007. Moving from physical desktops to virtual desktops on Compute Engine brings us closer to Google sustainability goals of a net-neutral desktop computing fleet. Our internal facilities team has praised virtual desktops as a win for future workspace planning, because a reduction in physical workstations could also mean a reduction in first-time construction costs of new buildings, significant (up to 30%) campus energy reductions, and even further reductions in costs associated with HVAC needs and circuit size needs at our campuses. Lastly, a reduction in physical workstations also contributes to a reduction in physical e-waste and a reduction in the carbon associated with transporting workstations from their factory of origin to office locations. At Google’s scale, these changes lead to an immense win from a sustainability standpoint. SecurityBy their very nature, virtual desktops mitigate the ability for a bad actor to exfiltrate data or otherwise compromise physical desktop hardware since there is no desktop hardware to compromise in the first place. This means attacks such as USB attacks, evil maid attacks, and similar techniques for subverting security that require direct hardware access become worries of the past. Additionally, the transition to cloud-based virtual desktops also brings with it an enhanced security posture through the use of Google Cloud’s myriad security features including Confidential Computing, vTPMs, and more. EfficiencyIn the past, it was not uncommon for employees to spend days waiting for IT to deliver new machines or fix physical workstations. Today, cloud-based desktops can be created instantaneously on-demand and resized on-demand. They are always accessible, and virtually immune from maintenance-related issues. IT no longer has to deal with concerns like warranty claims, break-fix issues, or recycling. This time savings enables IT to focus on higher priority initiatives all while reducing their workload. With an enterprise the size of Google, these efficiency wins added up quickly. Considerations to Keep in MindAlthough Google has seen significant benefits with virtual desktops, there are some considerations to keep in mind before deciding if they are right for your enterprise. First, it’s important to recognize that migrating to a virtual fleet requires a consistently reliable and performant client internet connection. For remote/global employees, it’s important they’re located geographically near a Google Cloud Region (to minimize latency). Additionally, there are cases where physical workstations are still considered vital. These cases include users who need USB and other direct I/O access for testing/debugging hardware and users who have ultra low-latency graphics/video editing or CAD simulation needs. Finally, to ensure interoperability between these virtual desktops and the rest of our computing fleet, we did have to perform some additional engineering tasks to integrate our asset management and other IT systems with the virtual desktops. Whether your enterprise needs such features and integration should be carefully analyzed before considering a solution such as this. However, should you ultimately conclude that cloud-based desktops are the solution for your enterprise, we’re confident you’ll realize many of the benefits we have!Tying It All TogetherAlthough moving Google employees to virtual desktops in the clouds was a significant engineering undertaking, the benefits have been just as significant.  Making this switch has boosted employee productivity and satisfaction, enhanced security, increased efficiency, and provided noticeable improvements in performance and user experience. In short, cloud-based desktops are helping us transform how Googlers get their work done. During the pandemic, we saw the benefits of virtual desktops in a critical time. Employees had access to their virtual desktop from anywhere in the world, which kept our workforce safer and reduced transmission vectors for COVID-19. We’re excited for a future where more and more of our employees are computing in the cloud as we continue to embrace the work-from-anywhere model and as we continue to add new features and enhanced capabilities to Compute Engine!
Quelle: Google Cloud Platform

How partners can maximize their 2023 opportunity with the transformation cloud

The excitement at Next ‘22 this year was inescapable.  We celebrated a number of exciting announcements and wins that show where the cloud is heading, and what that means for our partners and customers.  As we close out 2022 and finalize our plans for 2023, I wanted to provide a perspective on the most important partner developments from the event to help you hit the ground running next year.Google Cloud’s transformation cloud was front and center throughout our entire event. This powerful technology platform is designed to accelerate digital transformation for any organization by bringing five business-critical capabilities to our shared customers:The ability to build open data clouds to derive insights and intelligence from data.Open infrastructure that enables customers to run applications and store data where it makes the most sense.A culture of collaboration built on Google Workspace that brings people together to connect and create from anywhere, enabling teams to achieve more.The same trusted environment that Google uses to secure systems, data, apps, and customers from fraudulent activity, spam, and abuse.And a foundational platform that uses efficient technology and innovation to drive cost savings and create a more sustainable future for everyone.More than just vision, the transformation cloud is delivering results today. British fashion retailer Mulberry and partner Datatonic have built data clouds to drive a 25% increase in online sales. Vodafone in EMEA is working with our partner Accenture to migrate and modernize its entire infrastructure.  Hackensack Meridian Health in New Jersey is working with partner Citrix to leverage our infrastructure and Google Workspace to modernize its systems, enable collaboration, reduce costs, bolster security, and provide better patient and practitioner experiences. Many more transformation stories are available here and in our partner directory.For our partners, the transformation cloud is your customer satisfaction engine. It enables you to bring new capabilities to market that customers cannot get anywhere else – from overcoming challenges around organizational management, to demand forecasting, supply-chain visibility, and more – all of this is possible only with the capability of our Data, AI/ML, collaboration and security tools.Thomas Kurian and Kevin Ichhpurani provided excellent insight and guidance for partners looking to begin, or accelerate, their journey with the transformation cloud in their Next ‘22 partner keynote. Briefly, here are the three steps partners can take now to set themselves up for success in 2023:Customers expect you to be deeply specialized in cloud solutions and their business Customers have made it clear they expect to work with partners who are deeply knowledgeable about the technology solutions and foundational elements of the transformation cloud. Just as important, it’s no longer good enough for partners to offer a small group of highly trained individuals to do it all. Customers need deep cloud expertise within specific business functions and even within global regions. They need people who know how to leverage our cloud solutions to achieve great outcomes for finance departments, human resources, customer service, operations, and more. And more than that, customers need people who are also experts at driving these kinds of transformations within regional environments defined by unique policies, compliance requirements, and even cultural issues. This is a tall order, but it’s absolutely critical to your growth and success. This is why Google Cloud is investing in the tools, training, and support you need to expand your bench of trained and certified individuals.Second, increase your focus on consumption and service delivery to land and expand opportunities.The demand here is significant and growing. In its 2022 Global IT Market Outlook, analyst firm Canalys stated that partner-delivered IT products and services will account for more than 73% of the total global IT market this year and into next year (about even with its 2021 forecast, which suggests that services remain in high demand). This includes managed services such as cloud infrastructure and software services, managed databases, managed data warehouses, managed analytic tools, and more. These are high-margin endeavors for partners. Equally important, these kinds of services allow your customers to shift their people from managing technology to managing and growing the business.As Thomas Kurian said during his Next ‘22 remarks, Google Cloud is not in the services business–that’s the domain of our partners. We are a product and technology company. This is why we have a partner-led service delivery commitment, and a goal of bring partners into 100% of customer engagements. Third, we are investing to help Google Cloud partners drive consumption and new business. We know you are focused on growing your customer engagements and accelerating customers’ time to value. We’re here to support you:Our Smart Analytics platform is a key market differentiator that enables partners to tap into the fast growing Data & Analytics market, which is expected to hit $500B by 2024.1We are investing $10 billion in cybersecurity and our recent acquisition of Mandiant extends our leadership in this area by combining offense and defense in powerful new ways.Governments worldwide are looking for sovereign cloud solutions to meet their security, privacy, and digital sovereignty requirements. Google Cloud has a highly differentiated solution in this area, and partnerships are critical. We are driving to validate all of our ISV partner solutions through our Cloud Ready – Sovereign Solutions initiative.We are providing increasing resources and support to help partners embed the capabilities of Google Workspace in their solutions.We continue to allow customers to buy partner solutions and decrement their commits just like with Google Cloud products.You’ll see more from us on all of this in kick off 2023. The opportunity to prosper – Google, partners, and customers alike – is tremendous. I’ve never been more excited about the year ahead.1. IDC Forecast Companies to spend 342 B on AI Solutions in 2021Related ArticleWhat’s next for digital transformation in the cloudGoogle Cloud ’Next 22 is here! Check out the official kickoff blog and hear from our CEO, Thomas Kurian, on new customer wins, partnershi…Read Article
Quelle: Google Cloud Platform

Data: the Rx to faster, patient-centric clinical trials

Out of necessity, the life sciences industry has accelerated the innovation and experimentation of drug and device development. The sector, which has traditionally been slow-moving when it comes to clinical trials—for reasons ranging from regulatory, to trial recruitment, to quality control—is now looking towards cloud technology to speed up the process and find new innovative ways to support R&D. With the shift towards patient-centric care delivery and the rapid growth of health data, the case for faster digitization in life sciences has never been stronger. However, there are still a few obstacles to overcome.Innovation roadblocksThe time and costs involved in clinical trials are enormous. The average clinical trial across therapeutic areas come out to:1With these barriers to having a new drug or device approved, it’s no surprise that more than 1 in 5 clinical trials fail due to a lack of funding.2These clinical trials are also subject to stringent regulatory requirements, and the organizations conducting the study often lack efficient and secure ways to collect, store, and analyze data across trial sites. At the same time, siloed data and poor collaboration across sites make it harder to find valuable insights that could influence and accelerate outcomes.The public will likely now greet life sciences companies with less patience for decade-long drug development cycles and more demands for retail-like transparency. Because the pharmaceutical industry needs to update its processes, meeting these expectations won’t be as simple as replicating the COVID-19 vaccine model. How, then, might the industry accelerate bringing new life saving treatments to the market safely and more quickly without a public emergency? Pharma companies now have to find new and innovative ways to conduct R&D more efficiently and drive products to market faster and more efficiently.Google Cloud is empowering scientists throughout the drug discovery pipeline from target identification, to target validation, to lead identification. By combining the power of AlphaFold and Vertex AI, we are able to significantly decrease the time to process protein engineering and de-novo protein design. The value for researchers is immense and leads to: optimized compute resource time, maximized throughput, enhanced and comprehensive trackability and reproducibility. In short, we are enabling life sciences organizations to increase the velocity of protein design and engineering to revolutionize biochemical research and drug discovery.Accelerate your clinical trials in the cloudGoogle Cloud accelerates drug and device development by revolutionizing data collection, storage, and analysis to deliver life-saving treatments faster. It reduces enrollment cycle times through the expansion of clinical trial sites, research data management solutions, and Google’s cross-site collaboration solutions, includingLowering the time and cost of clinical trials.Complying with changing global regulations. Delivering seamless communication across trial sites.Increase patient participation.How Moderna boosted discovery with dataAmerican pharmaceutical company, Moderna, needed an easier and faster way to access actionable insights. Data analysis required significant manual work and led to data silos across the organization.Moderna decided to use Google Cloud for its multi-cloud data strategy and Looker for a more holistic view of its clinical trials. By integrating internal and external data sets, the company:Gained a more complete view of clinical trials.Increased scientific efficiency and collaboration.Was able to make real-time decisions to ensure trial quality.“Looker fits well with our multi-cloud philosophy because we can choose our preferred database and leverage integrations to make our data accessible and actionable.”—Dave Johnson, VP of Informatics, Data Science, and AI at ModernaTechnology can be the enabler the industry needs in the effort to meet expectations for faster and better therapies for patients while keeping the process cost-effective for drug and device makers.1. How much does a clinical trial cost?2. National Library of Medicineaside_block[StructValue([(u’title’, u’How real-world data and analytics help accelerate clinical trials’), (u’body’, <wagtail.wagtailcore.rich_text.RichText object at 0x3ed9fe0c6590>), (u’btn_text’, u’Read more on Transform with Google Cloud’), (u’href’, u’https://cloud.google.com/blog/transform/real-world-data-platform-accelerates-clinical-trails-life-sciences-healthcare-clinica’), (u’image’, None)])]
Quelle: Google Cloud Platform

Performance considerations for loading data into BigQuery

Customers have been using BigQuery for their data warehousing needs since it was introduced. Many of these  customers routinely load very large data sets into their Enterprise Data Warehouse. Whether one is doing an initial data ingestion with hundreds of TB of data or incrementally loading from systems of record, performance of bulk inserts is key to quicker insights from the data. The most common architecture for batch data loads uses Google Cloud Storage(Object storage) as the staging area for all bulk loads. All the different file formats are converted into an optimized Columnar format called ‘Capacitor’ inside BigQuery.This blog will focus on various file types for best performance. Data files that are uploaded to BigQuery, typically come in Comma Separated Values(CSV), AVRO, PARQUET, JSON, ORC formats. We are going to use two large datasets to compare and contrast each of these file formats. We will explore loading efficiencies of compressed vs. uncompressed data for each of these file formats. Data can be loaded into BigQuery using multiple tools in the GCP ecosystem. You can use the Google Cloud console, bq load command, using the BigQuery API or using the client libraries. This blog attempts to elucidate the various options for bulk data loading into BigQuery and also provides data on the performance for each file-type and loading mechanism.IntroductionThere are various factors you need to consider when loading data into BigQuery. Data file formatData compressionLevel of parallelization of data loadSchema autodetect ‘ON’ or ‘OFF’Wide tables vs narrow(fewer columns) tables.Data file formatBulk insert into BigQuery is the fastest way to insert data for speed and cost efficiency. Streaming inserts are however more efficient when you need to report on the data immediately. Today data files come in many different file types including Comma Separated(CSV), JSON, PARQUET, AVRO  to name a few. We are often asked how the file format matters and whether there are any advantages in choosing one file format over the other. CSV files (comma-separated values) contain tabular data with a header row naming the columns. When loading data one can parse the header for column names. When loading from csv files one can use the header row for schema autodetect to pick up the columns. With schema autodetect set to off, one can skip the header row and create a schema manually, using the column names in the header. CSV files can use other field separators(like ; or |) too as a separator, since many data outputs already have a comma in the data. You cannot store nested or repeated data in CSV file format.JSON (JavaScript object notation) data is stored as a key-value pair in a semi structured format. JSON is preferred as a file type because it can store data in a hierarchical format. The schemaless nature of JSON data rows gives the flexibility to evolve the schema and thus change the payload. JSON formats are user-readable. REST-based web services use json over other file types.PARQUET is a column-oriented data file format designed for efficient storage and retrieval of data.  PARQUET compression and encoding is very efficient and provides improved performance to handle complex data in bulk.AVRO: The data is stored in a binary format and the schema is stored in JSON format. This helps in minimizing the file size and maximizes efficiency. From a data loading perspective we did various tests with millions to hundreds of billions of rows with narrow to wide column data .We have done this test with a public dataset named `bigquery-public-data.samples.github_timeline` and `bigquery-public-data.wikipedia.pageviews_2022`. We used 1000 flex slots for the test and the number of loading(called PIPELINE slots) slots is limited to the number of slots you have allocated for your environment. Schema Autodetection was set to ‘NO’. For the parallelization of the data files, each file should typically be less than 256MB uncompressed for faster throughput and here is a summary of our findings:Do I compress the data? Sometimes batch files are compressed for faster network transfers to the cloud. Especially for large data files that are being transferred, it is faster to compress the data before sending over the cloud Interconnect or VPN connection. In such cases is it better to uncompress the data before loading into BigQuery? Here are the tests we did for various file types with different file sizes with different compression algorithms. Shown results are the average of five runs:How do I load the data?There are various ways to load the data into BigQuery. You can use the Google Cloud Console, command line, Client Library or use the REST API. As all these load types invoke the same API under the hood so there is no advantage of picking one way over the other. We used 1000 PIPELINE slots reservations, for doing the data loads shown above. For workloads that require predictable load times, it is imperative that one uses PIPELINE slot reservations, so that load jobs are not dependent on the vagaries of available slots in the default pool. In the real world many of our customers have multiple load jobs happening concurrently. In those cases, assigning PIPELINE slots to individual jobs has to be done carefully keeping a balance between load times and slot efficiency.Conclusion: There is no distinct advantage in loading time when the source file is in compressed format for the tests that we did. In fact for the most part uncompressed data loads in the same or faster time than compressed data. For all file types including AVRO, PARQUET and JSON it takes longer to load the data when the file is compressed. Decompression is a CPU bound activity and your mileage varies based on the amount of PIPELINE slots assigned to your load job. Data loading slots(PIPELINE slots) are different from the data querying slots. For compressed files, you should parallelize the load operation, so as to make sure that data loads are efficient. Split the data files to 256MB or less to speed up the parallelization of the data load.From a performance perspective AVRO and PARQUET files have similar load times. Fixing your schema does load the data faster than schema autodetect set to ‘ON’. Regarding ETL jobs, it is faster and simpler to do your transformation inside BigQuery using SQL, but if you have complex transformation needs that cannot be done with SQL, use Dataflow for unified batch and streaming, Dataproc for streaming based pipelines, or Cloud Data Fusion for no-code / low-code transformation needs. Wherever possible, avoid implicit/explicit data types conversions for faster load times. Please also refer to Bigquery documentation for details on data loading to BigQuery.To learn more about how Google BigQuery can help your enterprise, try out Quickstarts page hereDisclaimer: These tests were done with limited resources for BigQuery in a test environment during different times of the day with noisy neighbors, so the actual timings and the number of rows might not be reflective of your test results. The numbers provided here are for comparison sake only, so that you can choose the right file types, compression for your workload.  This testing was done with two tables, one with 199 columns (wide table) and another with 4 columns (narrow table). Your results will vary based on the datatypes, number of columns, amount of data, assignment of PIPELINE slots and various file types. We recommend that you test with your own data before coming to any conclusion.Related ArticleLearn how BI Engine enhances BigQuery query performanceThis blog explains how BI Engine enhances BigQuery query performance, different modes in BI engine and its monitoring.Read Article
Quelle: Google Cloud Platform