Open the possibilities of your data

First software ate the world. Now Artificial Intelligence (AI) is eating software. 

You’ve heard all the adages. Something about every company being a data company. Data being the most valuable assets. A competitive differentiator, the corporate pundits call it. A game changer, even.
Quelle: CloudForms

How Red Hat is helping drive telco’s RAN revolution

As 5G begins to weave its way into every industry across the globe, service providers are under more pressure than ever to evolve and scale with increased efficiency. At the heart of this transformation lies cloud-native, open source innovation that helps form the foundation for future connectivity from the core, all the way out to the edge – leveraging a ubiquitous, secure, common infrastructure platform. 
Quelle: CloudForms

Announcing new features for Cloud Monitoring's Grafana plugin

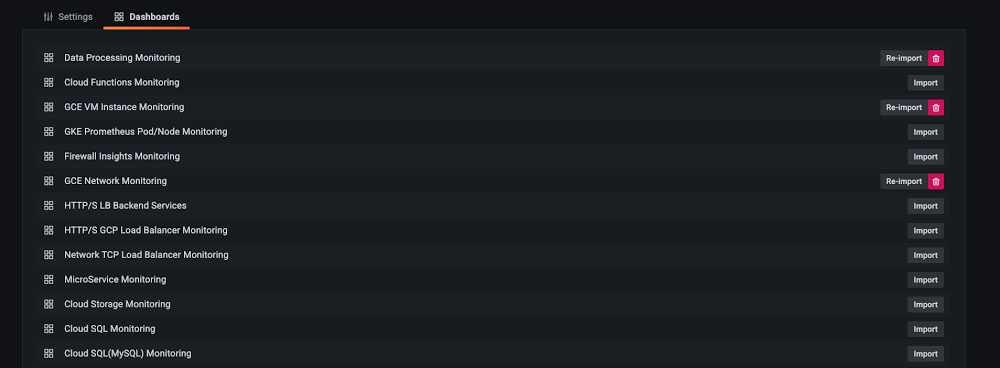
The observability of metrics is a key factor for a successful operations team, allowing for increasingly effective visualizations, analysis, and troubleshooting. Google Cloud works with third-party partners, such as Grafana Labs, to make it easy for customers to create their desired observability stack leveraging a combination of different tools. More than two years ago, we collaborated with Grafana Labs to introduce the Cloud Monitoring plugin for Grafana. Since then, we’ve continued collaborating with Grafana to make lots of improvements to the experience.As part of this collaborative effort, we’re excited to announce new features such as popular dashboard samples, more effective troubleshooting with deep links, better visualizations through precalculated metrics, and more powerful analysis capabilities. Let’s take a closer look at each of the new features:1. Sample dashboards for Google Cloud servicesIt’s always easier to modify than creating from scratch! We introduced the 15 most popular sample dashboards from Google Cloud Monitoring dashboard samples library on github and converted these dashboards into a Grafana-compatible format. They are ready to install from Grafana in just one click. With this sample library, you can easily import a sample, apply it to a test project, edit it and save it as needed.2. Deep link to Google Cloud Monitoring metrics explorerSometimes you need to switch between your Grafana interface and the Google Cloud Console for troubleshooting. When that happens, it’s easy to lose context, and it can be hard to locate your time-series data. We introduced deep linking to Cloud Monitoring metrics explorer on Grafana’s chart to help. You can easily log into the Cloud Console through deep linking and land right on the time series that you want to investigate.3. Improved query interface that aligns with new dashboard creation flowLast year, Cloud Monitoring got an improved dashboard creation flow, including a new way to preprocess delta and cumulative metrics kinds. You now have options to  preprocess delta metrics by their rate, and you can also select to view cumulative metrics either as rate or as delta.With these options you can choose to visualize your data by its original format or in a format that is easily transformed into a rate or a change in value.4. New Monitoring Query Language (MQL) interfaceCloud Monitoring’s MQL became generally available last year, making it easier to perform advanced calculations. We also enabled the MQL editor on the Grafana plugin so you can run your existing MQL query from the Grafana interface directly.Get Started TodayIf you use both Grafana and Google Cloud, you can get started adding Google Cloud Monitoring as a data source for your Grafana dashboards. We look forward to hearing from you about what other features you would like to see so please join us in our discussion forum to ask questions or provide feedback.Related ArticleIntroducing Stackdriver as a data source for GrafanaIt is not uncommon to have multiple monitoring solutions for IT infrastructure these days as distributed architectures take hold for many…Read Article
Quelle: Google Cloud Platform

How HBO Max uses reCAPTCHA Enterprise to make its customer experience frictionless

Editor’s note: Randy Gingeleski, Senior Staff Security Engineer for HBO Max and Brian Lozada, CISO for HBO Max, co-authored this blog to share their experiences with reCAPTCHA Enterprise and help other enterprises achieve the same level of security for their customer experiences.  The COVID-19 pandemic gave audiences more time than ever to explore all the content hosted on HBO Max, and dramatically increased the demand for quick and reliable streaming. To support this demand, we made huge investments in our customer experience tools and digital experiences to continue bringing our customers the latest content while curating a best-in-class experience. But as the demand for our services increased, so did our attack surface. We were part of the 65% of enterprisesthat noticed an increase in online attacks last year. Attackers tried to throw anything and everything our way, ranging from using leaked credentials to log in to accounts, to entering fake promotion codes, to using stolen credit card information on the payments page. As we evaluated our approach to protect against web-based attacks, we set out to build a security strategy that would keep the customer’s experience at the core of everything that we did. At HBO Max, we believe that security should be usable for our security team and invisible to our end users. One of the tactics we use to achieve that goal isreCAPTCHA Enterprise, a frictionless bot management solution that stops fraudsters while allowing customers to use our services. Today, we’re going to share how we use reCAPTCHA Enterprise to create a frictionless experience for our customers, empower our security team, and further grow our business.Like most businesses with a website and mobile application, we have multiple web pages that get targeted by human and automated actors. The web pages that come under the largest and most frequent attacks are the web pages involved in helping a customer purchase an HBO Max membership. We noticed attackers trying to use stolen credit card information or repeatedly reentering the same credit card information on our payments page. We also noticed attackers trying to use current and expired coupon codes over and over again on the payment page. We chose reCAPTCHA Enterprise because we wanted a proven product that can protect against credential stuffing, coupon fraud, and other fraudulent attacks while providing a frictionless customer experience. Google has over a decade of experience defending the internet and data for its network of more than 5 million sites, and this experience is what reCAPTCHA Enterprise is built on, which gave us faith it could work for us. A significant portion of our user base does not have to sign up for HBO Max because they are already customers of Hulu, AT&T, or another partner company. For brand new customers, they need to sign up, create an account, and login at HBO Max directly. When securing the signup system for these customers, we had to balance the needs of several of our internal stakeholders. Our customer experience team needed a security product that would not apply friction to the customer journeys they build and optimize to make it as easy as possible to sign up for HBO Max. Our marketing team needed a security product that would not stop them from engaging and connecting directly with potential customers. And our product team wanted customers to be able to safely browse and stream content. Our signup flow had to meet the needs of all our stakeholders while providing advanced security to our website. The legacy approach of checking boxes, clicking images, or making our customers engage in some kind of challenge felt like an outdated and cheap approach. With reCAPTCHA Enterprise, we eliminated the burden on the audience, as it secures the signup flow without requiring humans to engage in any kind of challenge. It’s a win for everyone. Internal stakeholders can create customer-centric experiences, and customers can easily use our services. And it’s even resulted in customer preference for our services over our competitors’ that use security products that require more effort. reCAPTCHA Enterprise comes with many features, including mobile application SDK support and an Annotation API for model tuning, that help our security team determine if an interaction with our website is from a human or bot.We use risk scores in reCAPTCHA Enterprise to determine if an interaction is going to impact legitimate customers and our business. reCAPTCHA Enterprise gives us 11 scores between 0 and 1, with scores closer to 0 like 0.1 and 0.3 being high risk or highly fraudulent and scores like 0.7 and 0.9 being low risk and likely a human. We review our risk scores with an analysis of our web and network traffic and customer’s usernames and account IDs. Together, all this information helps us set a risk threshold for our website, where we do not let interactions with a low score engage with the site. We also use reCAPTCHA Enterprise’s Annotation API to tune the web risk analysis to our website’s preferences, such as not letting an interaction with a low score proceed on our webpages. So far, we’ve had no issues with our threshold, and legitimate customers have been able to engage with our website.In addition to using reCAPTCHA Enterprise’s risk scores, we also use its reason codes to help us interpret interactions with our website. Reason codes are how reCAPTCHA Enterprise assigns a risk score to an interaction. They tell us things like if an interaction was automated or is not following normal patterns. The reason codes give us confidence, accuracy, and a starting point to determine what went wrong in an interaction. From there, we also look at logs and how quickly a user moved through different actions.reCAPTCHA Enterprise has not only made a difference to our customers and our security team, but also to our business. By protecting some of our most vulnerable pages, such as the account creation, login, promotion code page, or payment page, we’ve seen a dramatic decrease in brute force and credential stuffing attacks. We also replaced our legacy software that was used to protect gift cards with reCAPTCHA Enterprise, and we noticed a considerable decrease in token-cracking fraud. Due to the number of locations HBO Max accounts can be created, including smart TVs, phones, and computers, our website receives billions of requests per day. reCAPTCHA Enterprise has made it easy for us to determine which of those requests are from our customers and which ones are fraudulent and therefore grow our customer base and revenue. Because of its frictionless experience for our customers and usability for our security team, we highly encourage other enterprises who are looking to secure their customer experience to start with reCAPTCHA Enterprise today. We strongly encourage any enterprise with a web application or mobile application to use reCAPTCHA Enterprise to protect against online fraud and abuse and preserve your customer experience.
Quelle: Google Cloud Platform

Latest Transfer Appliance enables fast, simple and secure data movement

Overseeing a cloud migration is a tough job, but moving your actual data there doesn’t have to be. Today, we are pleased to announce the availability of our latest Transfer Appliance for the US, EU and Singapore regions, providing a simple, secure, cost-effective and offline way to transfer petabytes of data from data centers and field locations into Google Cloud.With Transfer Appliance, you get secure, high-performance data transfer in a tamper-resistant, ruggedized design. All-SSD storage lets you write data fast, while support for CMEK (Customer Managed Encryption Keys) and AES 256 encryption protects data while it is in flight, and helps you comply with industry-specific regulations (ISO, SOC, PCI & HIPAA).Every day, customers are choosing to move their data to Google Cloud and take advantage of our fully-managed, globally available Cloud Storage. Cloud Storage is built by Google engineers and gives you the same reliability and performance as the storage used by Google’s most popular products like Youtube and Workspace. Getting your data into Cloud Storage is just the beginning. Once your data is stored in Cloud Storage, you can easily connect to powerful data analytics products like BigQuery, or derive intelligence from your data with products like the recently launched Vertex AI platform.Transfer Appliance use casesWhether you have slow or unreliable connectivity, or can’t afford to disrupt your network, moving large quantities of data can be a notoriously fraught process. For customers with limited network bandwidth or connectivity, transferring large amounts of data over your network can monopolize your connection for a long time, impacting production systems’ performance for days or weeks on end in the case of larger transfers. Because you copy your data onto Transfer Appliance and then ship it,  you can move your data to Google Cloud without disrupting regular business operations. Another great use case for the Transfer Appliance is customers with remote or mobile locations, like ships or other field environments. Collect data locally, and once at the dock or port, simply ship the data to Google Cloud for processing or archiving.Google Cloud customer ADT provides residential, small business and commercial security, fire protection, and monitoring services to their customers. As ADT grew, it became clear that valuable data was being duplicated across systems and teams. Optimizing accessibility to this data presented an opportunity to extract better insights and do it more efficiently. To make their data more accessible they decided to migrate their Oracle and Hadoop instances to Cloud Storage and use BigQuery for their data warehouse. But when it came time to move, they realized that transferring the data over their VPN posed some challenges. Daniel Marolt, Senior Manager of Information at ADT says, “it quickly became clear our VPN connection would not be the most effective method to transfer our data out of our data center. We needed some way to get hundreds of terabytes of data to cloud quickly and cost-effectively, without disrupting regular business operations. Google’s Transfer Appliance allowed us to get our data into Google Cloud securely, quickly and easily. We received the appliance, uploaded our data directly from our data center, shipped it back, and days later our data lake was available in Cloud Storage.”How Transfer Appliance works Using Transfer Appliance starts with submitting an order from the Google Cloud Console. Then, to prepare for the transfer, specify the destination Cloud Storage bucket and KMS key for encryption. Google Cloud validates the data-source location’s needs such as power and space, racks or shelves to place appliances. Then the appropriate appliance and cables are shipped to meet your requirements. Once the appliance is on site and ready to connect to your network, you simply mount the NFS share exposed by the appliance and copy the data. Then, once all the data copy operations are completed, seal the appliance for shipping; this finalization step protects the appliance and your data from tampering in transit.Back at a Google Cloud processing facility, we attest to the integrity of the appliance, and move the data securely into the destination bucket. We inform you of the successful completion of the transfer session as soon as these operations are done. This typically takes 1 to 2 weeks to complete depending on which Transfer Appliance you selected.You can ship Transfer Appliances to multiple locations in parallel in capacities of 40TB and 300TB, depending on your needs. Your local network limits the number of appliances you can effectively use at a location, and the available transfer capacity of your source data systems. If you have recurring data transfer needs, you can also rent multiple appliances in stages, to ensure your data collection operations can move data at a steady pace. Get started todayGoogle Cloud’s suite oftransfer offerings are designed to make it easy to move your data from other clouds, on-premises or between Google Cloud regions. However, in some scenarios, you may not have the connectivity to get your data to where it needs to go—that’s where the transfer appliance can help. Read more about Transfer Appliance or order one from your Cloud Console today.Related ArticleHow to transfer your data to Google CloudYou’ve decided to migrate your data to the Google Cloud but where should you begin? What are the Google Cloud data transfer services avai…Read Article
Quelle: Google Cloud Platform

Build a platform with KRM: Part 3 – Simplifying Kubernetes app development

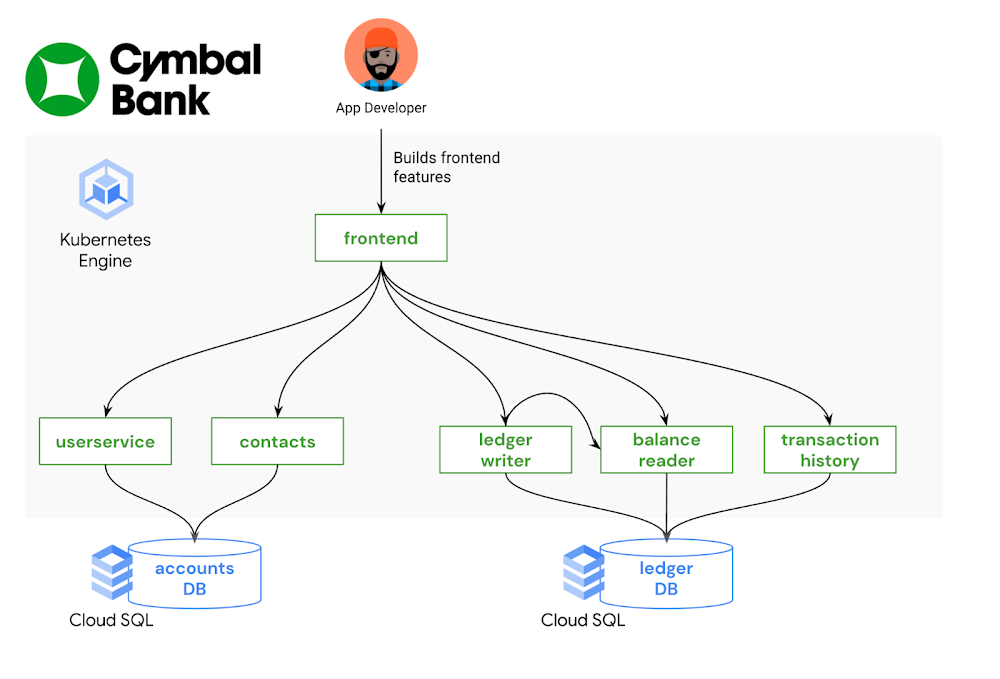
This is part 3 in a multi-part series about the Kubernetes Resource Model. See parts 1 and 2 to learn more. In the last post, we explored how Kubernetes and its declarative resource model can provide a solid platform foundation. But while the Kubernetes Resource Model is powerful, it can also be overwhelming to learn: there are dozens of core Kubernetes API resources, from Deployments and StatefulSets, to ConfigMaps and Services.  And each one has its own functionality, fields, and syntax. It’s possible that some teams in your organization do need to learn about the whole Kubernetes developer surface, such as the teams building platform integrations. But other teams, such as application developers, most likely do not need to learn everything about Kubernetes in order to become productive. With the right abstractions, developers can interact with a Kubernetes platform more easily, resulting in less toil and speedier feature development. What is a platform abstraction? It’s a way of hiding details, leaving behind only the necessary functionality. By taking certain details away, abstractions open up new possibilities, allowing you to create concepts and objects that make sense for your organization. For instance, you may want to combine all the Kubernetes resources for one service into one “application” concept, or combine multiple Kubernetes clusters into one “environment.” There are lots of ways to abstract a Kubernetes platform, from custom UIs, to command-line tools, to IDE integrations. Your organization’s abstraction needs will depend on how much of Kubernetes you want to expose developers to – it’s often a tradeoff between ease of use and flexibility. It will also depend on the engineering resources you have available to devote to setting up (and maintaining) these abstractions; not every organization has an in-house platform team. So where to start? If you’re already shipping code to a Kubernetes environment, one way to brainstorm abstractions is by examining your existing software development lifecycle. Talk to the app developers in your org: how do they interact with the platform? How do they test and stage their code? How do they work with Kubernetes configuration? What are their pain points? From here, you can explore the vast cloud-native landscape with a set of concrete problems in mind. This post demonstrates one end-to-end development workflow using a set of friendly Kubernetes tools.Bootstrapping developers with kustomizeImagine you’re a new frontend developer at Cymbal Bank. Your job is to build and maintain the public web application where customers can create bank accounts and perform transactions. Most of your day-to-day work involves changing or adding features to the Python and HTML frontend, testing those features, and creating pull requests in the source code repository. You’re not very familiar with Kubernetes, having used a different platform in your previous role, but you’re told that you have a development GKE cluster to work with. Now what?An application developer’s focus, ideally, is on source code – not on the underlying infrastructure. Let’s introduce an abstraction that allows the app developer to test their code in development, without having to write or edit any Kubenetes resource files. An open-source tool called kustomize can help with this. kustomize allows you to “customize” groups of Kubernetes resources, making it easier to maintain different flavors of your configuration, without duplicating resource manifests. The two core kustomize concepts are bases and overlays. A base is a directory containing one or more Kubernetes resources, like Deployments and Services. Base resources are complete, valid KRM, and can be deployed to a cluster as-is. An overlay is a directory that patches over one or more bases with some customization. Overlays can include modifications to resources in the base, or additional resources defined in the overlay directory. Multiple overlays can use the same base. This allows you to have separate environments for development, staging, and production, which all use the same set of underlying Kubernetes resources. Let’s see this in action. The cymbalbank-app-config repository contains the kustomize resources for the Cymbal Bank app. This repo has one set of base KRM resources. These are complete YAML files for the Deployments, Services, and ConfigMaps corresponding to each Cymbal Bank service. The repo also has two overlay directories, “dev” and “prod.” The development overlay customizes certain fields in the base resources, like enabling debug-level logs. The production overlay adds different customization, keeping the default “info” level logging, but increasing the number of frontend replicas in order to better serve production traffic.Every kustomize directory contains a special file, kustomization.yaml. This file is an inventory of what should be deployed, and how. For instance, the kustomization.yaml file for the development overlay (shown below) defines which base to use, and lists all the “patch” files to apply over the base. The patch files are incomplete Kubernetes resources, changing a specific piece of config in the corresponding base resource.By providing a pre-built set of Kubernetes resources, along with a development-specific overlay, platform teams can help bootstrap new Kubernetes users without requiring them to create or edit YAML files. And because kustomize has native integration with the kubectl command-line tool, developers can directly apply these resources to a test cluster with “kubectl apply -k.” We can also take this kustomize environment one step further, by allowing the app developer to deploy directly to their development GKE cluster from an IDE. Let’s see how.   Testing application features with Cloud CodeCloud Code is a tool that helps developers build on top of Google Cloud infrastructure without having to leave their IDE (VSCode or IntelliJ). It allows developers to directly deploy to a GKE cluster, and provides useful features like YAML linting for Kubernetes resources.Let’s say the frontend app developer just added some new HTML to the login page. How can they use the “development” kustomize overlay to deploy to their GKE cluster? Cloud Code makes this easy through a tool called skaffold. skaffold is an open-source tool that can automatically build and deploy source code to Kubernetes, for multiple containers at once. Like kustomize, you can use skaffold by defining a YAML configuration file, skaffold.yaml, that lists where all your source code lives, and how to build it. The Cymbal Bank skaffold file (shown below) is configured with three profiles – dev, staging, and prod – each set up to use a different kustomize overlay. Cloud Code is closely integrated with skaffold, so that if you click “Run on Kubernetes” inside your IDE, and specify the “dev” profile, Cloud Code will read the skaffold.yaml configuration, build your local source code into containers, push those containers to your image registry, then deploy those images to your Kubernetes cluster using the YAML resources in the kustomize dev overlay. In this way, the frontend developer can test their local code changes with a single click – no kubectl or command-line tools required.From staging to production with Cloud Build Now, let’s say the frontend developer has finished implementing and testing their feature, and they’re ready to put out a pull request in git. This is where Continuous Integration comes in— all the tests and checks that help verify the feature’s behavior before it lands in production.  As with local development, we want to enable code reviewers to verify this feature in a production-like environment – without forcing them to manually build containers or deal with YAML files. One powerful feature of skaffold is that it can run inside your CI/CD pipelines, automatically building container images from a pull request, and deploying to a staging cluster. Let’s see how this works.We define a Cloud Build trigger that listens to the Cymbal Bank source repository. When a new pull request is created, Cloud Build runs a pipeline containing a “skaffold run” command. This command builds the pull request code, and uses the production kustomize overlay to deploy the containers onto the staging GKE cluster. This allows both the pull request author and the reviewers to see the code in action in a live Kubernetes environment, with the same configuration used in production.We then define a second Cloud Build trigger, which runs when the pull request is approved, and merges into the main branch of the source code repo. This pipeline builds release images, pushes them to Container Registry, then updates the production Deployment resources to use the new release image tags. Note that we’re using two repos here- “App Source Repo” contains the source code, Dockerfiles, and skaffold.yaml file, whereas “App Config Repo” contains the Kubernetes resource files and kustomize overlays. So when a new commit happens in App Source Repo, the Continuous Integration pipeline automatically updates the App Config Repo with new image tags: Once the release build completes, that triggers a Continuous Deployment pipeline, also running in Cloud Build, which deploys the production release overlay, configured with the new release images, to the production GKE cluster.  Here, skaffold and Cloud Build allow us to fully automate the stage-and-deploy process for Cymbal Bank source code, such that the only human action to get code into production was a change approval. App developers didn’t have to worry about the details of every cluster in the environment. Instead, they were able to interact with the system as a whole, focusing on source code and writing features. In this way, app developers worked successfully with KRM by not working with KRM at all. This was made possible by adding abstractions like kustomize and Cloud Code on top. This post only scratches the surface on the kinds of abstractions you can build on top of Kubernetes, but hopefully provides some inspiration to get started. To try this out yourself, check out the part 3 demo.In the next post, we’ll discuss Kubernetes platform administration, and how to use the Kubernetes Resource Model to define and enforce org-wide policies. 
Quelle: Google Cloud Platform

Amazon RDS unterstützt MariaDB-Audit-Plug-In für MySQL Version 8.0

Das MariaDB-Audit-Plug-In steht ab sofort für Instances in Amazon Relational Database Service (Amazon RDS) for MySQL zur Verfügung, die MySQL Hauptversion 8.0 nutzen. Das MariaDB-Audit-Plug-In ist auch für Instances mit MySQL Hauptversion 5.6 und 5.7 verfügbar. Es stellt Ereignisprotokollierung für Datenbankaktivitäten bereit, damit Kunden Compliance- und Prüfungsanforderungen erfüllen und Anwendungsprobleme beheben können. Einige wichtige Details für die Implementierung des Plug-Ins:

Audit-Plug-In aktivieren und deaktivieren: Zum Aktivieren erstellen Benutzer eine Optionsgruppe, fügen die Option MARIADB_AUDIT_PLUGIN hinzu und hängen die Optionsgruppe einer RDS-Instance an. Zum Deaktivieren entfernen sie einfach die Optionsgruppe aus der Instance.
Variablen für SERVER_AUDIT_EVENTS: Mit diesen Variablen können Benutzer festlegen, welche Ereignisse ins Protokoll aufgenommen werden (CONNECTION: Verbindungsstatus der Benutzer, QUERY: Abfragen und Ergebnisse, TABLE: von den Abfragen betroffene Tabellen).
Variablen für SERVER_AUDIT_EXCL_USERS und SERVER_AUDIT_INCL_USERS: Mit diesen Variablen werden die Benutzer festgelegt, deren Aktivitäten von der Prüfung ausgeschlossen oder darin eingeschlossen sind. SERVER_AUDIT_INCL_USERS hat eine höhere Priorität. Standardmäßig wird die Aktivität aller Benutzer erfasst.

Quelle: aws.amazon.com

Ankündigung einer neuen Public Registry für AWS CloudFormation

AWS CloudFormation kündigt den Start der CloudFormation Public Registry an, einer neuen, durchsuchbaren Sammlung von Erweiterungen, mit der sich Drittanbietererweiterungen entdecken, bereitstellen und verwalten lassen. Dazu gehören Ressourcentypen (Bereitstellungslogik) und Module, die von Partnern des AWS-Partnernetzwerks (APN) und der Entwickler-Community veröffentlicht wurden. Sie haben auch die Möglichkeit, Ihre eigenen Erweiterungen in der CloudFormation Public Registry zu erstellen und zu veröffentlichen, damit andere sie verwenden können. Wählen Sie aus mehr als 35 Erweiterungen, die von AWS-Partnern und AWS Quick Starts in der Public Registry veröffentlicht wurden. Die Identitätsverifizierung für die einzelnen Ersteller der Erweiterungen ist in der Public Registry einsehbar. AWS-Partner, die an diesem Start beteiligt waren, sind unter anderem MongoDB, Datadog, Atlassian Opsgenie, JFrog, Trend Micro, Splunk, Aqua Security, FireEye, Sysdig, Snyk, Check Point, Spot by NetApp, Gremlin, Stackery und Iridium.
Quelle: aws.amazon.com