How insurers can use severe storm data for dynamic pricing

It may be surprising to know that U.S. natural catastrophe economic losses totaled $119 billion in 2020, and 75% (or $89.4B) of those economic losses were caused by severe storms and cyclones. In the insurance industry, data is everything. Insurers use data to influence underwriting, rating, pricing, forms, marketing, and even claims handling. When fueled by good data, risk assessments become more accurate and produce better business results. To make this possible, the industry is increasingly turning to predictive analytics, which uses data, statistical algorithms, and machine learning (ML) techniques to predict future outcomes based on historical data. Insurance firms also integrate external data sources with their own existing data to generate more insight into claimants and damages. Google Cloud Public Datasetsoffers more than 100 high-demand public datasets through BigQuery that helps insurers in these sorts of data “mashups.” One particular dataset that insurers find very useful is Severe Storm Event Details from the U.S. National Oceanic and Atmospheric Administration (NOAA). As part of the Google Cloud Public Datasets program and NOAA’s Public Data Program, this severe storm data contains various types of storm reports by state, county, and event type—from 1950 to the present—with regular updates. Similar NOAA datasets within the Google Cloud Public Datasets program include the Significant Earthquake Database, Global Hurricane Tracks, and the Global Historical Tsunami Database.  In this post, we’ll explore how to apply storm event data for insurance pricing purposes using a few common data science tools—Python Notebook and BigQuery—to drive better insights for insurers.Predicting outcomes with severe storm datasetsFor property insurers, common determinants of insurance pricing include home condition, assessor and neighborhood data, and cost-to-replace. But macro forces such as natural disasters—like regional hurricanes, flash floods, and thunderstorms—can also significantly contribute to the risk profile of the insured. Insurance companies can leverage severe weather data for dynamic pricing of premiums by analyzing the severity of those events in terms of past damage done to property and crops, for example. It’s important to set the premium correctly, however, considering the risks involved. Insurance companies now run sophisticated statistical models, taking into account various factors—many of which can change over time. After all, without accurate data, poor predictions can lead to business losses, particularly at scale.  The Severe Storm Event Details database includes information about a storm event’s location, azimuth (an angle measurement used in celestial coordination), distance, impact, and severity, including the cost of damages to property and crops. It documents:The occurrence of storms and other significant weather events of sufficient intensity to cause loss of life, injuries, significant property damage, and/or disruption to commerce.Rare, unusual weather events that generate media attention, such as snow flurries in South Florida or the San Diego coastal area.Other significant weather events, such as record maximum or minimum temperatures or precipitation that occur in connection with another event.Data about a specific event is added to the dataset within 120 days to allow time for damage assessments and other analysis.Damage caused by the storms in the past five years by stateDriving business insights with BigQuery and notebooksGoogle Cloud’s BigQuery provides easy access to this data in multiple ways. For example, you can query directly within BigQuery and perform analysis using SQL. Another popular option in the data science and analyst community is to access BigQuery from within the Notebook environment to intersperse Python code and SQL text, and then perform ad hoc experimentation. This uses the powerful BigQuery compute to query and process huge amounts of data without having to perform the complex transformations within the memory in Pandas, for example.In this Python notebook, we have shown how the severe storm data can be used to generate risk profiles of various zip codes based on the severity of those events as measured by the damage incurred. The severe storm dataset is queried to retrieve a smaller dataset into the notebook, which is then explored and visualized using Python. Here’s a look at the risk profiles of the zip codes:Clusters of Zip codes by number of storms and damage cost.Another Google Cloud resource for insurers is BigQuery ML, which allows them to create and execute machine learning models on their data using standard SQL queries. In this notebook, with a K-Means Clustering algorithm, we have used BigQuery ML to generate different clusters of zip codes in the top five states impacted by severe storms. These clusters show different levels of impact by the storms, indicating different risk groups. The example notebook is a reference guide to enable analysts to easily incorporate and leverage public datasets to augment their analysis and streamline the journey to business insights. Instead of having to figure out how to access and use this data yourself, the public datasets, coupled with BigQuery and other solutions, provide a well-lit path to insights, leaving you more time to focus on your own business solutions.Making an impact with big dataGoogle Cloud’s Public Datasets is just one resource within the broader Google Cloud ecosystem that provides data science teams within the financial services with flexible tools to gather deeper insights for growth. The severe storm dataset is a part of our environmental, social, and governance (ESG) efforts to organize information about our planet and make it actionable through technology, helping people make a positive impact together. To learn more about this public dataset collaboration between Google Cloud and NOAA, attend theDynamic Pricing in Insurance: Leveraging Datasets To Predict Risk and Price session at the Google Cloud Financial Services Summit on May 27. You can also check out ourrecent blog and explore more aboutBigQuery andBigQuery ML.Related ArticleNOAA and Google Cloud: A data match made in the cloudSee how you can use NOAA’s environmental datasets on Google Cloud to explore environmental and historical data, including whale calls, sa…Read Article
Quelle: Google Cloud Platform

Lower development costs: schedule Cloud SQL instances to start and stop

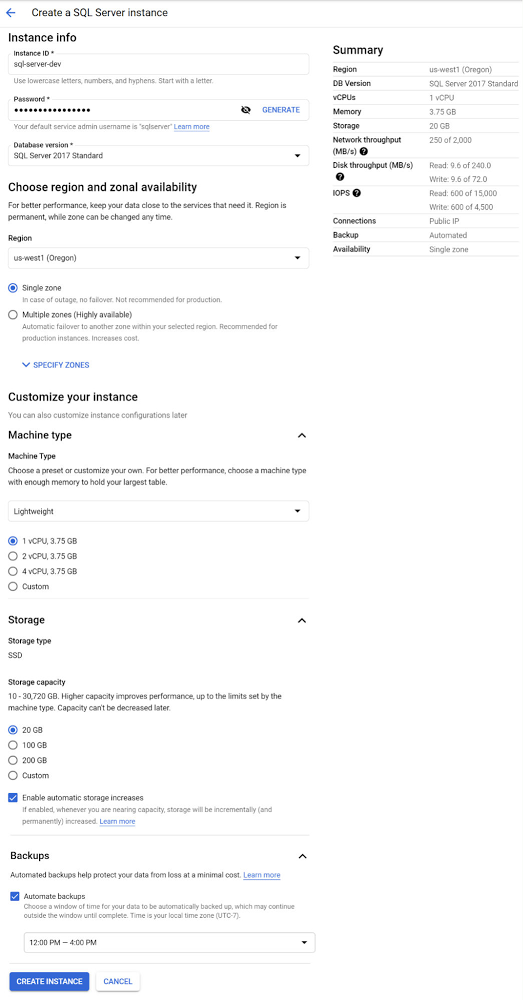
When you’re using a Cloud SQL instance as a development server you likely don’t need to have it running constantly. If so, you can greatly reduce the cost of using Cloud SQL by scheduling your development server to start every morning when your work day starts and stop it each evening when you’re done with your development work. Configuring your instances to run this way can save you up to 75% of the cost to run an instance per week versus having it continuously running. This blog post will walk you through the steps to configure your Cloud SQL instance to start and stop each workday using Cloud Functions, Cloud Pub/Sub, and Cloud Scheduler.I’ll be demonstrating this process using a SQL Server instance but the overall approach will also work for MySQL or PostgreSQL instances running in Cloud SQL.Create a Google Cloud Platform projectTo get started, we’ll need a Google Cloud Platform project. If you already have a project, you can skip this step. Follow the documentation for creating and managing projects to create a new project.Create a SQL Server instanceOnce your project is created click the Cloud Console’s left-menu and select “SQL” to open the Cloud SQL section. We can now create our instance.Click the “CREATE INSTANCE” button and select the “Choose SQL Server” option.Enter a valid Instance IDExample: sql-server-devEnter a password for the “sqlserver” user or click the “Generate” button.For “Database version” select “SQL Server 2017 Standard”.Select a “Region” where the instance should be located like “us-west1″.For the Region’s zone, since the instance is for development and we’re optimizing for the lowest cost, select “Single zone”.Under “Customize your instance” click “Show configuration options” to configure a low cost development instance.Click and expand the “Machine type” section and select a “Lightweight” machine type which has 1 vCPU and 3.75 GB of RAM.Click and expand the “Storage” section and select the minimum option of “20 GB”.Click and expand the “Backups” section and select “12:00 PM to 4:00 PM” as the window for automatic backups. Backup operations can only be done while the instance is running so this selection needs to be within the timeframe of 9:00 AM to 5:00 PM when our instance will be running.With all of that information provided the create instance form should look something like this:Click “CREATE INSTANCE” to complete the process of creating the instance.Create a Cloud Function to Start or Stop a Cloud SQL instanceWith your Cloud SQL instance created, the next step is to create a Cloud Function that will start or stop the instance. Go to the Cloud Functions section of the Cloud Console and click the “CREATE FUNCTION” button.Enter the following information:Specify a Function name:Example: start-or-stop-cloud-sql-instanceSelect a Region where the Function will run:Example: us-west2For Trigger type select “Cloud Pub/Sub”. We’ll create a new Pub/Sub Topic named “InstanceMgmt” to be used for Cloud SQL instance management. Within the “Select a Cloud Pub/Sub Topic” drop-down menu, click the “CREATE A TOPIC” button. In the “Create a Topic” dialog window that appears, enter “InstanceMgmt” as the “Topic ID” and click the “CREATE TOPIC” button. Then click the “SAVE” button to set “Cloud Pub/Sub” as the “Trigger” for the Cloud Function.With all those values entered, the completed “Configuration” section of the “Create function” form should look something like the following:Click the “NEXT” button at the bottom of the “Create function” form to move on to the next step where we enter the code that will power the function.Now in the “Code” step of the “Create function” form, select “Go 1.13” as the “Runtime” and enter “ProcessPubSub” as the code “Entry point”.Then copy and paste the following code into the code section of the “Source code — Inline Editor”:The completed “Code” section of the “Create function” form should look something like this:Click the “DEPLOY” button to deploy the Function. It will take a minute or two for the deployment process to complete.Grant Permission for the Cloud Function to Start or Stop Cloud SQL instancesNext we need to grant our Cloud Function’s Service account  permission to run Cloud SQL Admin methods like “Patch”; used to start or stop instances.Go to the IAM section of the Cloud Console and find the service account used by Cloud Functions named “App Engine default service account”. It has the suffix: “@appspot.gserviceaccount.com”. Click its pencil icon to edit it.In the “Edit permissions” dialog window, click the “ADD ANOTHER ROLE” button. Select the “Cloud SQL Admin” role to be added and click the “SAVE” button.Verify that the Cloud Function works as expectedExcellent! We’re now ready to test out our Cloud Function. We can do so by posting a message to our Pub/Sub topic which is set as the trigger for our function. First we’ll test out stopping the instance. Go to the Pub/Sub section of the Cloud Console and select the “InstanceMgmt” Topic. Click the “PUBLISH MESSAGE” button and paste in the following JSON message, replacing <your-project-id> with your actual Project ID.The Pub/Sub message to be published should look something like this:Drum roll… click the “PUBLISH” button to publish the message which will trigger our Cloud Function and stop the instance. Going back to your Cloud SQL instance details you should see that your instance is now stopped:Now let’s publish another Pub/Sub message to start the instance. Go to the Pub/Sub section of the Cloud Console and select the “InstanceMgmt” Topic. Click the “PUBLISH MESSAGE” button and paste in the following JSON message (this time with “start” as the Action). Be sure and replace <your-project-id> with your actual Project ID.Click the “PUBLISH” button to publish the message which will trigger our Cloud Function and restart the instance.Back on the Cloud SQL instance details page you should see that your instance has been restarted after 2-3 minutes:Create Cloud Scheduler Jobs to trigger the Cloud Function Great! Now that we’ve confirmed that the Cloud Function is working correctly, the final step is to create a couple of Cloud Scheduler jobs that will start and stop the instance automatically. Go to the Cloud Scheduler section of the Cloud Console and click the “SCHEDULE A JOB” button.Enter a “Name” for the scheduled job:Example: start-cloud-sql-dev-instanceEnter a “Description” for the scheduled job:Example: Trigger Cloud Function to start Cloud SQL development instanceFor the “Frequency” of when the job should be run, enter “0 9 * * 1-5” which schedules the job to be run at 9:00 am every day Monday-Friday.Select your timezone from the Timezone selector.Under the “Configure the Job’s Target” section, select the “Target type” to be “Pub/Sub” and for the “Topic” specify “InstanceMgmt”.For the “Message body” enter the same “start” JSON message you used when you tested the Cloud Function earlier in this post. Don’t forget to replace <your-project-id> with your actual Project ID.The completed “Create a job” form should look something like this:With all that information supplied, click the “CREATE” button to create the “start” Cloud Scheduler job. Now we’ve got a scheduled job that will start our Cloud SQL instance every weekday at 9:00 am. The only thing left to do is to create one more scheduled job to stop the instance every weekday evening. Click the Cloud Scheduler “SCHEDULE A JOB” button again to create it. Enter a “Name” for the scheduled job:Example: stop-cloud-sql-dev-instanceEnter a “Description” for the scheduled job:Example: Trigger Cloud Function to stop Cloud SQL development instanceFor the “Frequency” of when the job should be run, enter “0 17 * * 1-5” which schedules the job to be run at 5:00 pm every day Monday-Friday. See the Cloud Scheduler documentation for more information on setting frequency.Select your timezone from the Timezone selector.Under the “Configure the Job’s Target” section, select the “Target type” to be “Pub/Sub” and for the “Topic” specify “InstanceMgmt”.For the “Message body” enter the same “stop” JSON message you used when you tested the Cloud Function earlier in this post. Don’t forget to replace <your-project-id> with your actual Project ID.With all that information supplied, click the “CREATE” button to create the “stop” Cloud Scheduler job. After the job creation completes you’ll see the job list with the “start” and “stop” jobs you’ve just created.Now it’s time to take a second and appreciate the smart steps you’ve just performed to ensure that your development database will only be running when you need it … then bask in the glory of having set up an extremely cost efficient Cloud SQL instance for the development of your next project. Great job!Next stepsUse the Cloud Console to see the current state of your Cloud SQL instance and to create more instances.Related ArticleScheduling Cloud SQL exports using Cloud Functions and Cloud SchedulerLearn the steps required to schedule a weekly export of a Cloud SQL database to Cloud StorageRead Article
Quelle: Google Cloud Platform
Meet the inspiring folks behind Google Cloud Public Sector

At Google Cloud, being a strategic partner is part of our DNA. Whether it’s listening closely to our customers, helping to build team skills for innovation or simply being there (since we know the cloud is 24/7), we get excited about working hands-on with customers to deliver new solutions. As we look to solve decades-old challenges with new technologies in workforce productivity, cybersecurity, and artificial intelligence/machine learning, we know that we are only as good as the people behind the technology. Today, we’re proud to spotlight a few of the inspiring folks behind Google Cloud Public Sector and celebrate their recognition in the industry. Melissa Adamson, Head of Government Channels at Google Cloud, has been named to the highly respected Women of the Channel list for 2021. This annual list recognizes the unique strengths, leadership and achievements of female leaders in the IT channel. The women honored this year pushed forward with comprehensive business plans, marketing initiatives and innovative ideas to support their partners and customers.Melissa was brought on to build the Public Sector channel from scratch. The initial focus was building the channel for the US government team and has since expanded to include education, Canada and Latin America.Having a career background at both Microsoft and Accenture, Melissa leveraged her extensive professional network to build the organic partnerships needed to accelerate the Public Sector partner ecosystem. This helped her drive two key wins (US Postal Service and PTO) and personally recruit top cloud partners in the industry. Melissa loves card games and is learning a new language.Todd Schoeder, Director of Global Public Sector Digital Strategy, was recently featured in the “Top 20 Cloud Executives to Watch in 2021” by Wash Exec. Recognized for his work in helping customers navigate through the impact of COVID-19 and developing innovative solutions to meet mission challenges, he says: “New partnerships are required to solve for the problems of the future. Challenges that were previously thought of as insurmountable, too risky or expensive, are actually quite the opposite — as long as you have the right partner that is working in your best interest with you.”Josh Marcuse, Head of Strategy & Innovation, received his second Wash100 Award for leading a digital transformation team that works to drive the development of public sector solutions, including cyber defense, smart cities, and public health.Josh has launched services to support collaborative team operations including Workspace for Government and an artificial intelligence-based customer service platform to support remote work needs. His work also includes leading Google Cloud’s partnerships with organizations to improve data sharing in the public health community, contact tracing activities, and supporting research efforts across national laboratories. Like Melissa, Josh was brought on to build a new team dedicated to strategy and innovation. This team’s purpose is to bring an intense focus to public sector mission outcomes and the public servants who own them. Josh spent a decade pushing digital modernization and workforce transformation at the U.S. Department of Defense, and co-founded the Federal Innovation Council at the Partnership for Public Service, and now brings that domain expertise to supporting government workers who are driving digital transformation.Join us in celebrating these folks for their leadership and contributions!
Quelle: Google Cloud Platform

How to do network traffic analysis with VPC Flow Logs on Google Cloud

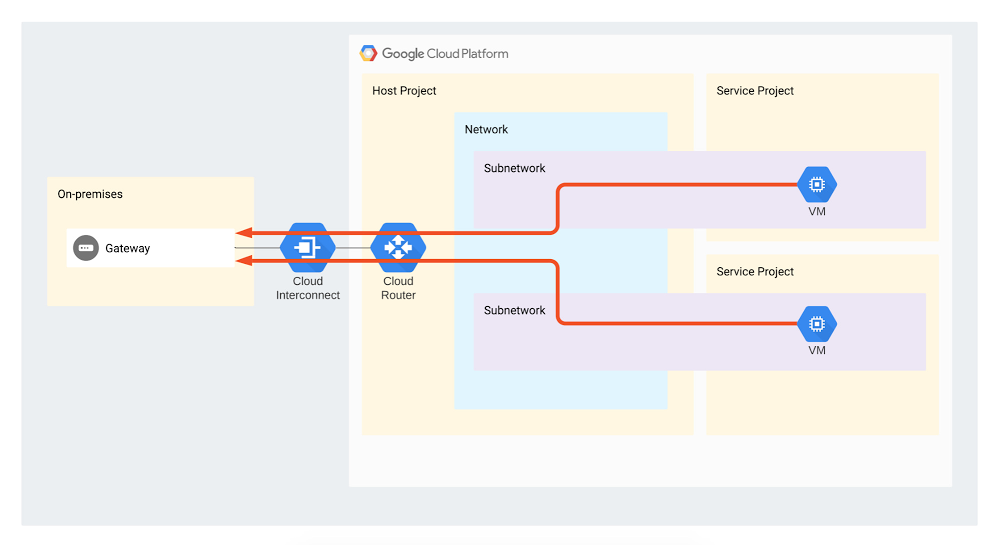
Network traffic analysis is one of the core ways an organization can understand how workloads are performing, optimize network behavior and costs, and conduct troubleshooting—a must when running mission-critical applications in production. VPC Flow Logs is one such enterprise-grade network traffic analysis tool, providing information about TCP and UDP traffic flow to and from VM instances on Google Cloud, including the instances used as Google Kubernetes Engine (GKE) nodes. You can view VPC Flow Logs in Cloud Logging, export them to third-party tools or to BigQuery for further analysis. But as it happens with powerful tools, VPC Flow Logs users sometimes don’t know where to start. To help, we created a set of guides to help you use VPC Flow Logs to answer common questions about your network. This post outlines a set of open-source tools from Google Cloud Professional Services that provide export, analytics and reporting capabilities for multiple use-cases: Estimating the cost of your VPC Flow Logs and optimizing costs Enforcing that flow logs be generated across your organization, to comply with security policiesExporting to BigQuery and performing analytics, e.g., doing cost analysis by identifying top talkers in your environment and understanding Interconnect utilization by different projectsAll of these tools and tutorials are available on GitHub. Let’s take a closer look at each of these use cases.1. Estimate the cost of your VPC Flow Logs and optimize log volume Before you commit to using VPC Flow Logs, it’s a good idea to get a sense of how large your environment might get, so as not to get caught off guard by the cost. You can estimate the size of VPC Flow Logs prior to enabling logging in your environment using the Pricing Calculator to generate a cost estimate based on your projected usage. You can view the estimated logs size generated per day via the subnet editing interface in the Cloud Console. If you want to estimate costs prior to enabling Flow Logs on multiple subnets, projects or an entire workspace, this Cloud Monitoring sample dashboard can estimate the size of your flow logs based on your traffic volume and log usage.  If needed, you can reduce the size of your VPC Flow Logs using a different sampling rate. This has a relatively low impact on the accuracy of your results, especially when looking at traffic statistics such as top talkers. You can also filter logs according to your needs, further reducing log volume. 2. Enforce Flow Logs use across your organization VPC Flow Logs provide auditing capabilities for the network, which is required for security and compliance purposes (many organizations mandate that VPC Flow Logs be enabled across the entire organization). To help, we created a script which uses Cloud Functions to enforce VPC Flow Logs in all the networks under a particular folder. The cloud function listens on a Pub/Sub topic for notifications about changes in subnets.You can find an overview and Terraform code here.3. Perform analyticsIf you want to perform cost analysis on your VPC Flow Logs, we also created a tutorial and Terraform code that show you how to easily export VPC Flow Logs into BigQuery and run analytics on them. Specifically, these scripts answer two different questions:Understand Interconnect utilization by different projects This Terraform code and tutorial describe and provide a mechanism for analyzing VPC Flow Logs to estimate Interconnect attachment usage by different projects. They are intended to be used by the network administrator who administers the landing zone (an environment that’s been provisioned and prepared to host workloads in Google Cloud).VPC Flow Logs capture different flows to and from VMs, but this script focuses only on egress traffic flowing through the Interconnect (as shown by red arrows on the diagram). The reason the script only focuses on egress is because you are only billed for traffic from the VPC towards the Interconnect (unless there is a resource that is processing ingress traffic, such as a load balancer).Click to enlargeIdentify top talkers This Terraform code lets you analyze VPC Flow Logs to identify top talker subnets to configurable IP address ranges such as on-prem, internet, specific addresses and more.Get started todayOf course, these are just a few use cases for this tool, which range from security use-cases to performing cost breakdowns and estimates. If you want to request a specific capability, do feel free to contact us and ask. The same goes for any specific analytics that you’ve created for VPC Flow Logs—we’d be thrilled for you to contribute them to this repository. To learn more, check out the VPC Flow Logs documentation.We’d like to thank the many Google Cloud folks who have made this possible: Alfonso Palacios, Anastasiia Manokhina, Andras Gyomrey, Charles Baer, Ephi Sachs, Gaspar Chilingarov, and Xiang Shen.
Quelle: Google Cloud Platform

Amazon Transcribe Medical bietet jetzt eine automatische Identifizierung geschützter Gesundheitsdaten (Protected Health Information, PHI) für Batch-Verarbeitung

Amazon Transcribe Medical ist ein HIPAA-kompatibler automatischer Spracherkennungsservice (ASR), der es Entwicklern erleichtert, Anwendungen für das Gesundheitswesen und die Biowissenschaften um Sprach-zu-Text-Funktionen zu erweitern. Wir freuen uns, Unterstützung für die automatische Identifizierung von geschützten Gesundheitsdaten (PHI) in Ihrer medizinischen Transkriptionsfunktion für die Batch-Verarbeitung einzuführen. Mit automatischer PHI-Identifizierung können Kunden nun Kosten, Zeit und Aufwand für die Identifizierung von PHI-Inhalten sowohl aus Live-Audiostreams als auch aus statischen Aufnahmen reduzieren. PHI-Entitäten werden mit jedem Ausgabetranskript eindeutig gekennzeichnet, sodass eine zusätzliche nachgelagerte Verarbeitung für eine Vielzahl von Zwecken, wie z. B. die Schwärzung vor der Textanalyse, problemlos möglich ist.
Quelle: aws.amazon.com

AWS Step Functions unterstützt jetzt das Senden von benutzerdefinierten Amazon-Ereignissen an EventBridge

AWS Step Functions unterstützt jetzt eine Service-Integration mit Amazon EventBridge, sodass Sie benutzerdefinierte Ereignisse aus Ihren Step-Functions-Workflows an einen EventBridge-Ereignisbus senden können, ohne benutzerdefinierten Code zu schreiben. Sie können jetzt benutzerdefinierte Ereignisse von Ihren Workflows ausgeben, die es lose gekoppelten Anwendungen ermöglichen, auf Schritte in Ihrer Geschäftslogik zu reagieren, die von Step Functions orchestriert werden. Sie können diese Integration auch nutzen, um Ereignisse an Anwendungen in einer anderen Region oder einem anderen Konto zu senden, indem Sie die konto- und regionenübergreifenden Funktionen von EventBridge nutzen.
Quelle: aws.amazon.com

Amazon RDS Data API unterstützt jetzt validierte FIPS 140-2-Endpunkte

Amazon Relational Database Service (Amazon RDS) Data API bietet jetzt nach Federal Information Processing Standard (FIPS) 140-2 validierte Endpunkte. FIPS 140-2 ist ein US-amerikanischer und kanadischer Regierungsstandard, mit dem die Sicherheitsanforderungen für Verschlüsselungsmodule angegeben werden, die vertrauliche Informationen schützen. Wenn Sie die Verwendung von validierten kryptografischen FIPS 140-2 Modulen benötigen, haben Sie jetzt mit RDS Data API die Möglichkeit dazu.
Quelle: aws.amazon.com