Container Security: Which solution is best?
Quelle: Mirantis
Quelle: Mirantis

Last week, we were pleased to present the first in a new series of webinars, Getting Started with Kubernetes, Part 1: Introduction to YAML. During that webinar we received dozens of questions — way more than we could answer in the short time that we had, so we’re going to be putting out a separate … Continued
Quelle: Mirantis

The new Lens 4.1 Kubernetes IDE release delivers user-interface and quality-of-life improvements, like a new Command Palette for those of you who enjoy keyboard shortcuts, more control over auto-updates, and the ability to add new Helm repositories via the graphic UI (previously, this had to be done from the command line).
Quelle: Mirantis
Complementing an article for TheNewStack, in this video, Mirantis Field CTO Shaun O’Meara talks about tech requisites for making multi-cloud work for enterprises, today
Quelle: Mirantis
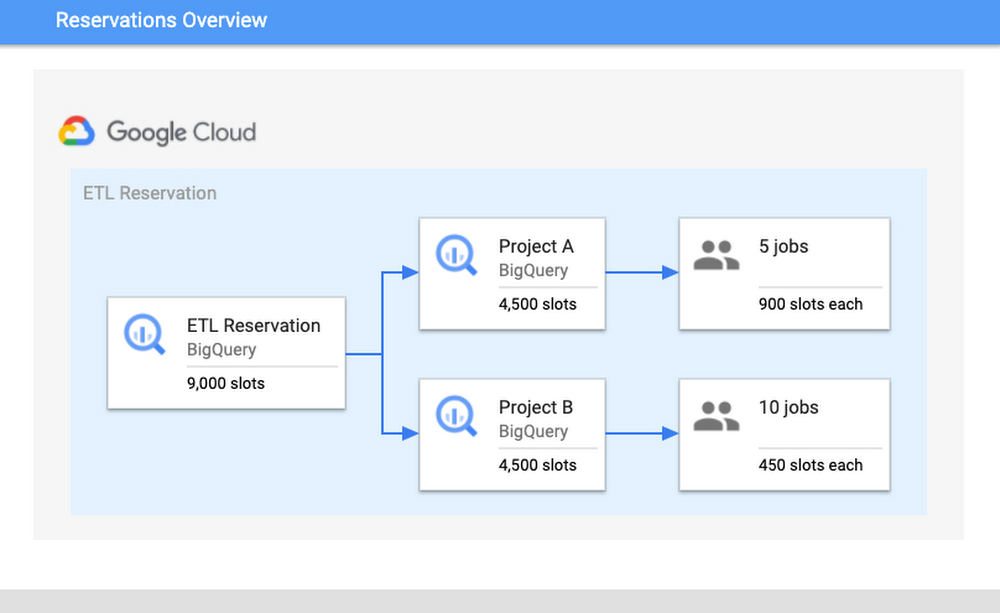
BigQuery is Google’s flagship data analytics offering, enabling companies of all sizes to execute analytical workloads. To get the most out of BigQuery, it’s important to understand and monitor your workloads to keep your applications running reliably. Luckily, with Google’s INFORMATION_SCHEMA views, monitoring your organization’s use at scale has never been easier. Today, we’ll walk through how to monitor your BigQuery reservation and optimize performance. Understanding Workloads and ReservationsOur first step is to analyze your organization-wide historical slot utilization. With reservations, you can allocate capacity, or slots, to designated groups of GCP projects in your organization. When organizing projects, consider grouping them according to workloads, teams, or departments. We encourage you to isolate these groups of projects, or specific workloads, in separate reservations. This will help with monitoring and overall resource planning to track trends in growth. In practice, this might look like the following: break out business units, like marketing or finance, and separate known, persistent workloads like ETL pipelines from more ad-hoc workloads like dashboarding. Isolating workloads like this means that any burst in resource usage from one reservation will be unable to adversely impact another reservation; a sudden surge from a dashboarding task won’t interfere with ETL schedules. This will minimize any disruptions caused by unanticipated spikes, as well as allow reservations to meet their SLOs so that jobs can complete on time.How Scheduling WorksTo better understand why isolation matters, it’s important to understand BigQuery’s Scheduler. BigQuery uses a notion of fairness for allocating slots. First, BigQuery assigns slots at the reservation level. From within a reservation, slots are then assigned equally amongst all active projects, where active signifies a project that is currently executing a query. From within each active project, slots are then allocated to all running jobs to ensure that each job is able to make forward progress.Consider the following scenario: there is a reservation “ETL” that has 9,000 slots, which contains Project A and Project B. Project A is currently running five jobs and Project B is running ten jobs. Assuming that all jobs require maximum slots to complete their jobs, then each project would get 4,500 slots each. The five jobs in Project A would receive 900 slots each and the ten jobs in Project B would receive 450 slots. These per-job slot allocations are recomputed constantly, depending on each job’s need and current state in order to make progress.Once you have optimized your isolation configuration, the next step is to examine your usage and configure your slot allocation. A high slot utilization implies good cost-efficiency; this means that the resources that you’re paying for are not sitting idle. However, you don’t want to get too close to 100% utilization. Operating too close to 100% leaves you without a buffer for potential spikes in usage. If a spike does occur and drive you over 100%, it can cause resource competition and general slowness for your users. Improving and monitoring query performanceTo monitor performance, we’ll walk through common root causes, signals to look for, as well potential steps for mitigation. Our goal for the sake of this example will be increased performance for your queries.We’ll start by comparing the data from the INFORMATION_SCHEMA views. Specifically, to understand differences in query performance, we will take two similar queries and compare their INFORMATION_SCHEMA job data. Note: it’s important that these jobs are similar and are expected to generate comparable output. This might mean comparing the same job executed at hour A vs. hour B or the same job that read in partitions from date A vs. date B. The data from these views displays various job statistics that affect query performance. By understanding how the statistics from these fields varied between different runs, we can identify the potential root causes for slowness, and steps for mitigation. The table below summarizes the top key indicators and the corresponding root cause.Job Comparison DashboardWe’ll begin by navigating to our public dashboard, which shows Google’s test INFORMATION_SCHEMA data to compare the performance of jobs. Let’s walk through each of these root causes and learn how to diagnose them by using the Systems Tables dashboard. To begin, we’ll enter both a slow and fast job ID to compare job statistics.1. Slot ContentionBackgroundSlot contention can occur when the demand for slots is higher than the allocated amount for the reservation. Since projects/jobs share slots equally inside of a reservation, this means that if more projects/jobs are active, then each project/job will receive less slots. To diagnose slot contention, you can use the INFORMATION_SCHEMA timeline views to analyze concurrency at both the project-level and the job-level.MonitoringWe’ll look at a few different scenarios for this use case: first, we’ll verify that the “total_slot_ms” varied between the queries. If one job ran slower and used significantly less slots than the other, then this usually means it had access to less resources because it was competing against other active jobs. To verify this assumption, we’ll need to dive into concurrency:1. Concurrent Projects: If the job is inside of a reservation, we’ll use the JOBS_BY_ORGANIZATION timeline view to compute the active number of projects during both the slow and fast queries. Query jobs will slow down as the number of active projects across the reservation increases. Represented as an equation, if there are Y projects in a reservation, each project receives 1/Y of the reservation’s total slots. This is due to the BigQuery fair scheduling algorithm described above.In the graph above, we can see that when the job on the left began, there were three total active projects at the same time, competing for the reservation’s 35 slots. In this scenario, each project received 1/3 of the reservation’s 35 slots, or about 12 slots. However, in the graph on the right, we can see that there was only one active project, meaning that specific job received all 35 slots.2. Concurrent Jobs: Similarly, we can also use the JOBS_BY_PROJECT timeline view to understand the behavior inside of the project itself. If the number of concurrent jobs is high, this means all of the jobs are competing for resources at the same time. Since the demand is high, there are less available slot resources for each job, meaning that the query may take slower than usual to complete.In the graph above, you can see that the slow query, on the left, was competing with between 20 and 100 other jobs over the course execution. However, the fast job, on the right, was only competing with between four and 26 other jobs over its execution. This shows that the volume of active jobs at the same time as the job on the left was likely the reason for the slow speed and long duration.3. Lastly, we can also try to understand if idle slots were used. Idle slots are an optional configuration for reservations. If you enable them, you allow any available slots to be shared between reservations, so that unused slots are not wasted by non-active reservations. If a job had access to idle slots when it first ran, it likely would have executed faster than without them, as the extra idle slots, coupled with the reservation’s normal allocation, gave it more resources to execute. Unfortunately, we can’t view this today in INFORMATION_SCHEMA. However, we can make a best guess about if idle slots were available by look at the reservation’s utilization percentage during execution; if utilization for the reservation was greater than 100%, this means that it must have borrowed slots from another reservation.In the graph above, you can see both the organization and reservation’s capacity, as well as the amount of slots used by the reservation. In this case, the jobs in the same reservation on the left used 1,055 slots, which is more than its capacity of 100.Because the organization has a capacity of 1,000, and the reservation only has 100, it must have used 900 remaining idle slots from another reservation in the organization. Note: in rare cases, an organization may use more than its purchased capacity in the event of migrations within the data center or extra on-demand slots being used by projects within the organization.Mitigation OptionsIf the root cause is slot contention, then this means you need a way to give your job access to more slots. You have a few options to do so:1. Purchase more slots: This is the simplest option. You can purchase a new commitment for slots in the reservation, which will guarantee that there are more resources. You can purchase this in annual, monthly, or flex increments depending on your forecasting needs.2. Reallocate slot proportions per reservation: If buying more total slots is not an option for your organization, you can reallocate your current slots between reservations based on priority. This might mean reassigning a certain amount of slots from reservation A to reservation B. Allocating these slots to reservation B’s assignment will help jobs in reservation B complete faster than before as it now has increased capacity, and reservation A’s will likely complete slower.3. Reschedule jobs to minimize concurrent jobs: If you cannot move the resources between reservations, then you may be able to adjust the timing of jobs to maximize the utilization of your reservation over time. Move non-urgent jobs to off-peak hours, such as weekends or overnight. If you can spread the load over different times of day, this will reduce the competition for slots at peak hours. You can examine the Hourly Utilization report to better understand trends.In this view, you can see that the reservation is active between 4PM-8AM UTC on both January 27 and January 30. However, the hours between 8AM-4PM UTC are less utilized and therefore can be considered “off peak”. It would be beneficial to try to reschedule the jobs to be between 8AM-4PM to allow for more distributed resource usage.2. Changes in Data ShapeBackgroundAnother potential reason for unexpected changes in duration could be the underlying data itself. This can happen in two ways: either the underlying source tables contain more data than prior runs, or intermediate subqueries may result in more data being processed as the query executes.MonitoringFirst, you can check if the “total bytes processed” field increased from changes in the query. If this increased from the fast job to the slow job, then this means the job had to process more than usual. We can confirm the root cause in two ways:1. If it increased, then this means overall the query had more data to analyze. Verify that the query text itself did not change; if a JOIN moved, or if a WHERE clause updated its filtering, this can mean more data to read.In the job stages as a percentage of job time view, we can analyze the shape of the input data and compare it between queries. For example, we can compare the “input” percentage between the slow and fast job, which indicates how much data was ingested. If we examine stage 2 input, we see it took about 25% of processing time in the job on top. However, in the job on the bottom, it took about 1-2% of processing time. This indicates that the source table ingested at stage 2 likely grew, and could explain why the job was slower.2. We should also analyze the size of the source tables for the query. We’ll view the referenced_tables field as this will show all source tables used by the query. We will compare the size of each source data at the time of the query. If the size increased significantly, then this is likely a reason for slowness.In this example, we can see that the amount of bytes processed increased significantly between jobs. This is likely the reason for slowness. We can additionally verify this with the fact that total_slot_ms increased, meaning that it had more slots available and still took longer.Mitigation Options1. Clustering: Depending on your query, you may be able to use clustering to help improve the performance. Clustering will help queries that use filtering and aggregation, as clustering sorts similar columns together. This will reduce the amount of data scanned, but will only show large performance improvements for tables greater than a gigabyte. 2. Minimize input data: In order to mitigate this, try to find out if there is any way to optimize the query text to read only the required data. Some options to do this include filtering early, such as adding WHERE statements in the beginning of the query to filter out unnecessary records or modify the SELECT statement to only include the needed columns, rather than a SELECT *.3. Denormalize your data: if your data involves parent-child or other hierarchical relationships, try to use nested and repeated fields in your schema. This allows BigQuery to parallelize execution and complete faster.3. Increased Shuffle MemoryBackgroundWhile jobs use slots for the compute resources, they also use shuffle memory to keep track of the job’s state to transition data between execution stages as the query progresses. This shared state ultimately allows for parallel processing and optimizations of your query. Your shuffle memory is correlated to the amount of slots available in a reservation.Because shuffle is an in-memory operation, there is only a finite amount of memory available for each stage of the query. If there is too much data being processed at any point in time, such as a large join, or if there is a high data skew between joins, it’s possible that a stage can become too intensive and exceed its shuffle memory quota. At this point, shuffle bytes will spill to disk, which causes queries to slow down.MonitoringTo diagnose this, you should look at two different metrics: both the shuffle memory consumed by the job as well as the slots used. Your shuffle memory quota is tied to your slot capacity, so a stable amount of slots alongside an increase in the amount of shuffle spilled to disk would indicate that this could be the root cause.Compare the aggregate shuffle_output_bytes_spilled_to_disk from the TIMELINE view. An increase in bytes spilled to disk suggests that the jobs are stuck, rather than running fast enough to complete on time.In this example, you can see that the amount of data spilled to disk is significantly higher for the slow query. Additionally, the total slots have increased as well, meaning that it had more resources available and still took longer to complete.Mitigation OptionsAn increase of bytes spilled to disk means that BigQuery is having trouble maintaining state between query execution stages. Because of this, you should try to optimize the query plan itself so that less bytes are passed between stages.1. Filter data early: Reduce the amount of data ingested by the query by filtering early with WHERE clauses and before joining tables. Additionally, ensure that you are not using SELECT *, and are only selecting the necessary columns.2. Use partitioned tables over sharded tables: If you’re using sharded tables, try to use partitioned tables instead. Sharded tables require BigQuery to maintain a copy of the schema and metadata, in addition to maintaining state, which can decrease performance.3. Increase slots: Because the amount of shuffle memory is correlated to the amount of slots, increasing the amount of slots can help alleviate the amount of memory spilled to disk. As mentioned in the Slot Contention mitigation steps, you can do so via purchasing a new commitment or reallocating more slots to this particular reservation.4. Rewrite the query: Because the job cannot maintain the state of data between stages, your other option is to rewrite the query to improve performance. This might mean trying to optimize against SQL anti-patterns by reducing the number of subqueries or eliminating CROSS JOINs. Additionally, you can consider breaking the query up into numerous chained queries and storing the output data between queries into temporary tables.4. Priority ModeBackgroundIn BigQuery, queries can execute in either one of two methods of priority: interactive or batch. By default, BigQuery executes jobs in interactive mode, meaning that it executes as soon as resources are available. Monitoring1. You can find your mode by inspecting the priority column of the job. A job may run slower as a batch job than as an interactive job.2. If both jobs were run in batch mode, compare the state over time. It’s possible that one job was queuing in the PENDING state for a long time, meaning that there weren’t resources available to run at creation time. You can verify this by looking at the Creation (s) time in the table, as this displays how long it was queued before starting.Mitigation1. Understand the relative priorities and SLOs for the jobs. If your organization has less critical jobs, try to run them in batch mode, so that you can let more critical jobs finish first. The batch jobs may queue up and wait to run until interactive jobs finish and/or idle slots are available.2. Identify the concurrency quota difference between batch and interactive jobs. Batch and interactive jobs have different concurrency quotas. By default, projects are limited to 100 concurrent interactive queries. You can contact your sales team or support to look into raising this limit, if necessary. Batch jobs will also be queued, as necessary, to ensure that interactive jobs finish before the 6-hour timeout window.3. Similar to the mitigations presented in slot contention, you can consider either purchasing more slots for the reservation or rescheduling your job at off-peak hours when there is less demand for resources.As you can see, there are many ways to troubleshoot your query jobs based on the data from INFORMATION_SCHEMA. Try it out yourself here with any two job IDs.
Quelle: Google Cloud Platform
As Google Cloud’s Certificate Authority Service (CAS) approaches general availability, we want to help customers understand the service better. Customers have asked us how CAS fits into our larger security story and how CAS works for various use cases; today we are releasing a white paper about CAS to answer those questions and more.“Scaling certificate management with Google Certificate Authority Service”, written by Andrew Lance of Sidechain and Anton Chuvakin and Anoosh Saboori of Google Cloud, focuses on CAS as a modern certificate authority service and showcases key use cases for CAS.The digital world has experienced unprecedented growth and interconnectivity over the past few years. A perfect storm of new conditions has achieved almost a flywheel effect, with the advent of many technological innovations. The concurrent rise of cloud computing, emergence of 5G, and proliferation of Internet-of-things (IoT) smart devices has created immense market opportunities for digital products that interconnect our lives and workplaces. Critical to this explosion of connected devices and software-defined-everything is the ability for these interconnected devices to verify their identity with each other.Google has introduced Certificate Authority Service (CAS) to address these and many other challenges that organizations face as they use digital certificates in this new age. CAS is not only a cloud-ready platform for hyperscaling certificate management; it is also aligned with the development methodologies of cloud-native applications, as well as fully API-enabled.Here are our favorite quotes from the paper:“The hyperscale growth of digital infrastructures have expanded not only from the data center to the cloud, but have embraced sophisticated multi-cloud strategies, and hybrid strategies that seamlessly integrate clouds and on-premise workloads. Digital certificates underlie the system integrity of all of it, the scale of which has become frighteningly massive.” This reminds us that digital certificates are not about “IT plumbing”; they underpin the entire digital economy.“Traditional certificate management systems – often referred to as Certificate Authorities (CA’s) – are not equipped to handle these new demands. […] It is very typical that certificate requests are manual, often requiring days if not weeks turnaround time. […] New demands being placed on digital certificates and PKI systems are often at-odds with these traditional deployments.” This means that both legacy tools and traditional processes around certificates do not fit today’s demands.“As more organizations are developing applications and technology infrastructure cloud-first, it simply doesn’t make sense to keep tying back to on-premise infrastructure like certificate authorities.” “Containers make deploying application components easy and fast. […] Things get complicated when adding certificates. Certificate renewal usually happens at a different cadence than application updates, and traditional CA systems are managed by completely different teams requiring lengthy manual requests to fulfill certificate issuance. [Google] CAS, on the other hand, can enable developers to securely manage certificates within their containerized applications through automation and standardized API’s.” Containers are one of the best example environments where Google CAS shines.“Many smaller vendors in the IoT space are now seeing the need for PKI and certificate management as standards body’s such as the Wireless Power Consortium now require authentication frameworks that involve certificate-based identities and other security requirements. Many smaller companies do not have the skillsets or other resources to manage their own traditional PKI infrastructure. CAS is a service that enables smaller engineering-centric organizations to manage certificates much easier than traditional CA’s would be.” As we said in our blogs, IoT is another area where Google CAS works well.“Many IT organizations are also establishing a “zero trust” model for network-based security, all of which relies on the concept of trusted identity rooted in digital certificates. IT teams are now establishing trusted identities for applications, operating systems, smartphones and other BYOD devices, and workstations. […] CAS offers an intuitive service for IT teams to scale their efforts with zero trust models.” Read “Scaling certificate management with Google Certificate Authority Service”, and sign up for CAS here.Related ArticleStrengthen zero trust access with the Google Cloud CA serviceCertificate Authority Service, a highly scalable and available service that simplifies and automates the management and deployment of pri…Read Article
Quelle: Google Cloud Platform

Thank you, thank you, thank you! We want to start off this month’s post with an extreme sense of gratitude for the work our customers and partners are doing to innovate with Google Cloud’s Smart Analytics Platform. Your success and enthusiasm was felt in many ways this past month. BigQuery Omni was shortlisted by CRN asone of the10 hottest Google Cloud Tools to watch in 2021 and Google BigQuery was named aLeader in The Forrester Wave™: Cloud Data Warehouse, Q1 2021 report.We were also thrilled to see Forrester give BigQuery a score of 5 out of 5 across 19 different criteria, including Data Lake Integration, Data Ingestion, High Availability, Performance, and ML/Data Science features. We hope you’ll share this free report with your teams and colleagues!If you can’t wait for May, we suggest joining us this week to learn about Rackspace’s data modernization journey at the company’s Strategies Series event. Juan Riojas, the firm’s Chief Data Officer, will explain how Rackspace leveraged Google Cloud solutions to improve customer experience, reduce churn, and save $1.2 million by consolidating 74 operational data sources, four data warehouses, one data lake, and 12 years of on-premises history.Leaders come in all sizesIn last month’s data analytics post, you read about Verizon Media’s journey and how they picked BigQuery for scale, performance and cost. In March, we shared how companies like Veolia, Vodafone and PwC innovate with data using Google Cloud’s Smart Analytics Platform. We’re delighted to see companies of all sizes benefit from the value of our platform. Take a look at the story of leading decentralized video streaming platform Theta Labs, for instance, which required scalable, reliable, and secure infrastructure to reach more users and avoid hitting VM caps that previously caused issues. They turned to Google Cloud’s databases and analytics products, such as BigQuery, Dataflow, Pub/Sub and Firestore, saving hours or even days of engineering time. And they experienced a return on investment almost immediately—their migration took less than six months to complete. Another great example is Keap, a technology and services company that helps small businesses accelerate growth with an all-in-one customer relationship management (CRM), sales, and marketing automation solution. Rajesh Bhatia, the company’s Chief Technology Officer, wrote a great post about how moving to Google Cloud helped Keap overcome scalability issues and bring always-on, mission-critical services to its users while freeing up time and resources. The company assessed other public cloud providers but Google Cloud stood out for going above and beyond other providers in helping us identify our path to successful migration.In addition to providing great details behind Keap’s technological modernization, Rajesh also gives us a peek into the cultural benefits experienced as part of its transformation. For instance, you’ll learn how their data team transformed from a cost center into a team focused on revenue-generating opportunities by providing embedded analytics to customers.Keap helps small business customers think big and we are proud to be part of their journey!Leaders come in all industriesWe’re also proud to observe the rapid pace at which customers operate their digital transformation across many industries. For example, the telecommunication industry is experiencing ongoing, massive transformation. According to a new study by Analysys Mason, telecommunications information is growing at 20% CAGR, and network data traffic is expected to reach 13 zettabytes by 2025. During March, we learned how our partnership with Amdocs is helping telecommunications leaders use analytics and AI to make decisions in real time, whether to find anomalies, understand unseen correlations, or predict future trends.We see the same thing happening in financial services, online business, and retailers, where businesses are built on reliable and trusted relationships. Quantiphi, an award-winning Google Cloud Premier Partner, has recognized the importance of helping their clients build and maintain real-time prediction models at scale to address business challenges like credit card fraud. Global losses from payment fraud have tripled in the past 10 years, and according to Merchant Savvy, payment fraud is expected to continue increasing with a projected cost of $40.62 billion in 2027—25% higher than in 2020.That’s why we developed a smart analytics design pattern, together with Quantiphi, enabling companies to build a scalable real-time fraud detection solution in just one hour using serverless, no-ops products from Google Cloud. The solution leverages Dataflow’s real-time data processing capabilities to store transactions in Firestore, our flexible, scalable and serverless NoSQL cloud database. It also combines with BigQuery, our extensible and adaptable data warehouse, allowing you to leverage BigQuery ML’s built-in machine learning capabilities and the AI Platform’s real-time inference.These resources are available to you and your team at no cost to set up fraud notifications. You can watch the tutorial below to learn how to build the solution as well as dashboards to monitor the performance of the entire fraud detection pipeline. How to build a serverless real-time credit card fraud detection solutionThis is a step-by-step video that explores the credit card fraud detection pattern in this and helps walk you through the entire process of building such a system in your organization.You can also play with this interactive Data Studio dashboard to see the result of our analysis using the sample data used as part of this solution.Finally, if you are currently a BigQuery reservation customer and looking to run real-time monitoring and troubleshooting of your BigQuery environments, you’ll be pleased to hear that our team just released Resource Charts for BigQuery Administrator. Resources Charts provide a native, out-of-the-box experience, making it easy to understand historical patterns across slot consumption, job concurrency, and job performance and take action to ensure your BigQuery environment continues running smoothly. And guess what? We also have public Data Studio dashboard templates available so you can see how this functionality might look at your company. Whether you’re in financial services, telecommunications, retail, manufacturing, or any other industry, we offer a plethora of free and self-serve solutions to help you tackle various other business issues beyond real-time credit card fraud detection. The most popular include predicting customer lifetime value, determining propensity to purchase, building product recommendation systems, solving anomaly detection, and demand forecasting.Data Champions: Speed is the name of the game!And if all of this is not cool enough, allow us to share our favorite story from this month! The Golden State Warriors (GSW) share how they used BigQuery to reduce their data integration times from multiple days to less than an hour, enabling analysts to explore more data, build accessible knowledge, and promote a more effective environment to support analytical ideation and hypothesis testing. Starting with data ingestion from an alternative cloud into BigQuery, the Golden State Warriors’ strategy team achieved phenomenal results with a combination of open source technology and Google Cloud’s fully-managed services:The team parallelized data ingestion at breakneck speed with Apache Beam, a parallel processing tool, and Cloud Dataflow, Google Cloud’s fully-managed service for stream and batch data processing.Using Cloud Composer, Google Cloud’s fully managed workflow orchestration tool built on Apache Airflow, the team built out fully integrated, continuously updating data pipelines. This allowed them to bring more than a dozen different data sources into their BigQuery data warehouse, while also building out long-term storage within Cloud Storage and logging exports with Cloud Pub/Sub.Watch the video below to see key “Data Champions” in GSW, including Head Coach Steve Kerr, chime in on the importance of data and how their team uses intelligent technologies to better serve the needs of coaches, front office, staff, players and fans. Golden State Warriors | The Draft and the Data, presented by Google CloudWe smiled when Mike Brown, assistant coach, looked at the camera and asked: “BigQuery, what is it?” and further answers his question by saying “it’s faster than a falcon”. The Golden State Warriors (GSW) is a great example of an organization that moves fast in an industry where speed is the name of the game!It’s delightful to see the Golden State Warriors and many others validate our approach and our commitment to an open ecosystem. Other notable March features and announcementsWe’re also excited to announce the release of an open source connector to read streams of messages from Pub/Sub Lite into Apache Spark. For those of you who aren’t familiar, Pub/Sub Lite is a scalable, managed messaging service for Spark users on Google Cloud Platform looking for an exceptionally low-cost ingestion solution. This connector allows you to use Pub/Sub Lite as a replayable source for Apache Spark’s Structured Streaming processing engine with exactly-once guarantees and ~100ms processing latencies. You can read more about it in our announcement blog here.We also announced the general availability of Dataproc Metastore. A fully managed, serverless technical metadata repository based on the Apache Hive metastore. Enterprises building and migrating open source data lakes to Google Cloud now have a central and persistent metastore for their open source data analytics frameworks. This no hassle setup solution allows enterprises to migrate their open source metadata without having to worry about the overhead of setting up highly available architectures, backups, and performing maintenance tasks. Finally, if you’re wondering what Cloud Composer does and haven’t had time to research it, we recommend you watch the “Cloud Composer in a minute” video we just produced to guide you and your team. Cloud Composer in a minute
Quelle: Google Cloud Platform

Krude Mythen im Internet verbreiten reicht offenbar nicht mehr. Nun muss die Bundesnetzagentur einschreiten. (Bundesnetzagentur, Internet)
Quelle: Golem

Zahlreiche Microsoft-Dienste waren offenbar wegen eines DNS-Fehlers in Azure offline. Möglicherweise waren die Server überfordert. (Microsoft, DNS)
Quelle: Golem

In nur drei Jahren will die Deutsche Telekom die Zahl ihrer FTTH-Anschlüsse um rund 400 Prozent steigern. (Glasfaser, Telekom)
Quelle: Golem