Show me the money! How you can see returns up to $259M with a DevOps transformation

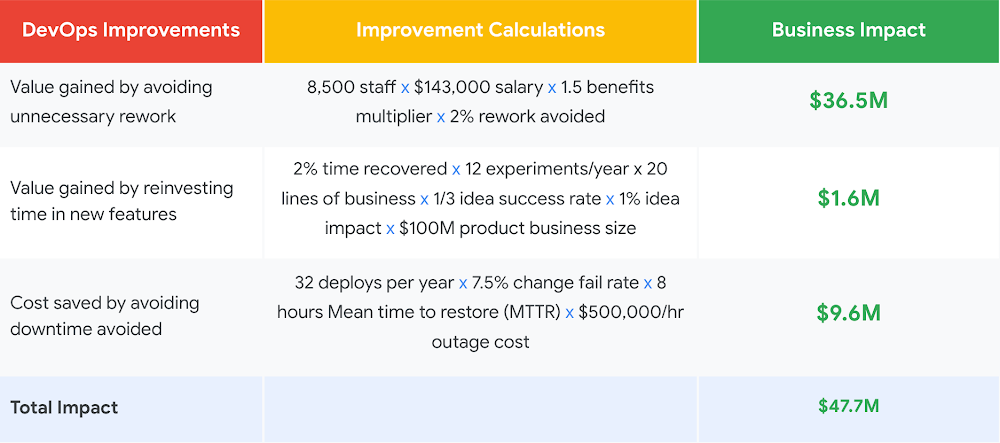
2020 challenged some of the best laid plans by enterprises. With nearly everything moving online, Covid-19 pushed forward years of digital transformation. DevOps was at the heart of this transformation journey. After all, delivering software quickly, reliably, and safely to meet the changing needs of customers was crucial to adapt to this new normal.It is unlikely that the pace of modernization will slow down in 2021. As IT and business leaders further drive digital adoption within their organizations via DevOps, the need to quantify the business benefit from a digital transformation remains top of mind. A reliable model is imperative to drive the right level of investments and measure the returns. This is precisely why we wrote How to Measure ROI of DevOps Transformation. This white paper is backed with scientific studies conducted by DevOps Research and Assessment, DORA, with 31,000 professionals worldwide over 6 years to provide clear guidance based on impartial industry data. We found the financial savings of DevOps transformation varies from from $10M to $259M a year.Looking beyond cost to valueThe most innovative companies undertake their technology transformations with a focus on the value they can deliver to their customers. Hence, in addition to measuring cost savings, we show how DevOps done right can be a value driver and innovation engine. Let’s look deeper into how we quantify the cost and value-generating power of DevOps. Cost-driven categoryHere, we focus on quantifying the cost savings and efficiencies realized by implementing DevOps—for example, how an investment in DevOps reduces costs by cutting the time it takes to resolve outages and avoiding downtime as much as possible. However, focusing solely on reducing costs can rarely yield systemic, long-term gains; thereby increasing the importance of going beyond cost-driven strategies. The cost savings achieved in year one “no longer count” beyond year two as the organization adjusts to a new baseline of costs and performance. Worse, only focusing on cost savings signals to technical staff their job is potentially at risk due to automation rather than being liberated from drudge work to better drive business growth. This leads to negative effects on morale and productivity. Value-driven categoryThere are two value drivers in a DevOps transformation, (1) improved efficiency through the reduction of unnecessary rework, and (2) the potential revenue gained by reinvesting the time saved in new offer capabilities.Adding these cost and value driven categories together, IT and business decision makers can get an estimate of the potential value their organizations can expect to gain from a DevOps transformation. This helps justify the investment needed to implement the required changes. To quantify the impact, we leverage industry benchmark data across low, medium, high, and elite DevOps teams, as described by DORA in its annual Accelerate: State of DevOps report. Combining cost and valueAs an example, let’s consider the impact of a DevOps transformation on a large organization with 8,500 technical staff and a medium IT performer. Using the data gained from the DevOps report, we can calculate both the cost and value driven categories along with total impact. While this example represents what a medium IT performer at a large organization might expect by investing in DevOps, companies of all sizes and performance profiles can leverage DevOps to drive performance. In the white paper, we calculate the impact of DevOps across organizations of different sizes—small, medium, and large—as well as across four distinct performance profiles—low, medium, high, elite. There will be variation in these measurements based on your team’s current performance, compensation, change fail rate, benefits multiplier, and deployments per year, so we share our methodology in the white paper and invite you to customize the approach based on your specific needs and constraints. ROI of DevOps TransformationROI of DevOps Transformation: How to quantify the impact of your modernization initiativesYears of DORA research show that undertaking a technology transformation initiative can produce sizable returns for any organization. Our goal with the white paper is to provide IT and business decision makers an industry backed, data driven foundational basis for determining their investment in DevOps. Download the white paper here to calculate the impact of DevOps on your organization, while driving your digital transformation. Related ArticleRead Article
Quelle: Google Cloud Platform

Lifecycle of a container on Cloud Run

Editor’s note: Today’s post comes from  Wietse Venema, a software engineer and trainer at Binx.io and the author of the O’Reilly book about Google Cloud Run. In today’s post, Wietse shares how understand the full container lifecycle, and the possible state transitions within it, so you can make the most of Cloud Run.Serverless platform Cloud Run runs and autoscales your container-based application.  You can make the most of this platform when you understand the full container lifecycle and the possible state transitions within it. Let’s review the states, from starting to stopped. First, some context for those who have never heard of Cloud Run before (if you have, skip down to “Starting a Container”). The developer workflow on Cloud Run is a straightforward, three-step process:Write your application using your favorite programming language. Your application should start an HTTP server. Build and package your application into a container image. Deploy the container image to Cloud Run. Once you deploy your container image, you’ll get a unique HTTPS endpoint back. Cloud Run then starts your container on demand to handle requests and ensures that all incoming requests are handled by dynamically adding and removing containers. Explore the hands-on quickstart to try it out for yourself. It’s important to understand the distinction between a container image and a container. A container image is a package with your application and everything it needs to run; it’s the archive you store and distribute. A container represents the running processes of your application.You can build and package your application into a container image in multiple ways. Docker gives you low-level control and flexibility. Jib and Buildpacks offer a higher-level, hands-off experience. You don’t need to be a container expert to be productive with Cloud Run, but if you are, Cloud Run won’t be in your way. Choose the containerization method that works best for you and your project.Starting a ContainerWhen a container starts, the following happens:Cloud Run creates the container’s root filesystem by materializing the container image. Once the container filesystem is ready, Cloud Run runs the entrypoint program of the container (your application).  While your application is starting, Cloud Run continuously probes port 8080 to check whether your application is ready. (You can change the port number if you need to.)Once your application starts accepting TCP connections, Cloud Run forwards incoming HTTP requests to your container.Remember, Cloud Run can only deploy container images that are stored in a Docker repository on Artifact Registry. However, it doesn’t pull the entire image from there every time it starts a new container. That would be needlessly slow. Instead, Cloud Run pulls your container image from Artifact Registry only once, when you deploy a new version (called a revision on Cloud Run). It then makes a copy of your container image and stores it internally.The internal storage is fast, ensuring that your image size is not a bottleneck for container startup time. Large images load as quickly as small ones. That’s useful to know if you’re trying to improve cold start latency. A cold start happens when a request comes in and no containers are available to handle it. In this case, Cloud Run will hold the request while it starts a new container. If you want to be sure a container is always available to handle requests, configure minimum instances, which will help reduce the number of cold starts.  Because Cloud Run copies the image, you won’t get into trouble if you accidentally delete a deployed container image from Artifact Registry. The copy ensures that your Cloud Run service will continue to work. Serving RequestsWhen a container is not handling any requests, it is considered idle. On a traditional server, you might not think twice about this. But on Cloud Run, this is an important state:An idle container is free. You’re only billed for the resources your container uses when it is starting, handling requests (with a 100ms granularity), or shutting down.  An idle container’s CPU is throttled to nearly zero. This means your application will run at a really slow pace. That makes sense, considering this is CPU time you’re not paying for. When your container’s CPU is throttled, however, you can’t reliably perform background tasks on your container. Take a look at Cloud Tasks if you want to reliably schedule work to be performed later. When a container handles a request after being idle, Cloud Run will unthrottle the container’s CPU instantly. Your application — and your user — won’t notice any lag. Cloud Run can keep idle containers around longer than you might expect, too, in order to handle traffic spikes and reduce cold starts. Don’t count on it, though. Idle containers can be shut down at any time.Shutting DownIf your container is idle, Cloud Run can decide to stop it. By default, a container just disappears when it is shut down. However, you can build your application to handle a SIGTERM signal (a Linux kernel feature). The SIGTERM signal warns your application that shutdown is imminent. That gives the application 10 seconds to clean things up before the container is removed, such as closing database connections or flushing buffers with data you still need to send somewhere else. You can learn how to handle SIGTERMs on Cloud Run so that your shutdowns will be graceful rather than abrupt.So far, I’ve looked at Cloud Run’s happy state transitions. What happens if your application crashes and stops while it is handling requests? When Things Go WrongUnder normal circumstances, Cloud Run never stops a container that is handling requests. However, a container can stop suddenly in two cases: if your application exits (for instance due to an error in your application code) or if the container exceeds the memory limit. If a container stops while it is handling requests, it takes down all its in-flight requests at that time: Those requests will fail with an error. While Cloud Run is starting a replacement container, new requests might have to wait. That’s something you’ll want to avoid.You can avoid running out of memory by configuring memory limits. By default, a container gets 256MB of memory on Cloud Run, but you can increase the allocation to 4GB. Keep in mind, though, if your application allocates too much memory, Cloud Run will also stop the container without a SIGTERM warning.SummaryIn this post, you learned about the entire lifecycle of a container on Cloud Run, from starting to serving and shutting down. Here are the highlights: Cloud Run stores a local copy of your container image to load it really fast when it starts a container.A container is considered idle when it is not serving requests. You’re not paying for idle containers, but their CPU is throttled to nearly zero. Idle containers can be shut down. With SIGTERM you can shut down gracefully, but it’s not guaranteed to happen. Watch your memory limits and make sure errors don’t crash your application. I’m a software engineer and trainer at Binx.io and the author of the O’Reilly book about Google Cloud Run (read the full chapter outline). Connect with me on Twitter: @wietsevenema (open DMs).Related ArticleTrigger Cloud Run with events from more than 60 Google Cloud sourcesNow, you can invoke applications running on Cloud Run with events generated by over 60 Google Cloud services.Read Article
Quelle: Google Cloud Platform

New white paper: Strengthening operational resilience in financial services by migrating to Google Cloud

Operational resilience continues to be a key focus for financial services firms. Regulators from around the world are refocusing supervisory approaches on operational resilience to support the soundness of financial firms and the stability of the financial ecosystem. Our new white paper discusses the continuing importance of operational resilience to the financial services sector, and the role that a well-executed migration to Google Cloud can play in strengthening it. Here are the key highlights: Operational resilience in financial servicesFinancial services firms and regulators are increasingly focused on operational resilience, reflecting the growing dependency that the financial services industry has on complex systems, automation and technology, and third parties. Operational resilience can be defined as the “ability to deliver operations, including critical operations and core business lines, through a disruption from any hazard”1. Given this definition, operational resilience needs to be thought of as a desired outcome, instead of a singular activity, and as such, the approach to achieving that outcome needs to address a multitude of operational risks including: Cybersecurity: Continuously adjusting key controls, people, processes and technology to prevent, detect and react to external threats and malicious insiders.Pandemics: Sustaining business operations in scenarios where people cannot, or will not, work in close proximity to colleagues and customers.Environmental and Infrastructure: Designing and locating facilities to mitigate the effects of localised weather and infrastructure events, and to be resilient to physical attacks.Geopolitical: Understanding and managing risks associated with geographic and political boundaries between intragroup and third-party dependencies.Third-party Risk: Managing supply chain risk, and in particular of critical outsourced functions by addressing vendor lock in, survivability and portability.Technology Risk: Designing and operating technology services to provide the required levels of availability, capacity, performance, quality and functionality. Operational resilience benefits from migrating to Google CloudThere is a growing recognition among policymakers and industry leaders that, far from creating unnecessary new risk, a well-executed migration to public cloud technology over the coming years will provide capabilities to financial services firms that will enable them to strengthen operational resilience in ways that are not otherwise achievable.  Foundationally, Google Cloud’s infrastructure and operating model is of a scale and robustness that can provide financial services customers a way to increase their resilience in a highly commercial way.Equally important are the Google Cloud products, and our support for hybrid and multi-cloud, that help financial services customers manage various operational risks in a differentiated manner:Cybersecurity that is designed in, and from the ground up. From encryption by default, to our Titan security chip, to high-scale DOS defences, to the power of Google Cloud data analytics and Security Command Center our solutions help you secure your environment.Solutions that decouple employees and customers from physical offices and premises. This includes zero-trust based remote access that removes the need for complex VPNs, rapidly deployed customer contact center AI virtual agents, and Google Workspace for best-in-class workforce collaboration.Globally and regionally resilient infrastructure, data centers and support. We offer a global footprint of 24 regions and 73 zones allowing us to serve customers in over 200 countries, with a globally distributed support function so we can support customers even in adverse circumstances.Strategic autonomy through appropriate controls. Our recognition that customers and policymakers, particularly in Europe, strive for even greater security and autonomy is embodied in our work on data sovereignty, operational sovereignty, and software sovereignty.Portability, substitutability and survivability, using our open cloud. We understand that from a financial services firm’s perspective, achieving operational resilience may include solving for situations where their third parties are unable, for any reason, to provide the services contracted.Reducing technical debt, whilst focusing on great financial products and services. We provide a portfolio of solutions so that financial services firms’ technology organisations can focus on delivering high-quality services and experiences to customers, and not on operating foundational technologies such as servers, networks and mainframes.We are committed to ensuring that Google Cloud solutions for financial services are designed in a manner that best positions the sector in all aspects of operational resilience. Furthermore, we recognize that this is not simply about making Google Cloud resilient: the sector needs autonomy, sovereignty and survivability. You can learn more about Google Cloud’s point of view on operational resilience in financial services by downloading the white paper.1. “Sound Practices to Strengthen Operational Resilience”, FRB, OCC, FDIC
Quelle: Google Cloud Platform

New Docker and JFrog Partnership Designed to Improve the Speed and Quality of App Development Processes

Today, Docker and JFrog announced a new partnership to ensure developers can benefit from integrated innovation across both companies’ offerings. This partnership sets the foundation for ongoing integration and support to help organizations increase both the velocity and quality of modern app development. 

The objective of this partnership is simple: how can we ensure developers can get the images they want and trust, and make sure they can access them in whatever development process they are using from a centralized platform? To this end, the new agreement between Docker and JFrog ensures that developers can take advantage of their Docker Subscription and Docker Hub Official Images in their Artifactory SaaS and on-premise environments so they can build, share and run apps with confidence.

At a high level, a solution based on the Docker and JFrog partnership looks like this: 

In this sample architecture, developers can build apps with images, including Docker Official Images and images from popular OSS projects and software companies, from Docker Hub. As images are requested, they are cached into JFrog Artifactory, where images can be managed by corporate policies, cached for high performance, and mirrored across an organization’s infrastructure. Also, the images in Artifactory can take advantage of other features in the JFrog suite, including vulnerability scanning, CI/CD pipelines, policies and more. All without limits.

This is an exciting first for Docker, as the partnership with JFrog opens up new ways of integrating leading tools to improve outcomes for developers. With integration across Docker Hub and Artifactory, premier access to the trusted high-quality Docker Official Images in Docker Hub, and secure, central access to images in Artifactory, we believe this partnership will bring immediate results to our developer communities including:

More value to Docker Subscription users with tight integration into private repositoriesPremier access to trusted, high-quality images from Docker HubCentral access to Docker Official Images in ArtifactoryStreamlined application development workflows

But this is just the beginning. Over the coming months, we are working to keep improving the integration and connection here to bring new capabilities and productivity improvements to modern app developers. You can get started now! If you are an Artifactory user you will see the benefits of premier access to Docker Hub images right away. You can learn more about the announcement from the JFrog blog here. And, you can get technical details and how-to information from JFrog documentation.
The post New Docker and JFrog Partnership Designed to Improve the Speed and Quality of App Development Processes appeared first on Docker Blog.
Quelle: https://blog.docker.com/feed/

New Docker Reporting Provides Teams with Tools for Higher Efficiency and Better Collaboration

Today, we are very excited to announce the release of Audit Log, a new capability that provides the administrators of Docker Team subscription accounts with a chronological report of their team activities. The Audit Log is an unbiased system of record, displaying all the status changes for Docker organizations, teams, repos and tags.  As a tracking tool for all the team activities, it creates a central historical repository of actionable insights to diagnose incidents, provide a record of app lifecycle milestones and changes, and provides a view into events creating audit trails for regulatory compliance reviews.  The Audit Log is available for Team subscription accounts, and at this point, is not included with Free or Pro subscriptions.

Some typical scenarios where Audit Log will play a key role include:  

When several team members are collaborating on delivering a project, Audit Log creates a list of activities that becomes a ‘source of truth’ to validate which tags got deleted and which tags got pushed into repos, when these activities happened and which team members triggered them. Audit Log provides knowledge base continuity, delivering information on projects completed earlier when new team members need to familiarize themselves with work done by people that have already moved on to their new challenges.For security audits, Audit Log provides a clear demarcation timestamp, indicating when private repos become public or public repos become private.  And, it provides evidence for organizations that go through routine regulatory compliance audits.    

How to get the activity insights from Docker

The feature is now available today for every Docker Team account. We will report on the activities that happen after the feature release. Docker will store the activity data for up to 6 months, and the log will not report on activities that were generated before that time.  To view the Audit Log, select your Organization View and click on the Activity Tab. 

By default, the Activity tab displays all the activities that occur during the current day.  At this point, use the calendar option to select the desired date range for your log report.

Once you decide on the date range, the log will show you the list of all the activities that occur during that time period.

Now that we have selected a date range, let’s select which activities you want to review.  The left side of the tab has a dropdown, with the default selection set to display All Activities.  The drop-down allows two filtering options –to view only Organization or Repository level activities.  Selecting the Organization filter shows another drop-down that lists all the organization level activities.  Similarly, selecting the Repository filter provides a list of repository level activities.  

Organization level activities include these events:

EventDescriptionTeam CreatedShows username of the person creating the team, team name and timestamp for when the team was createdTeam DeletedShows username of the person deleting the team, team name and timestamp for when the team was deletedTeam Member AddedShows username of the person adding the team member, username of the member added to the team, team name and timestamp for when the team member was addedTeam Member RemovedShows username of the person removing the team member, username of the member removed from the team, team name and timestamp for when the team member was removedTeam Member InvitedShows username of the person inviting the team member, username of the member invited to the team, team name and the timestamp for when the team member was invitedOrganization Member RemovedShows username of the person removing organization member, username of the member being removed, organization name and the timestamp of the removalOrganization CreatedShows username of the person creating organization, organization name and timestamp for when the team was created

Repository level activities include these events:

EventDescriptionRepository CreatedShows username of the person creating repository, indication if repository is public or private, repository name and timestamp for when the repo was createdRepository DeletedShows username of the person deleting repository, indication if repository is public or private, repository name and timestamp for when the repo was deletedPrivacy ChangedShows username of the person making privacy changes, repository name, status that privacy setting is changed to and timestamp for when the change was madeTag PushedShows username of the person pushing the tag, tag name, tag digest, repository where tag is pushed to and timestamp for the tag pushTag DeletedShows username of the person deleting the tag, tag name, repository where tag is deleted from and timestamp for tag deletion

Selecting a specific Activity shows a list of all the selected activities that occur during the selected date range.

At the Organization level, you can view all the activities occurring at the organization level. Once you have selected the Activity filters, you can view all the selected activities that happened during the selected range. Or, you can view only activities within a specific repo by clicking on the Activity Tab within that repo. 

If you already have a Docker Team subscription, take a look at all the activities that your team has accomplished today.  The feature is included with all Docker Team subscriptions; no other action is necessary on your part.

Not a Docker Team subscriber? Upgrade or Sign up for a Docker Team subscription and begin taking advantage of this new team-focused feature. You can get more information about Docker subscriptions on the Pricing Page. 
The post New Docker Reporting Provides Teams with Tools for Higher Efficiency and Better Collaboration appeared first on Docker Blog.
Quelle: https://blog.docker.com/feed/