Lieferengpass: Verbraucherschützer mahnen Saturn wegen PS5 ab
Bezahlt, aber keine Playstation 5 geliefert bekommen: Verbraucherschützer drohen mit einer Klage gegen Saturn. (Saturn, Microsoft)
Quelle: Golem

Bezahlt, aber keine Playstation 5 geliefert bekommen: Verbraucherschützer drohen mit einer Klage gegen Saturn. (Saturn, Microsoft)
Quelle: Golem

BMW will keine Auto-Flatrate mehr anbieten und stellt sein Monatsabo Access by BMW ein. Andere Hersteller sind schon längst raus. (BMW, Technologie)
Quelle: Golem

Autos mit aufgesetzten Kameras sollen die Berliner Straßen abfotografieren und scannen – diesmal für die Berliner Behörden. (Berlin, Technologie)
Quelle: Golem
hackernoon.com – Back in 2001 an ideological battle was raging: Linux and open source against Microsoft and proprietary enterprise software (the then-standard model). At the peak of the battle Microsoft’s then-CEO St…
Quelle: news.kubernauts.io
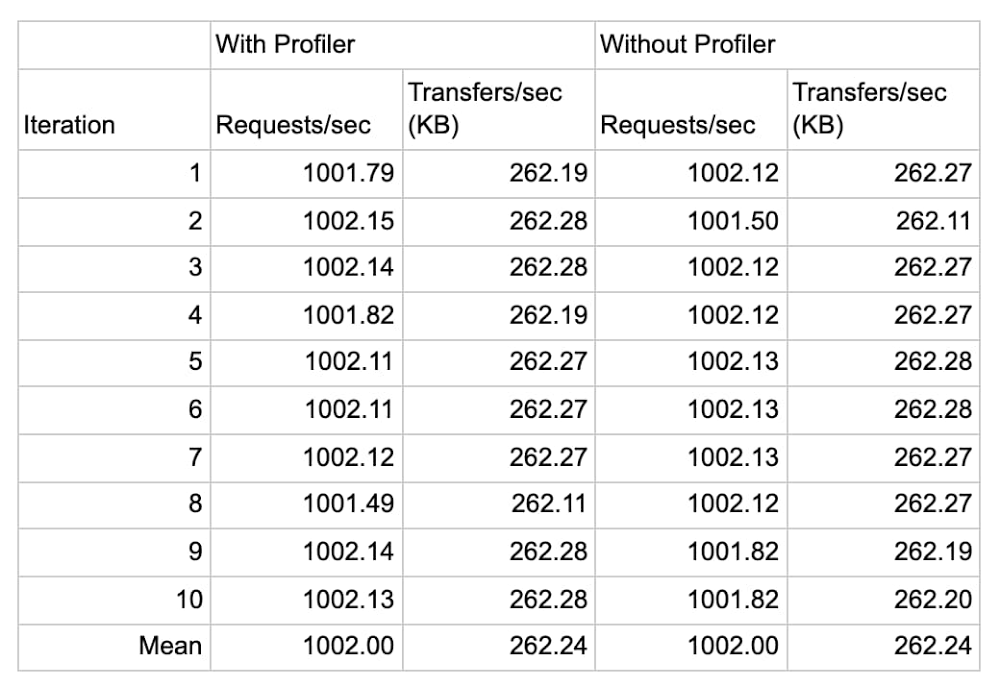
Do you have an application that’s a little… sluggish? Cloud Profiler, Google Cloud’s continuous application profiling tool, can quickly find poor performing code that slows your app performance and drives up your compute bill. In fact, by helping you find the source of memory leaks and other errors, Profiler has helped some of Google Cloud’s largest accounts reduce their CPU consumption by double-digit percentage points. What makes Profiler so useful is that it aggregates production performance data over time from all instances of an application, while placing a negligible performance penalty on the application that you are examining—typically less than 1% CPU and RAM overhead on a single profiled instance, and practically zero when it’s amortized over the full collection duration and all instances of the service!In this blog post, we look at elements of Profiler’s architecture that help it achieve its light touch. Then, we demonstrate the negligible effect of Profiler on an application in action by using DeathStarBench, a sample hotel reservation application that’s popular for testing loosely coupled microservices-based applications. Equipped with this understanding, you’ll have the knowledge you need to enable Profiler on those applications that could use a little boost. Profiler vs. other APM toolsTraditionally, application profiling tools have imposed a heavy load on the application, limiting the tools’ usefulness. Profiler, on the other hand, uses several mechanisms to ensure that it doesn’t hurt application performance. Sampling and analyzing aggregate performanceTo set up Profiler, you need to link a provided language-specific library to your application. Profiler uses this library to capture relevant telemetry from your applications that can then be analyzed using the user interface of the tool. Cloud Profiler supports applications written in Java, Go, Node.js and Python.Cloud Profiler’s libraries sample application performance, meaning that they periodically capture stack traces that represent the CPU and heap consumption of each function. This behavior is different from an event-tracing profiler, which intercepts and briefly halts every single function call to record performance information. To ensure your service’s performance is not impacted, Profiler carefully orchestrates the interval and duration of the profile collection process. By aggregating data across all of the instances of your application over a period of time, Profiler can provide a complete view into production code performance with negligible overhead.Roaming across instancesThe more instances of each service from which you capture profiles, the more accurately Cloud Profiler can analyze your codebase. While each Profiler library / agent uses sampling to reduce the performance impact on a running instance, Profiler also ensures that only one task in a deployment is being profiled at a given time. This ensures that your application is never in a state where all instances are being sampled at the same time.Profiler in actionTo measure the effect of Profiler on an application, we used it with an application with known performance characteristics, the DeathStarBench hotel reservation sample application. The DeathStarBench services were designed to test the performance characteristics of different kinds of infrastructure, service topologies, RPC mechanisms, and service architecture on overall application performance, making them an ideal candidate for these tests. While this particular benchmark is written in Go and uses the Go profiling agent, we expect results for other languages to be similar, since Profiler’s approach to sampling frequency and profiling is similar for all languages that it supports.In this example, we ran the eight services that compose the hotel reservation application on a GCE c2-standard-4 (4 vCPUs, 16 GB memory) VM instance running Ubuntu 18.04.4 LTS Linux and configured the load generator for two series of tests: one at 1,000 queries per second, and one at 10,000. We then performed each test 10 times with Profiler attached to each service and 10 times without it, and recorded the service’s throughput and the CPU and memory consumption in Cloud Monitoring. Each iteration ran for about 5 minutes, for a total of about 50 minutes for 10 iterations.The following data shows the result of the 1,000 QPS run:In the first test we observe that Profiler introduces a negligible increase in CPU (less than 0.5%) consumption and a minor increase in memory consumption, averaging to roughly 32 MB (3.7%) of additional RAM usage across eight services, or just under 4 MB per service. The following data shows the result of the 10,000 QPS run:In the second test, we see that Profiler’s only impact on application is in line with the previous observations that the increase in memory consumption is roughly 23 MB (2.8%) of memory, or 3MB per service, and a negligible increase in CPU (less than 0.5%) consumption.In both tests, the increase in memory usage can be attributed to the increase in the application’s binary size after linking with the Profiler agent.In exchange, you gain deep insight into code performance, down to each function call, as shown here for the hotel reservation application:Here we use Profiler to analyze the memory usage of the benchmark’s “frontend” service. We utilize Profiler’s weight filter and weight comparison features to determine the functions that increased their memory usage while the application scaled from 1,000 QPS to 10,000 QPS, which are highlighted in orange.ConclusionIn short, Profiler introduces no discernible impact on an application’s performance, and a negligible impact on CPU and memory consumption. And in exchange, it lets you continuously monitor the production performance of your services without affecting their performance or incurring any additional costs! That’s a win-win, in our book. To learn more about Profiler, be sure to read this Introduction to Profiler, and this blog about its advanced features. Related ArticleSee how your code actually executes with Stackdriver Profiler, now GACloud monitoring is now even better, as Stackdriver Profiler is now generally available from Google Cloud Platform (GCP).Read Article
Quelle: Google Cloud Platform
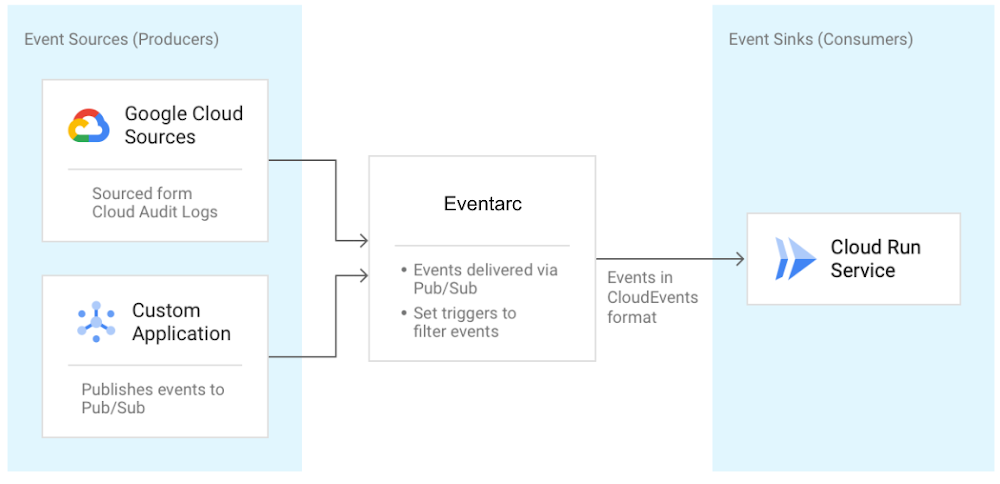
I recently talked about orchestration versus choreography in connecting microservices and introduced Workflows for use cases that can benefit from a central orchestrator. I also mentioned Eventarc and Pub/Sub in the choreography camp for more loosely coupled event-driven architectures. In this blog post, I talk more about the unified eventing experience by Eventarc. What is Eventarc?We announced Eventarc back in October as a new eventing functionality that enables you to send events to Cloud Run from more than 60 Google Cloud sources. It works by reading Audit Logs from various sources and sending them to Cloud Run services as events in CloudEvents format. It can also read events from Pub/Sub topics for custom applications.Getting events to Cloud RunThere are already other ways to get events to Cloud Run, so you might wonder what’s special about Eventarc? I’ll get to this question, but let’s first explore one of those ways, Pub/Sub.As shown in this Using Pub/Sub with Cloud Run tutorial, Cloud Run services can receive messages pushed from a Pub/Sub topic. This works if the event source can directly publish messages to a Pub/Sub topic. It can also work for services that have integration with Pub/Sub and publish their events through that integration. For example, Cloud Storage is one of those services and in this tutorial, I show how to receive updates from a Cloud Storage bucket using a Pub/Sub topic in the middle. For other services with no integration to Pub/Sub, you have to either integrate them with Pub/Sub and configure Pub/Sub to route messages to Cloud Run or you need to find another way of sourcing those events. It’s possible but definitely not trivial. That’s where Eventarc comes into play. Immediate benefits of Eventarc Eventarc provides an easier path to receive events not only from Pub/Sub topics but from a number of Google Cloud sources with its Audit Log and Pub/Sub integration. Any service with Audit Log integration or any application that can send a message to a Pub/Sub topic can be event sources for Eventarc. You don’t have to worry about the underlying infrastructure with Eventarc. It is a managed service with no clusters to set up or maintain. It also has some concrete benefits beyond the easy integration. It provides consistency and structure to how events are generated, routed, and consumed. Let’s explore those benefits next.Simplified and centralized routingEventarc introduces the notion of a trigger. A trigger specifies routing rules from event sources to event sinks. For example, one can listen for new object creation events in Cloud Storage and route them to a Cloud Run service by simply creating an Audit Log trigger as follows:If you want to listen for messages from Pub/Sub instead, that’s another trigger:This trigger creates a Pub/Sub topic under the covers. Applications can send messages to that topic and those messages are routed to the specified Cloud Run service by Eventarc. Users can also create triggers from Google Cloud Console under the triggers section of Cloud Run:By having event routing defined as triggers, users can list and manage all their triggers in one central place in Eventarc. Here’s the command to see all created triggers:gcloud beta eventarc triggers listConsistency with eventing format and librariesIn Eventarc, different events from different sources are converted to CloudEvents compliant events. CloudEvents is a specification for describing event data in a common way with the goal of consistency, accessibility and portability. A CloudEvent includes context and data about the event: Event consumers can read these events directly. We also try to make it easier in various languages (Node.js, Python, Go, Java, C# and more) with CloudEvents SDKs to read the event and Google Events libraries to parse the date field.Going back to our Cloud Storage example earlier, this is how you’d read Cloud Storage events via AuditLogs in Node.js using the two mentioned libraries:Similarly, this is how you’d read messages from a Pub/Sub trigger in C#: Long term visionThe long term vision of Eventarc is to be the hub of events from more sources and sinks, enabling a unified eventing story in Google Cloud and beyond.In the future, you can expect to read events directly (without having to go through Audit Logs) from more Google Cloud sources (eg. Firestore, BigQuery, Storage), Google sources (eg. Gmail, Hangouts, Chat), 3rd party sources (eg. Datadog, PagerDuty) and send these events to more Google Cloud sinks (eg. Cloud Functions, Compute Engine, Pub/Sub) and custom sinks (any HTTP target). Now that you have a better overall picture of the current state and future vision for Eventarc:Check out Trigger Cloud Run with events from Eventarc for a hands-on codelab. Send us feedback on Eventarc and which sources and sinks you would value the most.As always, feel free to reach out to me on Twitter @meteatamel for questions.Related ArticleTrigger Cloud Run with events from more than 60 Google Cloud sourcesNow, you can invoke applications running on Cloud Run with events generated by over 60 Google Cloud services.Read Article
Quelle: Google Cloud Platform
As we start the new year, we see ongoing revelations about an attack involving SolarWinds and others, that in turn led to the compromise of numerous other organizations. Software supply chain attacks like this pose a serious threat to governments, companies, non-profits, and individuals alike. At Google, we work around the clock to protect our users and customers. Based on what is known about the attack today, we are confident that no Google systems were affected by the SolarWinds event. We make very limited use of the affected software and services, and our approach to mitigating supply chain security risks meant that any incidental use was limited and contained. These controls were bolstered by sophisticated monitoring of our networks and systems. Beyond this specific attack, we remain focused on defending against all forms of supply chain risk and feel a deep responsibility to collaborate on solutions that benefit our customers and the common good of the industry. That’s why today we want to share some of the security best practices we employ and investments we make in secure software development and supply chain risk management. These key elements of our security and risk programs include our efforts to develop and deploy software safely at Google, design and build a trusted cloud environment to deliver defense-in-depth at scale, advocate for modern security architectures, and advance industry-wide security initiatives. To protect the software products and solutions we provide our cloud customers, we have to mitigate potential security risks, no matter how small, for our own employees and systems. To do this, we have modernized the technology stack to provide a more defensible environment that we can protect at scale. For example, modern security architectures like BeyondCorp allow our employees to work securely from anywhere, security keys have effectively eliminated password phishing attacks against our employees, and Chrome OS was built by design to be more resilient against malware. By building a strong foundation for our employees to work from, we are well-prepared to address key issues, such as software supply chain security. Many of these topics are covered more extensively in our book Building Secure and Reliable Systems.How we develop and deploy software and hardware safely at Google Developing software safely starts with providing secure infrastructure and requires the right tools and processes to help our developers avoid predictable security mistakes. For example, we make use of secure development and continuous testing frameworks to detect and avoid common programming mistakes. Our embedded security-by-default approach also considers a wide variety of attack vectors on the development process itself, including supply chain risks. A few examples of how we tackle the challenge of developing software safely: Trusted Cloud Computing: Google Cloud’s infrastructure is designed to deliver defense-in-depth at scale, which means that we don’t rely on any one thing to keep us secure, but instead build layers of checks and controls that includes proprietary Google-designed hardware, Google-controlled firmware, Google-curated OS images, a Google-hardened hypervisor, as well as data center physical security and services. We provide assurances in these security layers through roots of trust, such as Titan Chips for Google host machines and Shielded Virtual Machines. Controlling the hardware and security stack allows us to maintain the underpinnings of our security posture in a way that many other providers cannot. We believe that this level of control results in reduced exposure to supply chain risk for us and our customers. More on our measures to mitigate hardware supply chain risk can be found in this blog post. Binary Authorization: As we describe in our Binary Authorization whitepaper, we verify, for example, that software is built and signed in an approved isolated build environment from properly checked-in code that has been reviewed and tested. These controls are enforced during deployment by policy, depending on the sensitivity of the code. Binaries are only permitted to run if they pass such control checks, and we continuously verify policy compliance for the lifetime of the job. This is a critical control used to limit the ability of a potentially malicious insider, or other threat actor using their account, to insert malicious software into our production environment. Google Cloud customers can use the Binary Authorization service to define and automatically enforce production deployment policy based on the provenance and integrity of their code. Change Verification: Code and configuration changes submitted by our developers are provably reviewed by at least one person other than the author. Sensitive administrative actions typically require additional human approvals. We do this to prevent unexpected changes, whether they’re mistakes or malicious insertions. Reshaping the ecosystemWe also believe the broader ecosystem will need to reshape its approach to layered defense to address supply chain attacks long-term. For example, software development teams should adopt tamper-evident practices paired with transparency techniques that allow for third-party validation and discoverability. We have published an architectural guide to adding tamper checking to a package manager, and this is implemented for Golang. Developers can make use of our open-source verifiable Trillian log, which powers the world’s largest, most used and respected production crypto ledger-based ecosystem, certificate transparency.Another area for consideration is limiting the effects of attacks by using modern computing architectures that isolate potentially compromised software components. Examples of such architectures are Android OS’s application sandbox, gVisor (an application sandbox for containers), and Google’s BeyondProd where microservice containerization can limit the effects of malicious software. Should any of the upstream supply-chain components in these environments become compromised, such isolation mechanisms can act as a final layer of defense to deny attackers their goals.Our industry commitment and responsibility The software supply chain represents the links across organizations—an individual company can only do so much on their own. We need to work together as an industry to change the way software components are built, distributed and tracked throughout their lifecycle. One example of collaboration is the Open Source Security Foundation, which Google co-founded last year to help the industry tackle issues like software supply chain security in open source dependencies and promote security awareness and best practices. We also work with industry partners to improve supply chain policies and reduce supply chain risk, and publish information for users and customers on how they can use our technology to manage supply chain risk. Pushing the software ecosystem forwardAlthough the history of software supply chain attacks is well-documented, each new attack reveals new challenges. The seriousness of the SolarWinds event is deeply concerning but it also highlights the opportunities for government, industry, and other stakeholders to collaborate on best practices and build effective technology that can fundamentally improve the software ecosystem. We will continue to work with a range of stakeholders to address these issues and help lay the foundation for a more secure future.Related ArticleMitigating risk in the hardware supply chainGoogle hardware, software, and services are built with security as a primary design concern. Learn more about the steps we take to secure…Read Article
Quelle: Google Cloud Platform
In our first blog post in this series, we talked broadly about the democratization of data and insights. Our second blog took a deeper look at insights derived specifically from machine learning, and how Google Cloud has worked to push those capabilities to more users across the data landscape. In our third and final blog in this series, we’ll examine data access, data insights, and machine learning in the context of real-time decision making, and how we’re working to help all users – business and technical – get access to real-time insights.Getting real about real-time data analysisLet’s start by taking a look at real-time data analysis (also referred to as stream analytics) and the blend of factors that increasingly make it critical to business success. First, data is increasingly real-time in nature. IDC predicts that by 2025, more than 25% of all data created will be real-time in nature. We predict the number of business decisions being made at Google Cloud based on real-time data will be even higher than that. What’s driving that growth? There are a number of factors that represent an overall trend towards digitization in not just business, but society in general. These factors include, but aren’t limited to, digital devices, IoT-enabled manufacturing and logistics, digital commerce, digital communications, and digital media consumption. Harnessing the real-time data created by these activities gives companies the opportunity to better analyze their market, competition, and importantly, customers.Next, customers expect more than ever in terms of personalization; they expect to be a “segment of one” across recommendations, offers, experience, and more. Companies know this and compete with each other to deliver the best user and customer experience possible. Google Cloud customers such as AB Tasty are processing billions of real-time events for millions of users each day to deliver just that for their clients—an experience that’s optimized for smaller and smaller segments of users.With our new data pipeline and warehouse, we are able to personalize access to large volumes of data that were not previously there. That means new insights and correlations and, therefore, better decisions and increased revenue for customers. Jean-Yves Simon, VP Product, AB TastyFinally, real-time analysis is most useful when there’s an opportunity to take quick actions based on the insights. The same digitization driving real-time data generation provides an opportunity to drive immediate action in an instant feedback loop. Whether the action involves on-the-spot recommendations for digital retail, rerouting delivery vehicles based on real-time traffic information, changing the difficulty of an online gaming session, digitally recalibrating a manufacturing process, stopping fraud before a transaction is completed, or countless other examples, today’s technology opens up the opportunity to drive a more responsive and efficient business.Democratizing real-time data analysisWe think of democratization in this space in two different frames. One is the standard frame we’ve taken in this blog series of expanding the capabilities of various data practitioners: “how do we give more users the ability to generate real-time insights?” The other frame, specifically for stream analytics, is democratization at the company level. Let’s start with how we’re helping more businesses move to real-time, and then we’ll dive into how we’re helping across different users.Democratizing stream analytics for all businesses Historically, collecting, processing, and acting upon real-time data was particularly challenging. The nature of real-time data is that its volume and velocity can vary wildly in many use cases, creating multiple layers of complexity for data engineers trying to keep the data flowing through their pipelines. The tradeoffs involved in running a real-time data pipeline led many engineers to implement a lambda architecture, in which they would have both a real-time copy of (sometimes partial) results as well as a “correct” copy of results that took a traditional batch route. In addition to presenting challenges in reconciling data at the end of these pipelines, this architecture multiplied the number of systems to manage, and typically increased the number of ecosystems these same engineers had to manage. Setting this up, and keeping it all working, took large teams of expert data engineers. It kept the bar for use cases high.Google and Google Cloud knew there had to be a better way to analyze real-time data… so we built it! Dataflow, together with Pub/Sub, answers the challenges posed by traditional streaming systems by providing a completely serverless experience that handles the variation in event streams with ease. Pub/Sub and Dataflow scale to exactly what resources are needed for the job at hand, handling performance, scaling, availability, security, and more—all automatically. Dataflow ensures that data is reliably and consistently processed exactly once, so engineers can trust the results their systems produce. Dataflow jobs are written using the Apache Beam SDK, which provides programming language choice for Dataflow (in addition to portability). Finally, Dataflow also allows data engineers to easily switch back and forth between both batch streaming modes, meaning users can experiment between real-time results and cost-effective batch processing with no changes to the code.Google unifies streaming analytics and batch processing the way it should be. No compromises. That must be the goal when software architects create a unified streaming and batch solution that must scale elastically, perform complex operations, and have the resiliency of Rocky Balboa. The Forrester Wave™, Streaming Analytics, Q3 2019, by Mike Gualtieri, Forrester Research, Inc.All together, Dataflow and Pub/Sub deliver an integrated, easy-to-operate experience that opens real-time analysis up to companies that don’t have large teams of expert data engineers. We’ve seen small teams of as few as six engineers processing billions of events per day. They can author their pipelines, and leave the rest to us.Democratizing stream analytics for all personasHaving developed a streaming platform that made streaming available to data engineering teams of all sizes and skills, we set about making it easier for more people to access real-time analysis and drive better decisions as a result. Let’s dive into how we’ve expanded access to real-time analytics.Business and data analystsProviding access to real-time data for data analysts and business analysts starts with enabling data to be rapidly ingested into the data warehouse. BigQuery is designed to be “always fast, always fresh,” and it enables streaming inserts into the data warehouse at millions of events per second. This gives data warehouse users the ability to work on the very freshest data, making their analysis more timely and accurate.In addition to the insights that data analysts typically drive out of the data warehouse, analysts can also apply machine learning capabilities delivered by BigQuery ML against real-time data being streamed in. If data analysts know there’s a source of data that they need to access but that isn’t currently in the warehouse, Dataflow SQL enables them to connect new streaming sources of data with a few simple lines of SQL. The real-time capabilities we describe for data analysts have cascading effects for the business analysts who rely on dashboards sourced from the data warehouse. BigQuery’s BI Engine enables sub-second query response and high concurrency for BI use cases, but including real-time data in the data warehouse gives business analysts (and those who rely on them) a fuller picture of what’s happening in the business right now. In addition to BI, Looker’s data-driven workflows and data application capabilities benefit from fast-updating data in BigQuery. ETL DevelopersData Fusion, Google Cloud’s code-free ETL tool, delivers real-time processing capabilities to ETL developers with the simplicity of flipping a switch. Data Fusion users can easily set their pipelines to process data in real-time and land it into any number of storage or database services at Google Cloud. Further, Data Fusion’s ability to call upon a number of predefined connectors, transformations, sinks, and more – including machine learning APIs – and to do so in real-time gives businesses an impressive level of flexibility without the need to write any code at all.Wrapping upEach blog in this series (catch up on Part 1 and Part 2 if you missed them) has shown how Google Cloud can democratize data and insights. It’s not enough to deliver data access, then simply hope for good things to happen within your business. We’ve observed a clear formula for successfully democratizing the generation of ideas and insights throughout your business:Start by ensuring you can deliver broad access to data that’s relevant to your business. That means moving towards systems that have elastic storage and compute with the ability to automatically scale both. This will enable you to bring in new data sources and new data workers without the need for labor-intensive operations, increasing the agility of your business.Ensure that users can generate insights from within the tools they know and are comfortable with. By delivering new capabilities to existing users within their tools, you can help your business put data to work across the organization. Further, this will keep your workforce excited and engaged as they get to explore new areas of analysis like machine learning.Once you’ve given your employees the ability to access data and the ability to drive insights from the data, give them the ability to analyze real-time data and automate the outcomes of that analysis. This will drive better customer experiences, and help your organization take faster advantage of opportunities in the market.We hope you’ve enjoyed this series, and we hope you’ll consider working with us to help democratize data and insights within your business. A great way to get started is by starting a free trial or jumping into the BigQuery sandbox, but don’t hesitate to reach out if you want to have a conversation with us.The Forrester Wave™, Streaming Analytics, Q3 2019
Quelle: Google Cloud Platform

Noch vor Rocket Lake wird es neue Hauptplatinen für die kommenden Intel-CPUs geben, die erstmals natives USB 3.2 Gen2x2 unterstützen. (Intel Rocket Lake, Prozessor)
Quelle: Golem

Ein Codefragment in der jüngsten iOS-Beta zeigt, dass Apple seine Nutzer offenbar weiter von inoffiziellen Reparaturen abbringen will. (Apple, Digitalkamera)
Quelle: Golem