Compute Engine explained: How to orchestrate your patch deployment

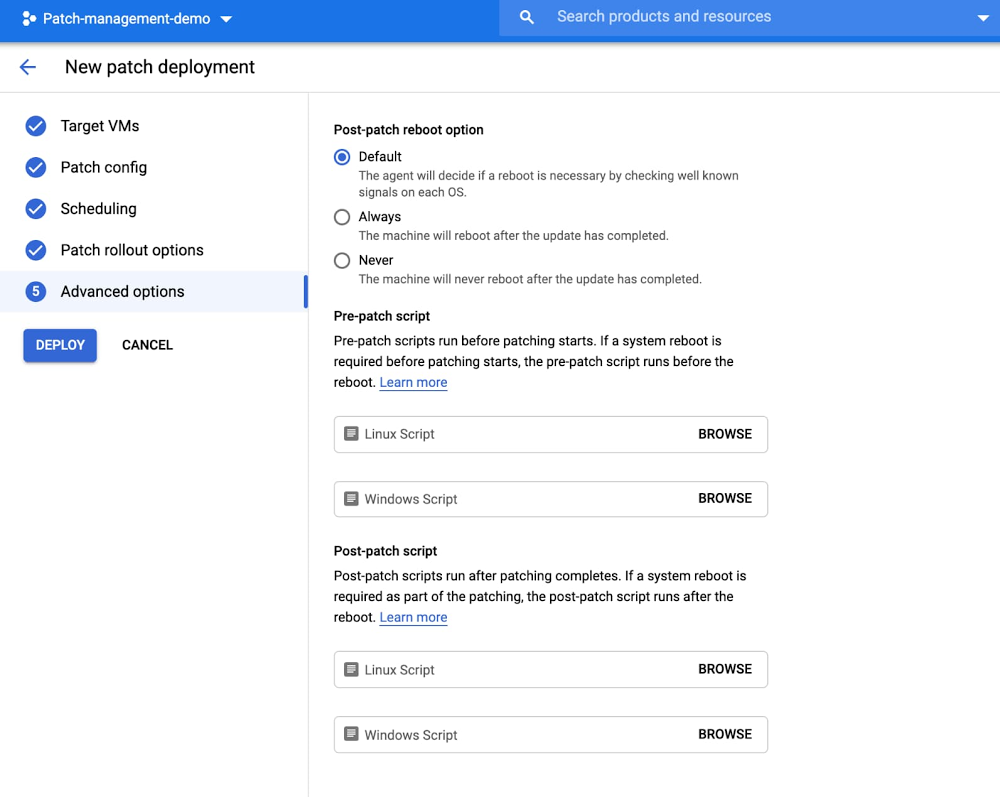
In April, we announced the general availability of Google Cloud’s OS patch management service to protect your running VMs against defects and vulnerabilities. This service works on Compute Engine and across Windows and Linux OS environments. In this blog, we share how to orchestrate your patch deployment using pre-patch and post-patch scripts.What are pre-patch and post-patch scripts?When running a patch job, you can specify the scripts that you want to run as part of the patching process. These scripts are useful for performing tasks such as safely shutting down an application and performing health checks:Pre-patch scripts run before patching starts. If a system reboot is required before patching starts, the pre-patch script runs before the reboot.Post-patch scripts run after patching completes. If a system reboot is required as part of the patching, the post-patch script runs after the reboot.Note: A patch deployment is not executed if the pre-patch script fails, which can be an important safeguard feature for customers before deploying patches on their machines. If the post-patch script fails in any VM, the patch job is marked as failed.  Why pre-patch and post-patch scripts?By reducing the risk of downtime, patch management can be one of the most important determiners in the security of your entire IT system, as well as for end-user productivity. To successfully automate the complete end-to-end patching process, you as the patch administrator may need to customize these scripts for your environment and workload. For example, as part of your patch deployment process, you might want to run health checks before or after patching to make sure your services and applications are running as expected. There are lots of other scenarios where a pre-patch or post-patch script might be useful.Scenarios that can be automated using a pre-patch scriptTaking a VM out of load balance before patchingDraining users from an application server instance before they perform maintenance on the server or take it offlineEnsuring the VM is in a state that is safe to patchScenarios that can be automated using a post-patch script Checking if all your services and applications are running after a patch jobPerforming health checksPutting a VM back into the load balancer after patchingHow to enable pre-patch and post-patch scripts on Compute EngineSetting up pre-patch and post-patch scripts for your Compute Engine environment is a straightforward process.1. During a new patch deployment, select Advanced options to add your pre-patch and / or post-patch script. These script files can either be stored on the VM or in a versioned Cloud Storage bucket:If your Cloud Storage object is not publicly readable, ensure that the default Compute Engine service account for the project has the necessary IAM permissions to read Cloud Storage objects. To ensure that you have the correct permissions, check the permission settings on the Cloud Storage object.If you want to use a Cloud Storage bucket to store your scripts, create a Cloud Storage bucket and upload your scripts to the bucket.2. Select your pre- or post-patch script from the Cloud Storage bucket or local driveNote that you can select one pre-patch and post-patch script that runs on all targeted Linux VMs and one pre-patch and post-patch script that runs on all targeted Windows VMs.Patch your Compute Engine VMs todayWith this done, orchestrating your patch deployment using pre / post steps on Compute Engine should now be easy to execute. To learn more about the OS patch management service, including automating your patch deployment, visit the documentation.
Quelle: Google Cloud Platform

Understanding the fundamentals of tagging in Data Catalog

Google Cloud Data Catalog is a fully managed and scalable metadata management service. Data Catalog helps your organization quickly discover, understand, and manage all your data from one simple interface, letting you gain valuable business insights out of your data investments. One of Data Catalog’s core concepts, called tag templates, helps you organize complex metadata while making it searchable under Cloud Identity and Access Management ( Cloud IAM) control. In this post, we’ll offer some best practices and useful tag templates (referred to as templates from here) to help you start your journey.Understanding Data Catalog templatesA tag template is a collection of related fields that represent your vocabulary for classifying data assets. Each field has a name and a type. The type can be a string, double, boolean, enumeration, or datetime. When the type is an enum, the template also stores the possible values for this field. The fields are stored as an unordered set in the template and each field is treated as optional unless marked as required. A required field means that a value must be assigned to this field each time the template is in use. An optional field means it can be left out when an instance of this template is created. You’ll create instances of templates when tagging data resources, such as BigQuery tables and views. Tagging means associating a tag template with a specific resource and assigning values to the template fields to describe the resource. We refer to these tags as structured tags because the fields in these tags are typed as instances of the template. Typed fields let you avoid common misspellings and other inconsistencies, a known pitfall with simple key value pairs. Organizing templatesTwo common questions we hear about Data Catalog templates are: What kind of fields should go into a template and how should templates be organized? The answer to the first question really depends on what kind of metadata your organization wants to keep track of and how that metadata will be used. There are various metadata use cases, ranging from data discovery to data governance, and the requirements for each one should drive the contents of the templates. Let’s look at a simple example of how you might organize your templates. Suppose the goal is to make it easier for analysts to discover data assets in a data lake because they spend a lot of time searching for the right assets. In that case, create a Data Discovery template, which would categorize the assets along the dimensions that the analysts want to search. This would include fields such as data_domain, data_owner, creation_date, etc. If the data governance team wants to categorize the assets for data compliance purposes, you can create a separate template with governance-specific fields, such as data_retention, data_confidentiality, storage_location, etc. In other words, we recommend creating templates to represent a single concept, rather than placing multiple concepts into one template. This avoids confusing those who are using the templates and helps the template administrators maintain them over time. Some clients create their templates in multiple projects, others create them in a central project, and still others use both options. When creating templates that will be used widely across multiple teams, we recommend creating them in a central project so that they are easier to track. For example, a data governance template is typically maintained by a central group. This group might meet monthly to ensure that the fields in each template are clearly defined and decide how to handle requirements for additional fields. Storing their template in a central project makes sense for maintainability. When the scope of the template is restricted to one team, such as a data discovery template that is customized to the needs of one data science team, then creating the template in that team’s project makes more sense. When the scope is even more restricted, say to one individual, then creating the template in their personal project makes more sense. In other words, choose the storage location of a template based on its scope. Access control for templatesData Catalog offers a wide range of permissions for managing access to templates and tags. Templates can be completely private, only visible to authorized users (through the tag template viewer role), as well as visible and used by authorized users for creating tags (through the tag template user role). When a template is visible, authorized users can not only view the contents of the template, but also search for assets that were tagged using the template (as long as they also have access to view those underlying assets). You can’t search for metadata if you don’t have access to the underlying data. To obtain read access to the cataloged assets, they would need to be granted the Data Catalog Viewer role; alternately, the BigQuery Metadata Viewer role can be used if the underlying assets are stored in BigQuery. In addition to the viewer and user roles, there is also the concept of a template creator (via the tag template creator role) and template owner (via the tag template owner role). The creator can only create new templates, while the owner has complete control of the template, which includes rights to delete it. Deleting a template has the ripple effect of deleting all the tags created from the template. For creating and modifying tags, use the tag editor role. This role should be used in conjunction with a tag template role so that users can access the templates from which to tag.   Billing considerations for templatesThere are two components to Data Catalog’s billing: metadata storage and API calls. For storage, projects in which templates are created incur the billing charges pertaining to templates and tags. They are billed for their templates’ storage usage even if the tags created from those templates are on resources that reside in different projects. For example, project A owns a Data Discovery template and project B uses this template to tag its own resources in BigQuery. Project A will incur the billing charges for Project B’s tags because the Data Discovery template resides in project A. From an API calls perspective, the charges are billed to the project selected when the calls are made for searching, reading, and writing. More details on pricing are available from the product documentation page.    Prebuilt templatesAnother common question we hear from potential clients is: Do you have prebuilt templates to help us get started with creating our own? Due to the popularity of this request, we created a few examples to illustrate the types of templates being deployed by our users. You can find them in YAML format below and through a GitHub repo. There is also a script in the same repo that reads the YAML-based templates and creates the actual templates in Data Catalog. Data governance templateThe data governance template categorizes data assets based on their domain, environment, sensitivity, ownership, and retention details. It is intended to be used for data discovery and compliance with usage policies such as GDPR and CCPA. The template is expected to grow over time with the addition of new policies and regulations around data usage and privacy.Derived data templateThe derived data template is for categorizing derivative data that originates from one or more data sources. Derivative data is produced through a variety of means, including Dataflow pipelines, Airflow DAGs, BigQuery queries, and many others. The data can be transformed in multiple ways, such as aggregation, anonymization, normalization, etc. From a metadata perspective, we want to broadly categorize those transformations as well as keep track of the data sources that produced it. The parents field in the template is for storing the uris of the origin data sources and is populated by the process producing the derived data. It is declared as a string because complex types are not supported by Data Catalog as of this writing.Data quality templateThe data quality template is intended to store the results of various quality checks to help in assessing the accuracy of the underlying data. Unlike the previous two templates, which are attached to a whole table, this one is attached to a specific column of a table. This would typically be an important numerical column that is used by critical business reports. As Data Catalog already ingests the schema of BigQuery tables through its technical metadata, this template omits the data type of the column and stores only the results of the quality checks. The quality checks are customizable and can easily be implemented in BigQuery.Data engineering templateThe data engineering template is also attached to individual columns of a table. It is intended for describing how those columns are mapped to the same data in a different storage system. Its goal is to support database replication scenarios such as warehouse migrations to BigQuery, continuous real-time replication to BigQuery, and replication to a data lake on Cloud Storage. In those scenarios, data engineers want to capture the mappings between the source and target columns of tables for two primary reasons: facilitate querying the replicated data, which usually has a different schema in BigQuery than the source; and capture how the data is being replicated so that replication issues can be more easily detected and resolved.You can now use Data Catalog structured tags to bring together all your disparate operational and business metadata, attach them to your data assets and make them easily searchable. To learn more about tagging in Data Catalog, try out our quickstart for tagging tables.
Quelle: Google Cloud Platform
Extended retention for custom and Prometheus metrics in Cloud Monitoring

Metrics help you understand how your business and applications are performing. Longer metric retention enables quarter-over-quarter or year-over-year analysis and reporting, forecasting seasonal trends, retention for compliance, and much more. We recently announced the general availability (GA) of extended metric retention forcustom andPrometheus metrics in Cloud Monitoring, increasing retention from 6 weeks to 24 months. Extended retention for custom and Prometheus metrics is enabled by default.Longer retention is particularly useful in financial services, retail, healthcare, and media organizations. For example, a finance team could use the extended data to forecast seasonal trends, so that you know how many Compute Engine instances to reserve ahead of time for Black Friday. Similarly, a DevOps team could use year over year data to help inform a scaling plan for Cyber Monday.To achieve higher charting performance, Cloud Monitoring stores metric data for 6 weeks at its original sampling frequency, then downsamples it to 10-minute intervals for extended storage. This ensures that you can view extended retention metrics but still query with high performance. There is no additional cost for extended retention (see Cloud Monitoring chargeable services which is based on volume ingestion for specific metric types). Extended retention for Google Cloud (system) metrics, agent metrics, and other metric types is coming soon.How to query extended retention metricsLet’s take an example scenario where you have a Compute Engine VM running a web application. In that web app, you write a metric that tracks a critical user journey for which you want to perform a month-over-month analysis.To query metric data for a month-over-month comparison, go to Cloud Monitoring and select Metrics Explorer. Select your custom or Prometheus metric and the resource type. Then click on “Custom” in the time range selector above the chart. Previously the time-range selector only allowed you to select up to 6 weeks of metric data; now you can select up to 24 months.Querying extended retention metric data for custom and Prometheus metrics in Cloud Monitoring Metrics ExplorerThe Custom time range selector lets you query metric data that is up to 24 months oldIn addition to the UI, you can also perform the above query steps programmatically through theListTimeSeries endpoint of the Monitoring API.The above query lets you view metric data values for a given time range. But how do you compare results month over month?To perform time shift analysis, you can use the Cloud Monitoring Query Language, which recently became generally available.Let’s take the example of a custom metric that tracks request counts for a shopping cart service in an e-commerce application. The following query returns the overall mean request counts now and from a month ago. Using “union”, you can display these two results on the same chart. Note: the resource and metric specified below are an example; to use it in your environment, replace them with your own custom or Prometheus metric.To enter the query, go to Metrics Explorer and click the “Query Editor” button:Enter the above query, click “Run Query”, and you’ll see a result like the following:Extending the usefulness of metricsWith Cloud Monitoring, we give you visibility into your data and help you to understand the health and performance of your services and applications. Extended metric retention helps your DevOps, engineering, and business teams with troubleshooting and debugging, compliance, reporting, and many other use cases. It allows you to do real-time operations and long-term data analysis in a single tool, without needing to export to another data analytics tool. If you have any questions or feedback, please click Help > Send Feedback in the Cloud Monitoring UI or contact Cloud Support. We also invite you to join the discussion on our mailing list. As always, we welcome your feedback.
Quelle: Google Cloud Platform

MySQL 8 is ready for the enterprise with Cloud SQL

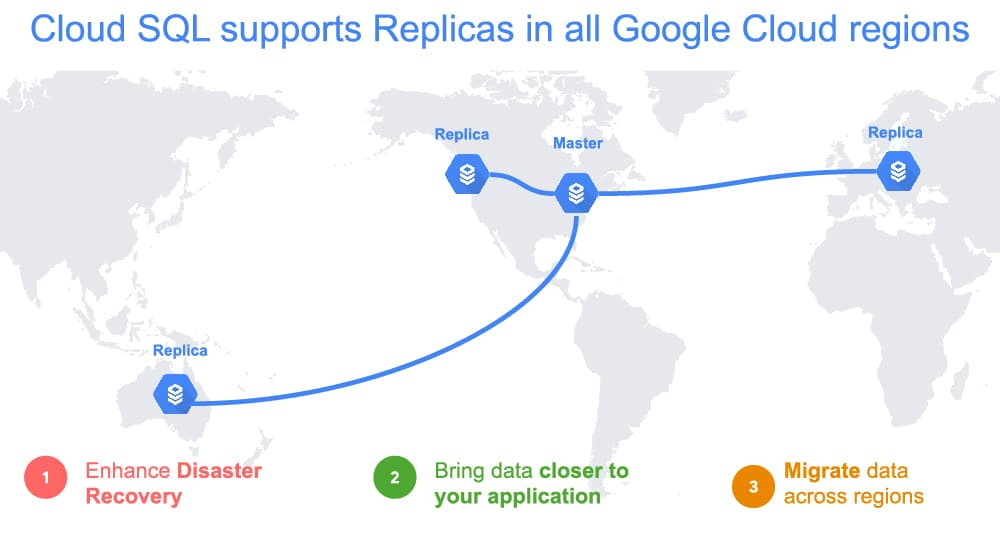
Today, we’re announcing that Cloud SQL, our fully managed database service for MySQL, PostgreSQL, and SQL Server, now supports MySQL 8. This means you get access to a variety of powerful new features—such as instant DDL statements (e.g. ADD COLUMN), atomic DDL, privilege collection using roles, window functions, and extended JSON syntax – to help you be more productive. And, as a managed service, we’ll ensure your MySQL 8 deployments help you stay stable and more secure. You’ll get automatic patches and updates, as well as our maintenance controls so you can reduce the risk associated with upgrades. More so, we’ve fully integrated it with Cloud SQL’s high availability configuration and security controls, to make sure your MySQL 8 database instance is enterprise ready.High availability and Disaster RecoveryConsidering a wide variety of failure scenarios, from localized problems to widespread issues, is an important party of business continuity planning. With MySQL 8 on Cloud SQL, you enable high availability (HA) to ensure your database workloads are automatically fault tolerant in the event of an instance-level problem or even a zone outage. We’ve worked closely with Cloud SQL customers facing business continuity challenges to simplify their experience with support for cross-region replication. Cross region replication for MySQL 8 is supported in all Google Cloud regions.SecurityCloud SQL is designed to provide multiple layers of security without complexity, whether you’re looking to protect your data or comply with regulations. Encryption of data is a foundational control, which is why Cloud SQL encrypts data at rest by default. For organizations that have sensitive or regulated data, we offer customer-managed encryption keys (CMEK) to support compliance with regulatory requirements and maintain control of your own encryption keys.To secure connectivity to your MySQL 8 instance, you can use private services access and VPC Service Controls. Private services access gives your database instance a private IP address, using Google Cloud VPC. Because VPCs are global, creating a cross-region replica requires no networking setup. Global VPC uses private IP for replication traffic between regions—helping to eliminate the need for complex VPN and VPC configuration, which would otherwise be needed to set up cross-region networking. With VPC Service Controls, you can define fine-grained perimeter controls to make your Cloud SQL API accessible only from within your service perimeter.Ready to build?Combine powerful availability and these security features to quickly build a scalable and fault tolerant application, using the Cloud SQL Proxy, our connection management integration with Google Kubernetes Engine (GKE). The Cloud SQL Proxy automatically encrypts connections without the need to manually configure SSL and makes connecting from GKE easy. With more than than 500,000 proxy instances deployed on GKE, this is a popular option. See for yourself by building an application with our Codelab.Can I apply my Committed Use Discounts?We built Committed Use Discounts so you attain the savings you expect—no matter how you configure your resources or which database you select. The discounts also apply to usage from all versions supported by Cloud SQL, including MySQL 8. Feel free to start using MySQL 8 and know that you don’t need to make any manual changes or updates to realize savings from your existing Committed Use Discounts.What’s next for Cloud SQLSupport for MySQL 8 has been a top request from users. We’re committed to compatibility and bringing you more frequent version updates in the future. We’re also committed to making sure new database versions are fully integrated with the Cloud SQL platform so you can run your most sensitive and critical applications. Have more ideas? Let us know what other features and capabilities you need with our Issue Tracker and by joining the Cloud SQL discussion group. We’re glad you’re along for the ride, and we look forward to your feedback!
Quelle: Google Cloud Platform