Dataflow Under the Hood: understanding Dataflow techniques

Editor’s note: This is the second blog in a three-part series examining the internal Google history that led to Dataflow, how Dataflow works as a Google Cloud service, and how it compares and contrasts with other products in the marketplace. Check out part 1: Dataflow Under the Hood: the origin story.In the first post in this series, we explored the genesis of Dataflow within Google, and talked about how it compares to Lambda Architectures. Now, let’s look a little closer at some of the key systems that power Dataflow. As mentioned in the first post, we’ve taken advantage of a number of technologies that we had built for previous systems, and also developed some new techniques.The origins of our timer system go back to the original MillWheel system, which provided users with direct access to setting timers for triggering processing logic. Conceptually, these are similar to other scheduling systems, where users set an arbitrary number of alarms, and the system is responsible for triggering those alarms at an appropriate time. For durability, we journal these timers to a backing store (like the Cloud Bigtabledatabase), and cache a subset of them in memory, such that all upcoming timers are in memory, and the cache can be refreshed asynchronously without putting storage reads on the hot path. One subtlety for timers arises from the need to support event time timers, which depend on the completeness of data for previous stages in order to trigger. We call these completion markers watermarks, and they are managed by a separate component, which communicates with all the nodes that are responsible for processing a given stage in order to determine current watermark value. This watermark component then publishes these values to all relevant downstream computations, which can use the watermark to trigger event time timers. To help illustrate why this is important, let’s consider a classic IoT use case—a manufacturing line where the equipment is instrumented with sensors. These sensors will emit reams of data, and the watermarks associated with the data will help group together this data by time, or perhaps by manufacturing run, and ensure we don’t miss data in our analysis just because it came in late or out of order.Understanding state managementState management in Dataflow takes advantage of a number of similar concepts as timers. State is journaled to a durable store, and cached for speed and efficiency. One thing that we learned from our experience with MillWheel was the need to provide useful abstractions for users to interact with state—some applications want to read and write the entirety of the stored state for each incoming record, but others want to read only a subset, or append to a list that is only occasionally accessed in full. In Dataflow, we’ve worked hard to provide relevant state abstractions that are integrated with the right caching and persistence strategies, so that the system is efficient and fast out of the box. We’ve also found it important to commit state modifications in an atomic operation with record processing. Many other systems take the approach of telling users to use an external state system, which is very difficult to get working correctly. Thinking back to the IoT use case we just discussed, Dataflow’s state management features would make it easy—meaning involving trivial amounts of user code—to do things like aggregating and counting equipment revolutions per minute, calculating the average temperature from a sensor over a given period of time, or determining the average deviation from a cutting or molding process without complicated retry logic for interacting with a secondary system.A major reason for the popularity of the Lambda Architecture is the challenges of providing exactly once processing in streaming processing systems (see this blog series for additional details). Dataflow provides exactly once processing for records by storing a fingerprint of each record that enters a given stage, and uses that to deduplicate any retries of that record. Of course, a naive strategy for this would create an unbounded number of fingerprints to check, so we use the watermark aggregator to determine when we can garbage-collect the fingerprints of records that have fully traversed the system. This system also makes ample use of caching, as well as some additional optimizations, including the use of rotating Bloom filters.One final aspect of Dataflow that we’ll touch upon is its ability to support autoscaling of pipeline resources. It is able to support dynamic scaling (both up and down) of both streaming and batch pipelines by having a means of dynamically reallocating the underlying work assignments that power the system. In the case of streaming pipelines, this corresponds to a set of key ranges for each computation stage, which can be dynamically shifted, split, and merged between workers to balance out the load. The system responds to changes in usage by increasing or decreasing the overall number of nodes available, and is able to scale these independently from the disaggregated storage of timers and state. To visit our IoT factory floor example one last time, these autoscaling capabilities would mean that adding more sensors or increasing their signal frequency wouldn’t require the long operations and provisioning cycles you would have needed in the past.Next, be sure to check out the third and final blog in this series, which aims to compare and contrast Dataflow with some of the other technologies available in the market.
Quelle: Google Cloud Platform
Databases that transform businesses—What happened at Google Cloud Next ‘20: OnAir

Week 6 of Google Cloud Next ‘20: OnAir was all about Google Cloud databases and how to choose and use them, no matter where you are in your cloud journey. There was plenty to explore, from deep-dive sessions and demos to feature launches and customer stories. Across it all, what stood out is the strong momentum and adoption across Google Cloud databases for developers and enterprises alike.Google Cloud’s range of databases are designed to help you tackle the unpredictable. Your databases shouldn’t get in the way of innovation and growth, but many legacy, on-prem databases are holding businesses back. We build our databases to meet you at any stage, whether it’s an as-is migration or a brand-new app developed in the cloud.  Key data management announcements this weekThis week, we launched new features aimed at solving the hardest data problems to help our customers run the most mission-critical applications. We kicked off the week with a keynote from Director of Product Management Penny Avril, who talked with social media platform ShareChat about how they met a 500% increase in demand using Cloud Spanner without changing a line of code. We also announced updates to our databases. For Spanner, the Spanner Emulator lets app developers do correctness testing when developing an app. A new C++ client library and increased SQL feature set also add more flexibility. In addition, cloud-native Spanner now offers new multi-region configurations for Asia and Europe with 99.999% availability. NoSQL database service Cloud Bigtable now offers more capabilities, like managed backups for high business continuity and added data protection. And expanded support and SLA for single-node production instances makes it even easier to use Bigtable for all use cases, both large and small. Mobile and web developers use Cloud Firestore to build apps easily, and it now offers a richer query language, C++ client library, and Firestore Unity SDK to make it easy for game developers to adopt Firestore. We are also introducing tools to give you better visibility into usage patterns and performance with Firestore Key Visualizer, which will be coming soon.Cloud SQL, the fully managed service for MySQL, PostgreSQL, and SQL Server, now offers more maintenance controls, cross-region replication, and committed use discounts, providing reliability and flexibility as you migrate to the cloud. For those users running specialized workloads like Oracle, Google Cloud’s Bare Metal Solution enables you to move these workloads within milliseconds of latency to Google Cloud. Our Bare Metal Solution is now available in even more regions and provides a fast track to cloud while lowering overall costs. How customers are building and growing with cloud databasesWe also heard from customers across industries on how they use Google Cloud databases to transform their business, especially in the face of the unpredictable. From The New York Times building a real-time collaborative editor to help publish faster and Khan Academy on how they met the rising demand for online learning to gaming publishers like Colopl supporting massive scale and variable usage through Spanner and ShareChat migrating from Amazon DynamoDB to Spanner for better scale and efficiency at 30% lower costs, it’s exciting to see what they’ve been able to accomplish. Check out data management demosFor data management week, we debuted new interactive demos that let you explore database decisions for yourself. If you’re trying to understand where to start, check out this demo that can help you choose which database is right for you. To see how Cloud SQL lets you achieve high availability, explore this demo. Or learn how you can get a consistent, real-time view of your inventory at scale across channels and regions using Spanner. And take a close look at how Bare Metal Solutions can help you run specialized workloads in the cloud.Go deep with databasesAcross our entire database portfolio, there are sessions to help you better understand each service and what’s new. For SQL Server, MySQL, or Postgres users, check out Getting to Know Cloud SQL for SQL Server or High Availability and Disaster Recovery with Cloud SQL. If it’s cloud-native you’re interested in, sessions like Modernizing HBase Workloads with Cloud Bigtable, Future-proof Your Business for Global Scale and Consistency with Cloud Spanner, or Simplify Complex Application Development Using Cloud Firestore provide deep dives to help you get started.Looking ahead: Application modernizationStay tuned to Next OnAir—next week is all about application modernization. Check out Tuesday’s keynote to learn more about Anthos and how it can help make the most of your on-premises investments and cloud offerings. Of course, we’ll also bring you live technical talks and learning opportunities, aligned with each week’s content. Click “Learn” on the Explore page to find each week’s schedule. Haven’t yet registered for Google Cloud ’20 Next: OnAir? Get started at g.co/cloudnext.
Quelle: Google Cloud Platform

Using Cloud Logging as your single pane of glass

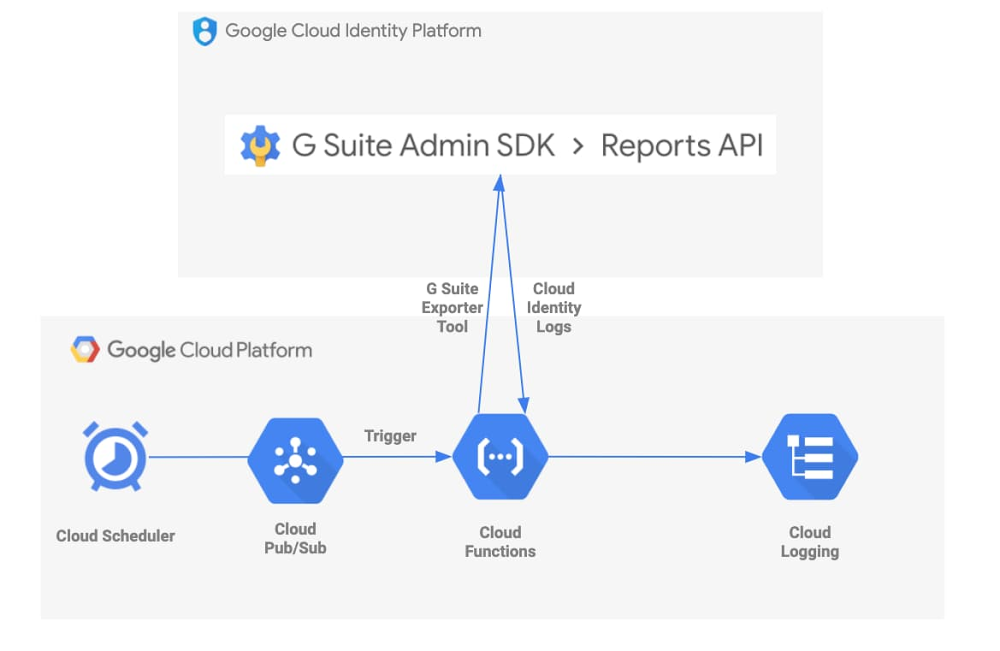
Logs are an essential tool for helping to secure your cloud deployments. In the first post in this series, we explored Cloud Identity logs and how you can configure alerts for potentially malicious activity in the Cloud Identity Admin Console to make your cloud deployment more secure. Today, we’ll take it a step further and look at how you can centralize collection of these logs to view activity across your deployment in a single pane of glass. Our best practices for enterprises using Google Cloud Platform (GCP) encourage customers to centralize log management, operations, searching, and analysis in GCP’s Cloud Logging. However, sometimes customers use services and applications that may not automatically or fully log to Cloud Logging. One example of this is Cloud Identity.Fortunately, there’s a way to get Cloud Identity logs into this central repository by using a Cloud Function that executes the open-source GSuite log exporter tool. A Cloud Scheduler job will trigger the execution of this Cloud Function automatically, on a user-defined cadence. Here’s a visual representation of this flow:Google Cloud Professional Services also provides resources that can help you automate the deployment of the GCP tools involved in this solution. Even better, the services used are fully-managed: no work is required post-deployment.Is this solution right for me? Before proceeding, let’s decide if the tools in this post are right for your organization. Cloud Identity Premium has a feature that lets you export Cloud Identity logs straight to BigQuery. This may be sufficient if your organization only needs to analyze the logs in BigQuery. However, you may want to export the logs to Cloud Logging for retention or further processing as part of your normal logging processes.GCP also has a G Suite audit logging feature which automatically publishes some Cloud Identity logs into Cloud Logging. You can explore which Cloud Identity logs this feature covers in the documentation. The G Suite log exporter tool we will explore in this post provides additional coverage for getting Mobile, OAuth Token, and Drive logs into Cloud Logging, and also allows the user to specify exactly which logs they want to ingest from Cloud Identity.If either of these situations are relevant to your organization, keep reading!The tools we useThe G Suite log exporter is an open-source tool developed and maintained by Google Cloud Professional Services. It handles exporting data from Cloud Identity by calling G Suite’s Reports API. It specifies Cloud Logging on GCP as the destination for your logs, grabs the Cloud Identity logs, does some cleanup and reformatting, and writes to Cloud Logging using the Cloud Logging API.One way to run this tool is to spin up a virtual machine using Google Compute Engine. You could import and execute the tool as a Python package and set up a cronjob that runs the tool on a cadence. We even provide a Terraform module that will automate this setup for you. It seems simple enough, but there are some things you must consider if you take this path, including how to secure your VM and what project and VPC it belongs to. An alternative approach is to use Google-managed services to execute this code. Cloud Functions gives you a serverless platform for event-based code execution—no need to spin up or manage any resources to run the code. Cloud Scheduler is Google’s fully managed enterprise-grade cronjob scheduler. You can integrate a Cloud Function with a Cloud Scheduler job so that your code executes automatically on a schedule, per the following steps:Create a Cloud Function that subscribes to a Cloud Pub/Sub topicCreate a Pub/Sub topic to trigger that functionCreate a Cloud Scheduler job that invokes the Pub/Sub triggerRun the Cloud Scheduler job.We also provide open-source examples that will help you take this approach, using a script or a Terraform module. Post-deployment, the Cloud Function will be triggered by the recurring Cloud Scheduler job, and the GSuite log exporter tool will execute indefinitely. That’s it! You now have up-to-date Cloud Identity logs in Cloud Logging. And since we’re using fully-managed GCP services, there’s no further effort required.Customizing the solutionThe open-source examples above can also be customized to fit your needs. Let’s take a look at the one that uses a script.In this example, the default deploy.sh script creates a Cloud Scheduler job that triggers the exporter tool every 15 minutes. But, let’s say your organization needs to pull logs every 5 minutes to meet security requirements. You can simply change the “–schedule” flag in this file so that the exporter tool is fired as often as you’d like. The cadence is defined in unix-cron format.You may also want to customize main.py to control which specific Cloud Identity logs you grab. Our example pulls every log type currently supported by the exporter tool: Admin activity, Google Drive activity, Login activity, Mobile activity, and OAuth Token activity. The log types are defined in the sync_all function call in this file. Simply edit the “applications=” line (Line 34) to customize the log types you export (see below).Next stepsA few minutes after running the script or executing the Terraform module, you will have a Cloud Function deployed that automatically pulls the logs you want from Cloud Identity and puts them into Cloud Logging on a schedule you define. Now you can integrate them into your existing logging processes: send them to Cloud Storage for retention, to BigQuery for analysis, or to a Pub/Sub topic to be exported to a destination such as Splunk.A Cloud Function integrated with a Cloud Scheduler job is a simple but effective way to collect Cloud Identity logs into Cloud Logging, so that your Google Cloud logs live behind a single pane of glass. The fully managed and easy-to-deploy examples we discussed today free up resources and time so your organization can further focus on keeping your cloud safe.
Quelle: Google Cloud Platform

Bucket list: Better log storage and management for Cloud Logging

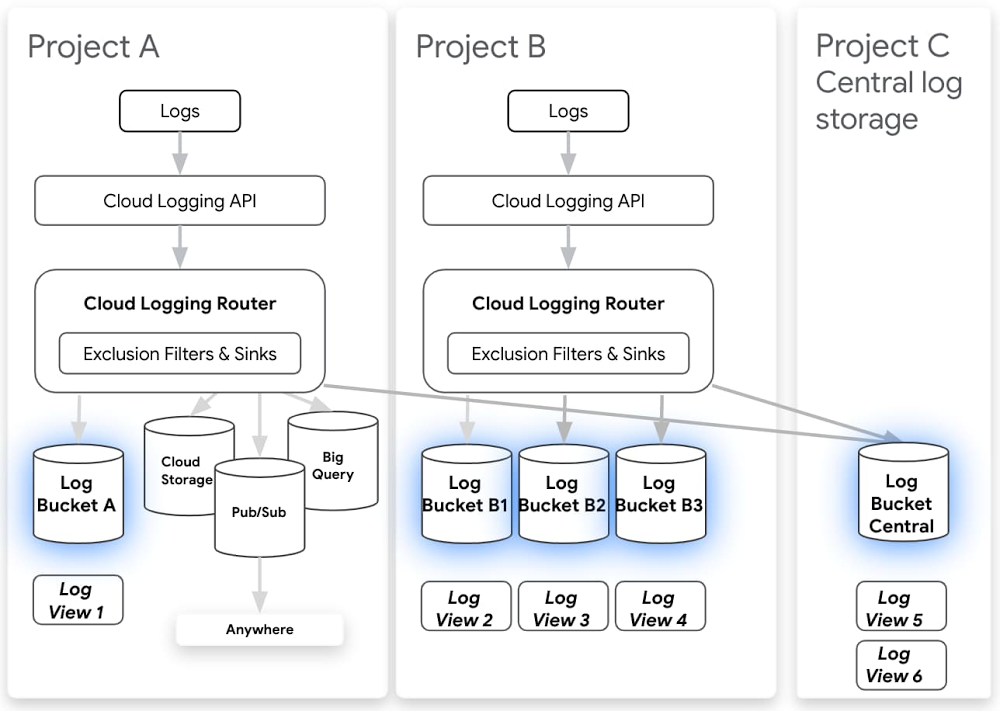
As more organizations move to the cloud, the volume of machine generated data has grown exponentially and is increasingly important for many teams. Software engineers and SREs rely on logs to develop new applications and troubleshoot existing apps to meet reliability targets. Security operators depend on logs to find and address threats and meet compliance needs. And well structured logs provide invaluable insight that can fuel business growth. But first logs must be collected, stored and analyzed with the right tools, and many organizations have found they can be expensive to store and difficult to manage at scale.Our goal for Google Cloud Logging has always been to make logging simpler, faster, and more useful for our customers. That means making it easy to search and analyze logs as well as providing a secure, compliant, and scalable log storage solution. Today we’re announcing a number of improvements to log storage and management, building on several recent improvements for exploring and analyzing logs. Here’s a selection of what’s new:Logs buckets (beta) Logs views (alpha) Regionalized log storage (alpha) Customizable retention (generally available)Cloud Logging Router (generally available – new functionality in beta)Exploring and analyzing logs (generally available)New logs viewerHistogramsField explorer Regular expression support Logging DashboardCloud Logging has been deeply integrated in Google Cloud Platform from the beginning. We automatically collect logs from dozens of Google Cloud services including audit logs, which play a key role in security and compliance. These logs are available right in context from places like Compute Engine, Cloud Functions, App Engine and more to improve development velocity and troubleshooting. Our challenge was to build a logging storage solution that was flexible enough to meet many different organizational needs while preserving the in-context experience and enterprise-class security around logs.We do this by introducing “logs buckets” as a first-class logs storage solution in Cloud Logging. Using logs buckets, you can centralize or subdivide your logs based on your needs. From the name, logs buckets may sound like Cloud Storage buckets, but logs buckets are built on the same logging tech stack we’ve been using to deliver your logs in real time with advanced indexing and optimizations for timestamps so that you can keep benefiting from our logs analytics features. In order to support logs buckets, we’ve also augmented the Cloud Logging router to give you more control over where your logs go. Previously, there were different models to manage which logs went to Cloud Logging vs. other destinations including BigQuery, Cloud Storage and Pub/Sub. Now, you can manage all destinations consistently using log sinks, and all log sinks can also support exclusions, making it easier to configure the logs you want to the right destination. You can also now route logs from one project to another or even use aggregated log sinks from across folders or organization level for security and ease of maintenance.Here are some examples of solutions our alpha customers have built using logs buckets:Log centralization – Centralize all logs from across an organization to a single Cloud Logging project. This solution was so popular among security teams that we’ve put together a dedicated user guide for centralizing audit logs, but you can centralize any or all logs in your org. This allows you to identify patterns and comparisons across projects.Splitting up logs from a single project for GKE multi-tenancy – Send logs from one shared project to other projects owned by individual development teams. One of our alpha customers’ favorite things about logs buckets is that we do magic behind the scenes to look up where your logs are stored. That way, you can, for example, still view those logs for your Kubernetes cluster in the GKE console in project A, even if they’re stored centrally in project B. Get started with this user guide.Compliance-related retention – Logs buckets also allow you to take advantage of advanced management capabilities such as setting custom retention limits or locking a logs bucket so that the retention cannot be modified. We’ve recently launched custom retention to GA and are excited to announce that you can use custom retention through the end of March 2021 for no additional cost. This gives you a chance to try out log management for your long-term compliance and analytics needs for logs without a commitment.Regionalized log storage – You can now keep your logs data in a specific region for compliance purposes. When you create a logs bucket, you can set the region in which you want to store your logs data. Setting the location to global means that it is not specified where the logs are physically stored. The logs bucket beta only supports the global location, but more regions are available in the regionalized logs storage alpha. Sign up for the alpha or to be notified when more regions are publicly available.Another piece of feedback we hear is that you’d like to be able to configure who has access to logs based on the source project, resource type or log name. We’ve also introduced log views so that you can specify which logs a user should have access to, all using standard IAM controls. Logs views can help you build a system using the principle of least privilege, limiting sensitive logs to only users who need this information. While we’ve created logs views automatically for you to preserve limited access to sensitive logs, you’ll soon be able to create your own logs views based on the source project, resource type or log name. If you’d like to try it out in alpha, sign up here.Getting started Having the right logs, and being able to access them easily, is essential for development and operations teams alike. We hope these new Cloud Logging features make it easier for you to find and examine the logs you need. To learn more about managing logs in Google Cloud, check out these resources: OPS100 – Designing for Observability on Google CloudMulti-tenant logging on GKEStoring your organization’s logs in a centralized Logs Bucket
Quelle: Google Cloud Platform

Multi-language Dataflow pipelines enabled by new, faster architecture

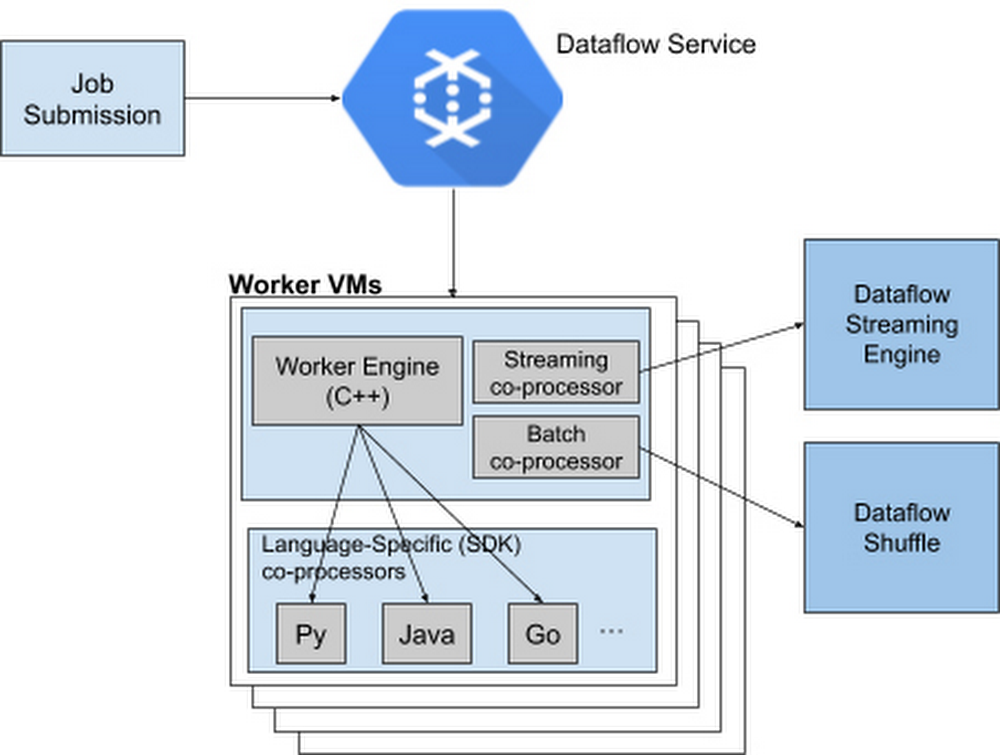
What do you do when your development and data science teams work in different language SDKs or if there are features available in one programming language, but not available in your preferred language? Traditionally, you’d either need to create workarounds that bridge the various languages, or else your team would have to go back and recode. Not only does this cost time and money, it puts real strain on your team’s ability to collaborate.  Introducing Dataflow Runner v2To overcome this, Google Cloud has added a new, more services-based architecture called Runner v2 (available to anyone building a pipeline) to Dataflow that includes multi-language support for all of its language SDKs. This addition of what the Apache Beam community calls “multi-language pipelines” lets development teams within your organization share components written in their prefered language and weave them into a single, high-performance, distributed processing pipeline.This architecture solves the current problem where language-specific worker VMs (called Workers) are required to run entire customer pipelines. If features or transforms are missing for a given language, they must be duplicated across various SDKs to ensure parity; otherwise, there will be gaps in feature coverage and newer SDKs like Apache Beam Go SDK will support fewer features and exhibit inferior performance characteristics for some scenarios.Runner v2 includes a more efficient and portable worker architecture rewritten in C++, which is based on Apache Beam’s new portability framework, packaged together with Dataflow Shuffle for batch jobs and Streaming Engine for streaming jobs. This allows us to provide a common feature set going forward across all language-specific SDKs, as well as share bug fixes and performance improvements.Dataflow Runner v2 is available today with Python streaming pipelines. We encourage you to test out Dataflow Runner v2 with your current (non-production) workloads before it is enabled by default on all new pipelines. You do not have to make any changes to your pipeline code to take advantage of this new architecture.Dataflow Runner v2 comes with support for many new features that are not available in the previous Dataflow runner. In addition to support for multi-language pipelines, Dataflow Runner v2 also provides full native support for Apache Beam’s powerful data source framework named Splittable DoFn, and support for using custom containers for Dataflow jobs. Also, Dataflow Runner v2 enables new capabilities for Python streaming pipelines, including Timers, State, and expanded support for Windowing and Triggers. Using Java implementations in PythonApache Beam’s multi-language capabilities are unique among modern-day data processing frameworks, letting Runner v2 make it easy to provide new features simultaneously in multiple Beam SDKs by writing a single language-specific implementation. For example, we have made the Apache Kafka connector and SQL transform from the Apache Beam Java SDK available for use in Python streaming pipelines starting with Apache Beam 2.23. To see it for yourself, check out the Python Kafka connector and the Python SQL transform that utilizes corresponding Java implementations. To use newly supported Python transforms with Dataflow Runner v2, simply install the latest Java Development Kit (JDK) supported by Apache Beam on your computer and use Python transforms in your Dataflow Python streaming pipeline. For example:For more details regarding pipeline setup and usage of the newly supported transforms, see the Apache Beam Python examples for Kafka and SQL transform.How cross-language transforms workUnder the hood, to make Java transforms available to a Dataflow Python pipeline, the Apache Beam Python SDK starts up a local Java service on your computer to create and inject the appropriate Java pipeline fragments into your Python pipeline. The SDK then downloads and stages the necessary Java dependencies needed to execute these transforms.At runtime, the Dataflow Workers will execute the Python and Java code side by side to run your pipeline. And we’re working on making more Java transforms available to Beam Python through the multi-language pipelines framework.Next stepsEnable Runner v2 to realize the benefits of multi-language pipelines and performance improvements in Python pipelinesTry accessing Kafka topics from Dataflow Python pipelines by following this tutorialTry embedding SQL statements in your Dataflow Python pipelines by using this example
Quelle: Google Cloud Platform