Cyberpunk 2077 angespielt: Zwischen Beamtenbestechung und Gunplay mit Wumms
Mit dem Auto von der Wüste bis in die große Stadt: Golem.de hat den Anfang von Cyberpunk 2077 angespielt. Von Peter Steinlechner (Cyberpunk 2077, Rollenspiel)
Quelle: Golem

Mit dem Auto von der Wüste bis in die große Stadt: Golem.de hat den Anfang von Cyberpunk 2077 angespielt. Von Peter Steinlechner (Cyberpunk 2077, Rollenspiel)
Quelle: Golem

Noch kaum ein Industriegerät kann 5G und die Campusnetze sind noch Prototypen. Doch das Interesse sei riesig, erklärt eine Telekom-Expertin. (5G, Telekom)
Quelle: Golem

Derzeit werden Youtube-Videos in Edge wohl teils nicht abgespielt, wenn ein Adblocker installiert ist. Microsoft arbeitet an einer Lösung. (Edge, Microsoft)
Quelle: Golem

In Kalifornien hat Tesla bei den Behörden Pläne für eine Akkuproduktion eingereicht, die nonstop im Schichtbetrieb laufen soll. (Akku, Technologie)
Quelle: Golem

Amazon will unterbinden, dass gefälschte Produkte auf der eigenen Webseite verkauft werden. (Amazon, Wirtschaft)
Quelle: Golem

Der winzige Mini-PC lässt sich sogar mit zwei NVMe-SSDs aufrüsten. (Thinkcentre, Lenovo)
Quelle: Golem

Das aktuelle Updatepaket KB4567523 repariert den Drucker-Spooler in Windows 10. Allerdings stürzt ein anderer Dienst mit Bluescreen ab. (Windows 10, Microsoft)
Quelle: Golem
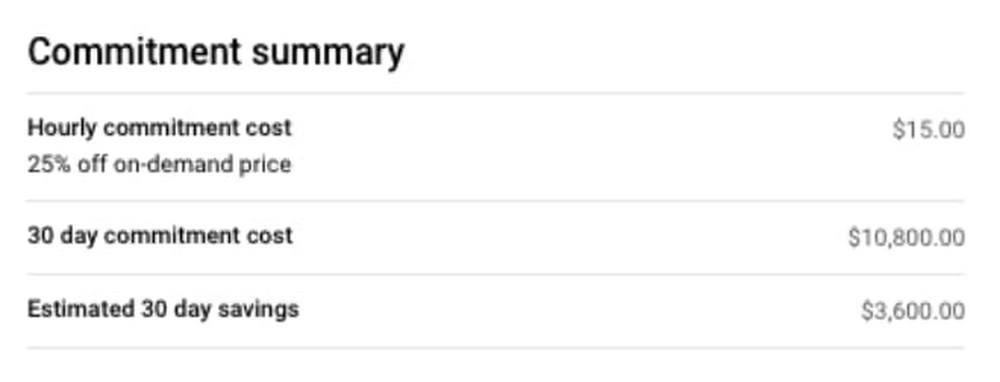
Getting the best price in the cloud shouldn’t require sophisticated forecasting models or unnecessary financial risk. Today, we’re introducing committed use discounts for Cloud SQL, which reward your steady-state, predictable usage in a way that’s easy to use and can accommodate changes in your database environment. Cloud SQL committed use discounts give you a 25% discount off of on-demand pricing for a one-year commitment and a 52% discount off of on-demand pricing for a three-year commitment.These committed use discounts are flexible:No upfront payments are requiredAvailable and able to be shared between MySQL, PostgreSQL, and SQL Server instancesFully transferable between machine sizesWhy is flexibility important? It saves you time by reducing management overhead and maximizes your savings by allowing you to pool more resources and achieve higher utilization.You can see what you’ll save before purchasing using the built-in calculator in the Purchase Commitment dialog of your Google Cloud billing console. Here’s an example:We’re also simplifying our on-demand pricing. Cloud SQL previously offered sustained use discounts, which automatically lower the price of your instances when you use them for a significant portion of the month. Starting today, we’re lowering our list price to the previous sustained use discount price (and removing sustained use discounts). Now, our list price is our best on-demand price, regardless of your usage. These new committed use discounts are applied to this new, lower list price.How this simple and flexible pricing worksWe built committed use discounts so you actually attain the savings you expect—no matter how you configure your resources or which database you select. You commit to a consistent amount of usage, measured in USD per hour of equivalent on-demand spend, for a one- or three-year term. Cloud SQL Committed Use Discounts cannot be applied to licensing, storage, or networking. Instead, these discounts apply to all Cloud SQL database instance CPU and memory usage in the region in which you have committed, except shared CPU machine types (db-f1-micro and db-g1-small). The discounts also apply to usage from all databases supported by Cloud SQL, including MySQL, PostgreSQL, and SQL Server. Committed use discounts automatically apply to aggregate Cloud SQL instance usage in a region, giving you low, predictable costs, without the need to make any manual changes or updates yourself. This flexibility saves you time and helps you to save more by achieving high utilization rates across your commitments, without requiring sophisticated forecasting or imposing constraints on resource configuration.For example, say you run several Cloud SQL for SQL Server database instances for one month with aggregate vCPU and memory consumption of $10,000. Then, the next month, you migrate some of these instances to Cloud SQL for PostgreSQL and change instance sizes. As long as your aggregate resource consumption remains at $10,000, you receive the same discount both months even though your database environment footprint is different.Getting started is easySign in to the Manage billing accounts page in the Google Cloud ConsoleOn the Billing Overview page, look for the What’s new card, then click Purchase Cloud SQL Commitment.Check out our documentation for more details on committed use discounts. For Cloud SQL pricing information, including the new list price, take a look at our pricing page or try out our pricing calculator.Want to learn more about what else is new with Cloud SQL? Be sure to check out our session at Next OnAir. Get started and try Google Cloud for free now.
Quelle: Google Cloud Platform
Get ready. Get set. Get solving. Google Cloud Next ‘20 OnAir kicks off July 14, offering nine full weeks of programming to help you solve your toughest business challenges in the cloud. And the best part is you can join in, for free, no matter where you are, and at a time that works for you. Here’s how to get ready.Watch the keynote with Thomas Kurian on-demand starting July 14We’ll be kicking off Next ‘20 OnAir on July 14 (July 15 in Asia Pacific) with a keynote by Google Cloud CEO Thomas Kurian. Each week thereafter, there’ll be solution keynotes hosted by Google Cloud leaders. This means, for example, you can hear Javier Soltero, VP & GM, G Suite, talk about the future of cloud-native productivity and collaboration, or catch Eyal Manor, GM & VP, Engineering share the latest on app modernization. Find the full list of solution keynotes.Browse the session catalog and create your own playlistEach week during Next we’ll be adding a new batch of breakout sessions you can watch on demand. To plan ahead, you can browse the full session roster, and once you’ve registered for the event and are signed in, you can create your own customized playlist. Click “Filter” to search by speakers, topics, or industries. When you see a session you like, click “Add to playlist” to include it in your all-digital schedule. Toggle “My Playlist” to switch between the full session catalog and just the sessions you’ve bookmarked.Introducing session packagesOnly interested in a specific topic or learning area? Our curated session packages are an easy way to get recommendations on what to watch.Cloud in practiceAI for technologistsApplication developmentCost managementData analyticsData engineeringData security, disaster recovery, and backupMigrationSupporting high performance computing workloadsFor business leadersAI for business leadersBusiness continuityDigital transformationCloud essentials for business leadersWorkforce productivityFor startupsStartups: IntroductoryStartups: AdvancedBy industryFinancial servicesGamingHealthcareManufacturingMedia & entertainmentPublic sector: EducationPublic sector: GovernmentRetailTelecommunicationsStart your learning journeyWe’ve created a unique learning series for technical practitioners of all experience levels. Each week, we’ll focus on a different theme to help you boost your skills–from the fundamentals to more advanced topics, including infrastructure, analytics, AI, and more. You can find our full schedule of learning content on our Learning Hub.If you’re new to Google Cloud, or brushing up on the basics, join us during our weekly Cloud Study Jam where experts will walk you through relevant training and certification resources, lead you through hands-on labs, and answer your questions live.Attending a Cloud Study Jam event will also prepare you to earn your first skill badge on Qwiklabs. Digital skill badges allow you to demonstrate your growing Google Cloud-recognized skillset and share your progress with your network. You can earn the badges by completing a series of hands-on labs, including a final assessment challenge lab, to test your skills.Once you’re more confident in your skills, join our weekly Cloud Hero game. In this competitive challenge, you’ll find a curated collection of relevant hands-on labs to help you practice and track your progress with a live leaderboard.We also invite you to join us weekly for Google Cloud Talks by DevRel. Each Friday of Next OnAir, we’ll do a recap of the week’s topic focusing on the content most relevant to developers and technical practitioners, host a Q&A session with members of the Google Cloud Developer Relations team, and deliver technical talks that supplement the week’s programming. To see the full schedule and to register, visit the program website. Sign up for 1:1 time with Google Cloud expertsHave a specific cloud challenge facing you today? Get help solving it during a 15-minute appointment with a Google expert aligned with the session topic of the week.Please note: Appointments are limited, subject to availability, and not eligible for job inquiries.Stay up-to-date with weekly coverage and recapsThe Google Cloud blog will be posting updates and recaps each week on the key news from Next. You can find all our coverage here. Or follow us on social media:Twitter: Google Cloud, GCP, G Suite, and Google Cloud PartnersFacebook: Google Cloud, GCP, and G SuiteLinkedIn: Google Cloud and G SuiteWe can’t wait to get started with Next OnAir—we hope you’ll join us!
Quelle: Google Cloud Platform
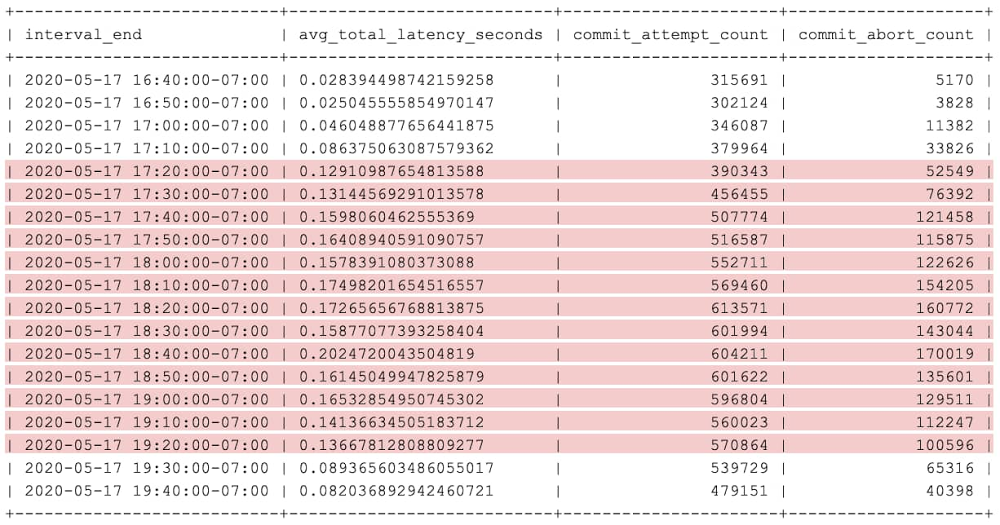
Cloud Spanner is Google’s fully managed scalable relational database service. We recently announced a new feature, Cloud Spanner transaction statistics, that lets you run SQL queries to retrieve transaction statistics for your database over several time periods. These transaction statistics give you greater visibility into what factors are driving the performance of your transactions.In this post, you’ll see how to use these transaction statistics to identify which transactions are involved in Cloud Spanner database contentions.Understanding transactions in SpannerA transaction in Spanner is used to perform a set of reads and writes that execute atomically at a single logical point in time across columns, rows, and tables in the database. It helps to understand how transactions work in Spanner to best troubleshoot any contentions. Transaction statisticsTransaction statistics bring you insight into how an application is using the database and are useful when investigating performance issues. For example, you can check whether there are any slow-running transactions that might be causing contention, or you can identify potential sources of high load, such as large volumes of updates to a particular column.Spanner provides built-in tables that store statistics about transactions. You can retrieve statistics from these SPANNER_SYS.TXN_STATS* tables using SQL statements.Aggregated transaction statisticsSpanner captures aggregated transaction statistics in the following system tables:SPANNER_SYS.TXN_STATS_TOTAL_MINUTE: Transactions during one-minute intervalsSPANNER_SYS.TXN_STATS_TOTAL_10MINUTE: Transactions during 10-minute intervalsSPANNER_SYS.TXN_STATS_TOTAL_HOUR: Transactions during one-hour intervalsEach row in the above tables contains aggregated statistics of all transactions executed over the database during the specific time interval. So, the above tables contain only one row for any given time interval.Top transaction statisticsSpanner captures transaction statistics including latency, commit attempts, and bytes written in the following system tables.SPANNER_SYS.TXN_STATS_TOP_MINUTE: Transactions during one-minute intervalsSPANNER_SYS.TXN_STATS_TOP_10MINUTE: Transactions during 10-minute intervalsSPANNER_SYS.TXN_STATS_TOP_HOUR: Transactions during one-hour intervalsIf Spanner is unable to store statistics for all transactions run during the interval in these tables, the system prioritizes transactions with the highest latency, commit attempts, and bytes written during the specified interval.Find the root cause of a database contention in SpannerTransaction statistics can be useful in debugging and identifying transactions that are causing contentions in the database. Next, you’ll see how this feature can be used to debug, using an example database where write latencies are high because of database contentions.Step 1: Identify the time period with high latenciesThis can be found in the application that’s using Cloud Spanner. For example, the issue started occurring around “2020-05-17T17:20:00″.Step 2: See how aggregated transactions metrics changed over a period of timeQuery the TXN_STATS_TOTAL_10MINUTE table around the start of the issue. The results of this query may give clues about how latency and other transaction statistics changed over that period of time.For example, this query can get aggregated transaction statistics, inclusive from “2020-05-17T16:40:00″ to “2020-05-17T19:40:00″. This brings back results, one for each 10-minute interval. Here’s what that looks like:QueryOutputIn the results, you can see that aggregated latency and abort count is higher in the highlighted period of time. We can pick any 10-minute interval (for example, interval ending at “2020-05-17T18:40:00″) where aggregated latency and/or abort count are high. Then, in the next step, you can see which transactions are contributing to high latency and abort count.Step 3: Identify the exact transactions that are causing high latencyQuery the TXN_STATS_TOP_10MINUTE table for the interval you picked in the previous step. The results of this query can give some clue about which transactions are having high latency and/or high abort count.Use the below query to get top performance-impacting transactions in descending order of total latency for the interval ending at “2020-05-17T18:40:00″.QueryOutputThe highlighted row in the preceding table is an example of a transaction experiencing high latency because of a high number of commit aborts.Step 4: Check for similarities among high-latency transactionsWe can fetch read_columns, write_constructive_columns and write_delete_tables columns for transactions with high abort count (also note the fprint value, which will be useful in the next step). This is to check whether high-latency transactions are operating on the same set of columns.QueryOutputAs the output shows, the transactions with the highest average total latency are reading the same columns. We can also observe some write contention, since the transactions are writing to the same column: TestHigherLatency._exists. Step 5: See the shape of high-latency transactions over the affected period of timeYou can see how the statistics associated with this transaction shape have changed over a period of time. Use the following query, where $FPRINT is the fingerprint of the high-latency transaction from the previous step.QueryOutputIn the above output, you can see that total latency is high for the highlighted period of time. And, wherever total latency is high, both commit_attempt_count and commit_abort_count are also high, even though commit latency (commit_latency) has not changed very much. Since transaction commits are getting aborted more frequently, commit attempts are also high because of commit retries.By using the above troubleshooting steps, we found the transactions that are involved in the contentions. So, high commit abort count is the cause of high latency. The next step is to look at the commit abort error messages received by the application to know the reason for aborts. By inspecting logs in the application, we see the application actually changed its workload during this time. That likely means that some other transaction shape showed up with high attempts_per_second, and that a different transaction (maybe a nightly cleanup job) was responsible for the additional lock conflicts.Cloud Spanner transaction statistics provides greater observability and insight into your database behaviors. Use both transaction statistics and query statistics to tune and optimize your workloads on Spanner.To get started with Spanner, create an instance in the Cloud Console or try it out with aSpanner Qwiklab.
Quelle: Google Cloud Platform