Google Cloud adds smart analytics frameworks for AI Platform Notebooks

Google Cloud is announcing the beta release of smart analytics frameworks for AI Platform Notebooks. Smart Analytics Frameworks  brings closer the model training and deployment offered by AI Platform with the ingestion, preprocessing, and exploration capabilities of our smart analytics platform. With smart analytics frameworks for AI Platform Notebooks, you can run petabyte-scale SQL queries with BigQuery, generate personalized Spark environments with Dataproc Hub, and develop interactive Apache Beam pipelines to launch on Dataflow, all from the same managed notebooks service that provides Google Cloud AI Platform.These new frameworks can help bridge the gap between cloud tools and bring a secure way to explore all kinds of data. Whether you’re sharing visualizations, presenting an analysis, or interacting with live code in more than 40 programming languages, the Jupyter notebook is the prevailing user interface for working with data. As data volumes grow and businesses aim to get more out of that data, there has been a rapid uptake in the types of data pipelines, data source availability, and plugins offered by these notebooks. While this proliferation of functionality has enabled data users to discover deep insights into the toughest business questions, the increased data analysis capabilities have been coupled with increased toil: Data engineering and data science teams spend too much time with library installations, piecing together integrations between different systems, and configuring infrastructure. At the same time, IT operators struggle to create enterprise standards and enforce data protections in these notebook environments.Our new smart analytics frameworks for AI Platform Notebooks powers Jupyter notebooks with our smart analytics suite of products, so data scientists and engineers can quickly tap into data without the integration burden that comes with unifying AI and data engineering systems. IT operators can also rest assured that notebook security is enforced through a single hub, whether the data workflow is pulling data from BigQuery, transforming data with Dataproc, or running an interactive Apache Beam pipeline. End-to-end support in AI Platform Notebooks allows the modern notebook interface to act as the trusted gateway to data in your organization. How to use the new frameworksTo get started with a smart analytics framework, go to the AI Platform Notebooks page in the Google Cloud Console. Select New Instance, then from the Data Analytics menu choose either Apache Beam or Dataproc Hub. The Apache Beam option will launch a VM that is pre-configured with an interactive environment for prototyping Apache Beam pipelines on Beam’s direct runner. The Dataproc Hub option will launch a VM running a customized JupyterHub instance that will spawn production-grade, isolated, autoscaling Apache Spark environments that can be pre-defined by administrators but personalized by each data user. All AI Notebooks Platform frameworks come pre-packaged with BigQuery libraries, making it easy to use BigQuery as your notebook’s data source. Apache Beam is an open source framework that unifies batch and streaming pipelines so that developers don’t need to manage two separate systems for their various data processing needs. The Apache Beam framework in AI Platforms Notebooks allows you to interactively develop your pipelines in Apache Beam, using a workflow that simplifies the path from prototyping to production. Developers can inspect their data transformations and perform analytics on intermediate data, then launch onto Dataflow, a fully managed data processing service that distributes your workload across a fleet of virtual machines with zero to little overhead. With the Apache Beam interactive framework, it is easier than ever for Python developers to get started with streaming analytics, and setting up your environment is a matter of just a few clicks. We’re excited to see what this innovative community will build once they start adopting Apache Beam in notebooks and launching Dataflow pipelines in production.In the past, companies have hit roadblocks along the cloud journey because it has been difficult to transition from the monolithic architecture patterns that are ingrained into Hadoop/Spark. Dataproc Hub makes it simple to modernize the inefficient multi-tenant clusters that were running on prem. With this new approach to Spark notebooks, you can provide users with an environment that data scientists can fully control and personalize in accordance with the security standards and data access policies of their company. The smart analytics frameworks for AI Notebooks Platform is a publicly available beta that you can use now. There is no charge for using any of the notebooks. You pay only for the cloud resources you use within the instance: BigQuery, Cloud Storage, Dataproc, or Compute Engine.Learn more and get started today.
Quelle: Google Cloud Platform

Meeting reliability challenges with SRE principles

You’ve built a beautiful, reliable service, and your users love it. After the initial rush from launch is over, realization dawns that this service not only needs to be run, but run by you! At Google, we follow site reliability engineering (SRE) principles to keep services running and users happy. Through years of work using SRE principles, we’ve found there are a few common challenges that teams face, and some important ways to meet or avoid those challenges. We’re sharing some of those tips here.In our experience, the three big sources of production stress are:ToilBad monitoringImmature incident handling proceduresHere’s more about each of those, and some ways to address them.1. Avoid toilToil is any kind of work tied to running a production service that tends to be manual, repetitive, automatable, tactical, devoid of enduring value, and that scales linearly as a service grows. This doesn’t mean toil has no business value; it does mean we have better ways to solve it than just manually addressing it every time.Toil is pernicious. Without constant vigilance, it can grow out of control until your entire team is consumed by it. Like weeds in a garden, there will always be some amount of toil, but your team should regularly assess how much is acceptable and actively manage it. Project planners need to make room for “toil-killer” projects on an ongoing basis.Some examples of toil are:Ticket spam: an abundance of tickets that may or may not need action, but need human eyes to triage (i.e., notifications about running out of quota).A service change request that requires a code change to be checked in, which is fine if you have five customers. However, if you have 100 customers, manually creating a code change for each request becomes toil.Manually applying small production changes (i.e., changing a command line, pushing a config, clicking a button, etc.) in response to varying service conditions. This is fine if it’s required only once a month, but becomes toil if it needs to happen daily.Regular customer questions on several repeated topics. Can better documentation or self-service dashboards help?This doesn’t mean that every non-coding task is toil. For example, non-toil things include debugging a complex on-call issue that reveals a previously unknown bug, or consulting with large, important customers about their unique service requirements. Remember, toil is repetitive work that is devoid of enduring value.How do you know which toilsome activities to target first? A rule of thumb is to prioritize those that scale unmanageably with the service. For example:I need to do X more frequently when my service has more featuresY happens more as the size of service growsThe number of pages scale with the service’s resource footprintAnd in general, prioritize automation of frequently occurring toil over complex toil. 2. Eliminate bad monitoringAll good monitoring is alike; each bad monitoring is unique in its own way. Setting up monitoring that works well can help you get ahead of problems, and solve issues faster. Good monitoring alerts on actionable problems. Bad monitoring is often toilsome, and some of the ways it can go awry are:Unactionable alerts (i.e., spam)High pager or ticket volumeCustomers asking for the same thing repeatedlyImpenetrable, cluttered dashboardsService-level indicators (SLIs) or service-level objectives (SLOs) that don’t actually reflect customers’ suffering. For example, users might complain that login fails, but your SLO dashboard incorrectly shows that everything is working as intended. In other words, your service shouldn’t rely on customer complaints to know when things are broken.Poor documentation; useless playbooks.Discover sources of toil related to bad monitoring by:Keeping all tickets in the same spotTracking ticket resolutionIdentifying common sources of notifications/requestsEnsuring operational load does not exceed 50%, as prescribed in the SRE Book3. Establish healthy incident managementNo matter the service you’ve created, it’s only a matter of time before your service suffers a severe outage. Before that happens, it’s important to establish good practices to lessen the confusion in the heat of outage handling. Here are some steps to follow so you’re in good shape ahead of an outage.Practice incident management principlesIncident management teaches you how to organize an emergency response by establishing a hierarchical structure with clear roles, tasks, and communication channels. It establishes a standard, consistent way to handle emergencies and organize an effective response.Make humans findableIn an urgent situation, the last thing you want is to scramble around trying to find the right human to talk to. Help yourselves by doing the following:Create your own team-specific urgent situation mailing list. This list should include all tech leads and managers, and maybe all engineers, if it makes sense.Write a short document that lists subject matter experts who can be reached in an emergency. This makes it easier and faster to find the right humans for troubleshooting.Make it easy to find out who is on-call for a given service, whether by maintaining an up-to-date document or by writing a simple tool.At Google, we have a team of senior SREs called the Incident Response Team (IRT). They are called in to help coordinate, mitigate and/or resolve major service outages. Establishing such a team is optional, but may prove useful if you have outages spanning multiple services.  Establish communication channelsOne of the first things to do when investigating an outage is to establish communication channels in your team’s incident handling procedures. Some recommendations are:Agree on a single messaging platform, whether it be Internet Relay Chat, Google Chat, Slack, etc. Start a shared document for collaborators to take notes in during outage diagnosis. This document will be useful later on for the postmortem. Limit permissions on this document to prevent leaking personally identifiable information (PII).Remember that PII doesn’t belong in the messaging platform, in alert text, or company-wide accessible notes. Instead, if you need to share PII during outage troubleshooting, restrict permissions by using your bug tracking system, Google docs, etc.   Establish escalation pathsIt’s 2am. You’re jolted awake by a page. Rubbing the sleep from your eyes, you fumble around the dizzying array of multi-colored dashboards, and realize you need advice. What do you do?Don’t be afraid to escalate! It’s OK to ask for help. It’s not good to sit on a problem until it gets even worse—well-functioning teams rally around and support each other.Your team will need to define its own escalation path. Here is an example of what it might look like:If you are not the on-call, find your service’s on-call person.If the on-call is unresponsive or needs help, find your team lead (TL) or manager. If you are the TL or manager, make sure your team knows it’s OK to contact you outside of business hours for emergencies (unless you have good reasons not to).If a dependency is failing, find that team’s on-call person.If you need more help, page your service’s panic list.(optional) If people within your team can’t figure out what’s wrong or you need help coordinating with multiple teams, page the IRT if you have one. Write blameless postmortemsAfter an issue has been resolved, a postmortem is essential. Establish a postmortem review process so that your team can learn from past mistakes together, ask questions, and keep each other honest that follow-up items are addressed appropriately. The primary goals of writing a postmortem are to ensure that the incident is documented, that all contributing root cause(s) are well-understood, and that effective preventive actions are put in place to reduce the likelihood and/or impact of recurrence.All postmortems at Google are blameless postmortems. A blameless postmortem assumes that everyone involved had good intentions and responded to the best of their ability with the information they had. This means the postmortem focuses on identifying the causes of the incident without pointing fingers at any individual or team for bad or inappropriate behavior.Recognize your helpersIt takes a village to run a production service reliably, and SRE is a team effort. Every time you’re tempted to write “thank you very much for doing X” in a private chat, consider writing the same text in an email and CCing that person’s manager. It takes the same amount of time for you and brings the added benefit of giving your helper something they can point to and be proud of. May your queries flow and the pager be silent! Learn more in the SRE Book and the SRE Workbook.Thanks to additional contributions from Chris Heiser and Shylaja Nukala.
Quelle: Google Cloud Platform

Helping veterans build a career path with the Google Cloud certification challenge

Each year about 200,000 veterans transition out of service but, despite being well-equipped to work in the tech sector, many of these skilled veterans don’t have a clear career path. That’s why Google Cloud is partnering with VetsInTech to help U.S. veterans develop in-demand cloud technology skills through a Google Cloud certification challenge. This six- to 10-week program gives participants access to free training and is designed to prepare U.S. veterans for the Google Cloud Associate Cloud Engineer certification exam. Throughout the program, participants can work with VetsInTech to sharpen their resume writing and interview skills, and to connect with mentors in the tech world. VetsInTech also provides job-matching services and job fairs with local tech companies. They have established relationships with corporate talent representatives and recruiters who work with them to help veterans get hired. If you’re a U.S. veteran taking the Associate Cloud Engineer, Professional Cloud Architect, or Professional Data Engineer certification exam, you can now have the cost of your exam reimbursed. The Veteran’s Administration recognizes these exams as reimbursable certification tests. After attempting the exam and receiving results, apply for reimbursement using VA Form 22-803. Additional information about this benefit is available on the Education and Training page of the GI Bill website. Why get Google Cloud certified? Cloud computing is one of the most disruptive forces in the IT market. As cloud adoption grows rapidly, so do ways that that cloud technologies can solve problems—and so does the need for cloud talent and skills. Cloud certifications are a great way to demonstrate technical skills to the broader IT market. We are committed to creating training and certification opportunities for transitioning service members, veterans, and military spouses to help them thrive in a cloud-first worldAs the demand for cloud skills continues to grow, getting certified can open up opportunities to progress within your company or help you explore other exciting roles. Scheduling for the examYou can schedule a Google Cloud certification exam here. If you’re interested in participating in the certification challenge for veterans, please review the suggested prerequisites and register with VetsInTech.
Quelle: Google Cloud Platform

Combining the power of Apache Spark and AI Platform Notebooks with Dataproc Hub

Apache Spark is commonly used by companies that want to explore large amounts of data and perform additional machine learning (ML)-related tasks at scale. Data scientists often need to examine these large datasets with the help of tools like Jupyter Notebooks, which plug into the scalable processing powerhouse that is Spark and also give them access to their favorite ML libraries. The new Dataproc Hub brings together interactive data research at scale and ML from within the same notebook environment (either from Dataproc or AI Platform) in a secure and centrally managed way.With Google Cloud, you can use the following products to access notebooks:Dataprocis a Google Cloud-managed service for running Spark and Hadoop jobs, in addition to other open source software of the extended Hadoop ecosystem. Dataproc also provides notebooks as an Optional Component and is securely accessible through the Component Gateway. Check out the process for Jupyter notebooks.AI Platform Notebooks is a Google Cloud-managed service for JupyterLab environments that run on Deep Learning Compute Engine instances and is accessible through a secure URL provided by Google’s inverting proxy.Although both of those products provide advanced features to set up notebooks, until now,Data scientists either needed to choose between Spark and their favorite ML libraries or had to spend time setting up their environments. This could prove cumbersome and often repetitive. That time could be spent exploring interesting data instead.Administrators could provide users with ready-to-use environments but had little means to customize the managed environments based on specific users or groups of users. This could lead to unwanted costs and security management overhead.Data scientists have told us that they want the flexibility of running interactive Spark tasks at scale while still having access to the ML libraries that they need from within the same notebook and with minimum setup overhead. Administrators have told us that they want to provide data scientists with an easy way to explore datasets interactively and at scale while still ensuring that the platform meets the costs and security constraints of their company.We’re introducing Dataproc Hub to address those needs. Dataproc Hub is built on core Google Cloud products (Cloud Storage, AI Platform Notebooks and Dataproc) and open-source software (JupyterHub, Jupyter and JupyterLab).Click to enlargeBy combining those technologies, Dataproc Hub:Provides a way for data scientists to quickly select the Spark-based predefined environment that they need without having to understand all the possible configurations and required operations. Data scientists can combine this added simplicity with existing Dataproc advantages that include:Agility provided by ephemeral (short-lived or job-scoped, usually) clusters that can start in seconds so data scientists don’t have to wait for resources.Scalability: managed by autoscaling policies so scientists can run research on sample data and run tests at scale from within the same notebook.Durability: backed by Cloud Storage outside of the Dataproc cluster, which minimizes chances of losing precious work.Facilitates the administration of standardized environments to make it easier for both administrators and data scientists to transition to production. Administrators can combine this added security and consistency with existing Dataproc advantages that include:Flexibility: implemented by initialization actions that run additional scripts when starting a cluster to provide data scientists with the libraries that they need.Velocity: provided by custom images that minimize startup time through pre-install packages. Availability: supported by multiple master nodes.Getting started with Dataproc HubTo get started with Dataproc Hub today, using the default setup:1. Go to the Dataproc UI2. Click on the Notebooks menu in the left panel.3. Click on NEW INSTANCE.4. Choose Dataproc Hub from the Smart Analytics Frameworks menu.5. Create the Dataproc Hub instance that meets your requirements and fits the needs of the group of users that will use it.6. Wait for the instance creation to finish and click on the OPEN JUPYTERLAB link.7. This should open a page that shows you either a configuration form or redirects you to the JupyterLab interface. If this is working, keep note of the URL of the page that you opened. 8. Share the URL with the group of data scientists that you created the Dataproc Hub instance for. Dataproc Hub identifies the data scientist when they access the secure endpoint and uses that identity to provide them with their own single-user environment.Predefined configurationsAs an administrator, you can add customization options for data scientists. For example, they can select a predefined working environment from a list of configurations that you curated. Cluster configurations are declarative YAML files that you define by following these steps:Manually create a reference cluster and export its configuration using the command gcloud beta dataproc clusters exportCLUSTERStore the YAML configuration files in a Cloud Storage bucket accessible by the identity of the instance that runs the Dataproc Hub interface.Repeat this for all the configurations that you want to create.Sets an environment variable with all the Cloud Storage URI of the relevant YAML files when creating the Dataproc Hub instance.Note: If you provide configurations, a data scientist who accesses a Dataproc Hub endpoint for the first time will see the configuration form mentioned in Step 6 above. If they have a notebook environment running at the URL, Dataproc Hub will redirect them directly to their notebook.For more details about setting up and using Dataproc Hub, check out theDataproc Hub documentation.Security overviewCloud Identity and Access Management (Cloud IAM) is central to most Google Cloud products and provides two main features for our purposes here:Identity: defines who is trying to perform an action.Access: specifies whether an identity is allowed to perform an action.In the current version of Dataproc Hub, all spawned clusters use the same customizable service account, set up by following these steps:An administrator provides a service account that will act as a common identity for all spawn Dataproc clusters. If not set, the default service account for Dataproc clusters is used.When a user spawns their notebook environment on Dataproc, the cluster starts with that identity. Users do not need the roles/iam.serviceAccountUser role on that service account because Dataproc Hub is the one spawning the cluster.Tooling optimizationsFor additional tooling that you might want for your specific environment, check out the following:Use Dataproc custom images in order to minimize the cluster startup time. You can automate this step by using the image provided by the Cloud Builder community. You can then provide the image reference in your cluster configuration YAML files.Extend Dataproc Hub by using theDataproc Hub Github repository. This option runs your own Dataproc Hub setup on a Managed Instance Group, similar to the version hosted on AI Platform Notebooks but including additional customization capabilities, such as custom DNS, identity-aware proxy, high availability for the front end, and options for internal endpoint setup.Both Dataproc Hub on AI Platform Notebooks and its extended version on Managed Instance Groups share the same open-sourced Dataproc Spawner and are based on JupyterHub. If you want to provide additional options to your data scientists, you can further configure those tools when you extend Dataproc Hub.If you need to extend Dataproc Hub, the Github repository provides an example that sets up the following architecture using Terraform:Click to enlargeNext stepsGet familiar with the Dataproc spawner to learn how to spawn notebook servers on Dataproc.Get familiar with the Dataproc Hub example code in Github to learn how to deploy and further customize the product to your requirements.Read the Dataproc Hub product documentation to learn how to quickly launch a Dataproc Hub instance.
Quelle: Google Cloud Platform

Tools for debugging apps on Google Kubernetes Engine

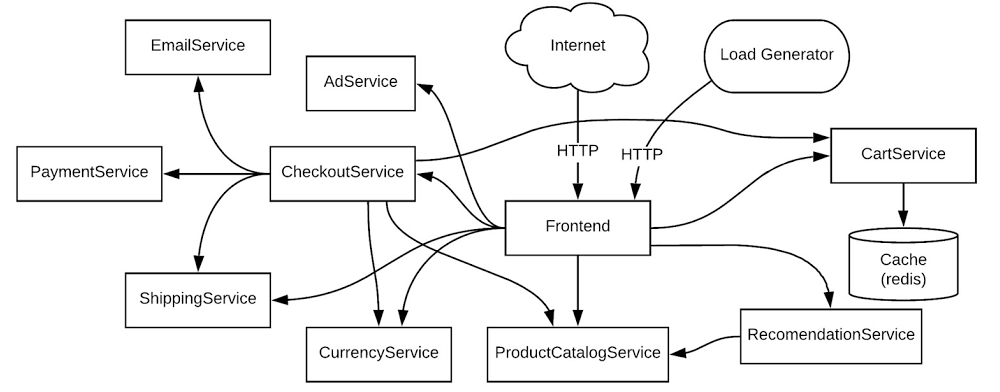
Editor’s note: This is a follow up to a recent post on how to use Cloud Logging with containerized applications running in Google Kubernetes Engine. In this post, we’ll focus on how DevOps teams can use Cloud Monitoring and Logging to find issues quickly. Running containerized apps on Google Kubernetes Engine (GKE) is a way for a DevOps team to focus on developing apps, rather than on the operational tasks required to run a secure, scalable and highly available Kubernetes cluster. Cloud Logging and Cloud Monitoring are two of several services integrated into GKE that provide DevOps teams with better observability into applications and systems, for easier troubleshooting in the event of a problem. Using Cloud LoggingLet’s look at a simple, yet common use case. As a member of the DevOps team, you have received an alert from Cloud Monitoring about an application error in your production Kubernetes cluster. You need to diagnose this error. To use a concrete example, we will work through a scenario based on a sample microservices demo app deployed to a GKE cluster. In this demo app, there are many microservices and dependencies among them.For this example, consider the demo app running in your staging environment shared by multiple teams or a production environment running multiple workloads. Let’s see how you can work through troubleshooting a simple error scenario. Let’s start this example from an alert triggered by a large number of HTTP 500 errors. You can create a logs-based metric based on the number of log events or the content of the log entries which you can also use for alerting purposes. Cloud Monitoring provides Alerting which can be set-up to send emails, SMS or generate notifications in third-party apps. In our example, let’s say there are HTTP 500 errors with the following stack trace.If you have already created the alerting policy in Cloud Monitoring, you will receive notifications like the following one:You can view the incident details by clicking the ‘VIEW INCIDENT’ link. Following the Policy link from the alert notification opens the alerting section of the Monitoring UI.One of the first places that you can look for information on the errors is the Kubernetes Engine section of the Monitoring console. Using the workload view, you can select your cluster and easily see the usage resources for the pods and containers running in the cluster. In this case, you can see that the pod and container for the recommendationservice have very high CPU utilization. This could mean that the recommendationservice is overloaded and not able to respond to requests from the frontend. Ideally, you also have an alert set up for the CPU and memory utilization for the container, which would also generate alerts.Opening the link to the server container under the recommendationservice service/pod displays the details about the container. The details include metrics like memory and CPU, logs and details about the container. You can also click the MANAGE link to navigate directly to the pod details in the GKE console. Because Monitoring is integrated into the GKE console, you can view monitoring graphs for the pod. Using the CPU graph, you can see that the CPU is regularly exceeding the requested amount of CPU. Notice the purple line crossing the solid blue line in the lower left graph. You can also easily see that the memory and disk space are not highly utilized, eliminating them from a list of possible issues. In this case, the CPU could be the issue.Clicking on the container, you can see the requested CPU, memory, and the deployment details.You can also click on the Revision history link to review the history of the container. You can see that there was a recent deployment.It’s worth looking at the logs to see if there is any information about why additional CPU power is suddenly in demand. Since the original error was a 500 error served through the frontend pod, you can navigate to the frontend entry under Workloads. To view the frontend logs, click on the Container logs link. This opens the Cloud Logging UI with a specific pre-constructed filter for the logs of this container.In the Logs Viewer, you can see the detailed query, a histogram of the logs, and the individual log entries. The histogram feature provides context for how often log entries are observed over the given time window and can be a powerful tool to help identify application issues. In this case, you can see that the error entries started increasing at around 4:50PM.By expanding the error entries, you can see the log message below.“failed to get product recommendations: rpc error: code = Unavailable desc = all SubConns are in TransientFailure, latest connection error: connection error: desc = “transport: Error while dialing dial tcp 10.55.247.125:8080: connect: connection refused”This matches the original HTTP 500 error served through the frontend pod. Now, take a look at the recommendationservice pod logs by adjusting the logging filter to surface error entries with the recommendations name. The filter below restricts the entries to errors from the containers in the pod with a prefix of “recommendations”.Now, adjust the filter to look at the non-error log entries.You can see in the logs histogram that there are log entries being generated from the service, which likely means that the service is still receiving and responding to some requests.Since no errors were generated by the recommendationservice in the logs, this helps to confirm the suspicion that there is an issue with the latest code deployment causing it to use more CPU than before. With this information, you can take action. You could either increase the CPU request in the container YAML or roll back the recent update to the recommendationservice and contact the developer responsible for the service to review the increase in CPU utilization. The specific action depends on your understanding of the code and recent deployments, your organization and policies. Whichever option you take, you can continue monitoring your cluster for adverse events using Cloud Logging and Monitoring. Learn more about Cloud Logging, Monitoring and GKEWe built our logging and monitoring capabilities for GKE into Cloud Operations to make it easy for you to monitor, alert and analyze your apps. If you haven’t already, get started with Cloud Logging on GKE and join the discussion on our mailing list. As always, we welcome your feedback.
Quelle: Google Cloud Platform

DockerCon LIVE is here!

DockerCon LIVE 2020 is about to kick off and there are over 64,000 community members, users and customers registered! Although we miss getting together in person, we’re excited to be able to bring even more people together to learn and share how Docker helps dev teams build great apps. Like DockerCon’s past there is so much great content on the agenda for you to learn and expand your expertise around containers and applications.

We’ve been very busy here at Docker and a couple of months ago, we outlined our refocused developer-focused strategy. Since then, we’ve made great progress on executing against it and remain focused on bringing simplicity to app building experience, embracing the ecosystem and helping developers and developer teams bring code to cloud faster and easier than ever before. A few examples:

We unveiled Docker’s first ever public roadmap. Check it out and give us feedback! We open sourced the Compose Specification and started working with AWS, Microsoft and other community members to accelerate cloud-native application development. Last week, we announced that we have partnered with Snyk to bring vulnerability scanning to Docker. This was one of the top requested items on the public roadmap. Yesterday we announced that we are collaborating with Microsoft to simplify code to cloud application development for developers and development teams. This is another step in our mission to help dev teams build great apps.The above two points show that we are following through with our strategy to embrace the ecosystem.

We hope you can join us today for #DockerCon! There’s lots more code to cloud goodness to come from us, and we can’t wait to see what the community does next with Docker.  
The post DockerCon LIVE is here! appeared first on Docker Blog.
Quelle: https://blog.docker.com/feed/