Librem Mini: Purism bringt NUC-artigen Mini-PC
Klein, leicht und sehr leistungsstark – die Linux-Hardware-Spezialisten von Purism verkaufen einen sicheren Mini-PC als Desktop-Ersatz. (Purism, Linux)
Quelle: Golem

Klein, leicht und sehr leistungsstark – die Linux-Hardware-Spezialisten von Purism verkaufen einen sicheren Mini-PC als Desktop-Ersatz. (Purism, Linux)
Quelle: Golem

These days, using a password alone to secure user accounts containing sensitive, identifiable, or private information just isn’t sufficient. Passwords are often subject to reuse and can easily be phished and stolen. With this in mind, we recently teamed up with researchers from New York University and the University of California, San Diego to find out just how effective basic account hygiene is at preventing account takeovers. The research showed that simply adding a SMS as a second factor to a Google account can block up to 100% of automated bots, 96% of bulk phishing attacks, and 76% of targeted attacks that occurred during our investigation.To help you enhance the security of your apps and protect your users, Identity Platform now supports multi-factor authentication (MFA) with SMS in beta.Configuring MFA in the admin console.You can now configure Identity Platform to require users who attempt to login to your application to self-enroll in MFA—also known as two-factor authentication (2FA)—and register a device that is capable of receiving SMS messages. When users attempt to sign-in to your app with their first-factor credential (email/password, social login, SAML, OIDC), Identity Platform will require them to enter the six-digit authentication code that it sends via SMS to their registered devices before they can sign-in to your apps and services. Getting startedYou can learn more about this new feature by checking out the documentation page. To get started with Identity Platform, enable it in GCP Marketplace, watch our Cloud Next ‘19 presentation, and read the quickstart.
Quelle: Google Cloud Platform
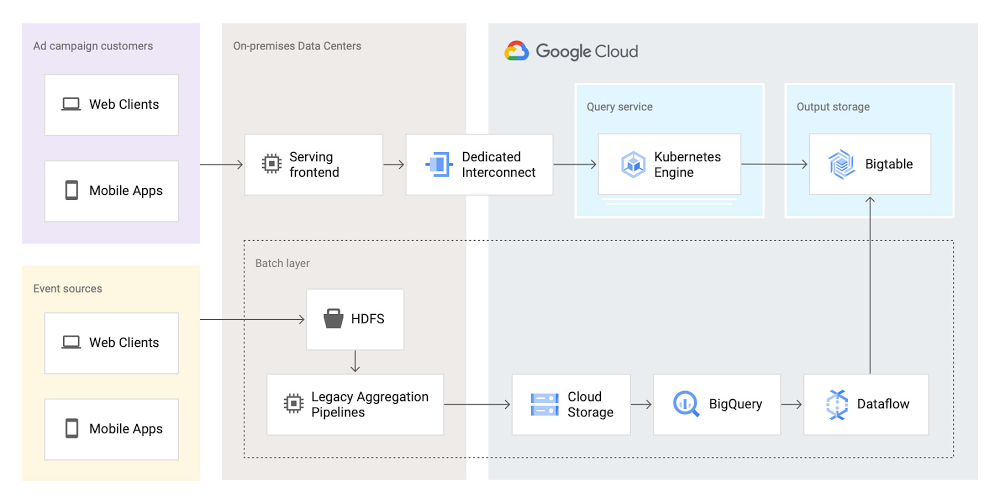
As part of the daily business operations on its advertising platform, Twitter serves billions of ad engagement events, each of which potentially affects hundreds of downstream aggregate metrics. To enable its advertisers to measure user engagement and track ad campaign efficiency, Twitter offers a variety of analytics tools, APIs, and dashboards that can aggregate millions of metrics per second in near-real time.In this post, you’ll get details on how the Twitter Revenue Data Platform engineering team, led by Steve Niemitz, migrated their on-prem architecture to Google Cloud to boost the reliability and accuracy of Twitter’s ad analytics platform.Deciding to migrateOver the past decade, Twitter has developed powerful data transformation pipelines to handle the load of its ever-growing user base worldwide. The first deployments for those pipelines were initially all running in Twitter’s own data centers. The input data streamed from various sources into Hadoop Distributed File System (HDFS) as LZO-compressed Thrift files in an Elephant Bird container format. The data was then processed and aggregated in batches by Scalding data transformation pipelines. Then, aggregation results were output into Manhattan, Twitter’s homegrown distributed key-value store, for serving. Additionally, a streaming system using Twitter’s homegrown systems Eventbus (a messaging tool built on top of DistributedLog), Heron (a stream processing engine), and Nighthawk (a sharded Redis deployment) powered the real-time analytics that Twitter had to provide, filling the gap between the current time and the last batch run.While this system consistently sustained massive scale, its original design and implementation was starting to reach some limits. In particular, some parts of the system that had grown organically over the years were difficult to configure and extend with new features. Some intricate, long-running jobs were also unreliable, leading to sporadic failures. The legacy end-user serving system was very expensive to run and couldn’t support large queries.To accommodate for the projected growth in user engagement over the next few years and streamline the development of new features, the Twitter Revenue Data Platform engineering team decided to rethink the architecture and deploy a more flexible and scalable system in Google Cloud.Platform modernization: First iterationIn the middle of 2017, Steve and his team tackled the first redesign iteration of its advertising data platform modernization, leading to Twitter’s collaboration with Google Cloud.At first, the team left the data aggregation legacy Scalding pipelines unchanged and continued to run them in Twitter’s data centers. But the batch layer’s output was switched from Manhattan to two separate storage locations in Google Cloud:BigQuery—Google’s serverless and highly scalable data warehouse, to support ad-hoc and batch queries.Cloud Bigtable—Google’s low-latency, fully managed NoSQL database, to serve as a back end for online dashboards and consumer APIs.The output aggregations from the Scalding pipelines were first transcoded from Hadoop sequence files to Avro on-prem, staged in four-hour batches to Cloud Storage, and then loaded into BigQuery. A simple pipeline deployed on Dataflow, Google Cloud’s fully managed streaming and batch analytics service, then read the data from BigQuery and applied some light transformations. Finally, the Dataflow pipeline wrote the results into Bigtable.The team built a new query service to fetch aggregated values from Bigtable and process end-user queries. They deployed this query service in a Google Kubernetes Engine (GKE) cluster in the same region as the Bigtable instance to optimize for data access latency.Here’s a look at the architecture:This first iteration already brought many important benefits:It de-risked the overall migration effort, letting Twitter avoid migrating both the aggregation business logic and storage at the same time.The end-user serving system’s performance improved substantially. Thanks to Bigtable’s linear scalability and extremely low latency for data access, the serving system’s P99 latencies decreased from 2+ seconds to 300ms.Reliability increased significantly. The team now rarely, if ever, gets paged for the serving system anymore.Platform modernization: second iterationWith the new serving system in place, in 2019 the Twitter team began to redesign the rest of the data analytics pipeline using Google Cloud technologies. The redesign sought to solve several existing pain points:Because the batch and streaming layers ran on different systems, much of the logic was duplicated between systems. While the serving system had been moved into the cloud, the existing pain points of the Hadoop aggregation process still existed.The real-time layer was expensive to run and required significant operational attention.With these pain points in mind, the team began evaluating technologies that could help solve them. They considered several open-source stream processing frameworks initially: Apache Flink, Apache Kafka Streams, and Apache Beam. After evaluating all possible options, the team chose Apache Beam for a few key reasons:Beam’s built-in support for exactly-once operations at extremely large scale across multiple clusters.Deep integration with other Google Cloud products, such as Bigtable, BigQuery, and Pub/Sub, Google Cloud’s fully managed, real-time messaging service.Beam’s programming model, which unifies batch and streaming and lets a single job operate on either batch inputs (Cloud Storage), or streaming inputs (Pub/Sub).The ability to deploy Beam pipelines on Dataflow’s fully managed service.The combination of Dataflow’s fully managed approach and Beam’s comprehensive feature set let Twitter simplify the structure of its data transformation pipeline, as well as increase overall data processing capacity and reliability.Here’s what the architecture looks like after the second iteration:In this second iteration, the Twitter team re-implemented the batch layer as follows: Data is first staged from on-prem HDFS to Cloud Storage. A batch Dataflow job then regularly loads the data from Cloud Storage, processes the aggregations, and dual-writes the results to BigQuery for ad-hoc analysis and Bigtable for the serving system.The Twitter team also deployed an entirely new streaming layer in Google Cloud. For data ingestion, an on-prem service now pushes two different streams of Avro-formatted messages to Pub/Sub. Each message contains a bundle of multiple raw events and affects between 100 and 1,000 aggregations. This leads to more than 3 million aggregations per second performed by four Dataflow jobs (J0-3 in the diagram above). All Dataflow jobs share the same topology, although each job consumes messages from different streams or topics.One stream, which contains critical data, enters the system at a rate of 200,000 messages per second and is partitioned in two separate Pub/Sub topics. A Dataflow job (J3 in the diagram) consumes those two streams, performs 400,000 aggregations per second, and outputs the results to a table in Bigtable.The other stream, which contains less critical but higher volume data, enters the system at a rate of around 80,000 messages per second and is partitioned into six separate topics. Three Dataflow jobs (J0, J1, and J2) share the processing of this larger stream, with each of them handling two of the available six topics in parallel, then also outputting the results to a table in Bigtable. In total, those three jobs process over 2 million aggregations/second.Partitioning the high-volume stream into multiple topics offers a number of advantages:The partitioning is organized by applying a hash function on the aggregation key and then dividing the function’s result by the number of available partitions (in this case, six). This guarantees that any per-key grouping operation in downstream pipelines is scoped to a single partition, which is required for consistent aggregation results.When deploying updates to the Dataflow jobs, admins can drain and relaunch each job individually in sequence, allowing the remaining pipelines to continue uninterrupted and minimizing impact on the end users.The three jobs can each handle two topics without issue currently, and there is still room to scale horizontally up to six jobs if needed. The number of topics (six) is arbitrary, but is a good balance at the moment based on current needs and potential spikes in traffic.To assist with job configuration, Twitter initially considered using Dataflow’s template system, a powerful feature that enables the encapsulation of Dataflow pipelines into repeatable templates that can be configured at runtime. However, since Twitter needed to deploy jobs with topologies that might change over time, the team decided instead to implement a custom declarative system where developers can specify different parameters for their jobs in a pystachio DSL: tuning parameters, data sources to operate on, sink tables for aggregation outputs, and the jobs’ source code location. A new major version of Dataflow templates, called Flex Templates, will remove some of the previous limitations with the template architecture and allow any Dataflow job to be templatized.For job orchestration, the Twitter team built a custom command line tool that processes the configuration files to call the Dataflow API and submit jobs. The tool also allows developers to submit a job update by automatically performing a multi-step process, like this:Drain the old job:Call the Dataflow API to identify which data sources are used in the job (for example, a Pub/Sub topic reader).Initiate a drain request.Poll the Dataflow API for the watermark of the identified sources until the maximum watermark is hit, which indicates that the draining operation is complete.Launch the new job with the updated code.This simple, flexible, and powerful system allows developers to focus on their data transformation code without having to be concerned about job orchestration or the underlying infrastructure details.Looking aheadSix months after fully transitioning its ad analytics data platform to Google Cloud, Twitter has already seen huge benefits. Twitter’s developers have gained in agility as they can more easily configure existing data pipelines and build new features much faster. The real-time data pipeline has also greatly improved its reliability and accuracy, thanks to Beam’s exactly-once semantics and the increased processing speed and ingestion capacity enabled by Pub/Sub, Dataflow, and Bigtable.Twitter engineers have enjoyed working with Dataflow and Beam for several years now, since version 2.2, and plan to continue expanding their usage. Most importantly, they’ll soon merge the batch and streaming layers into a single, authoritative streaming layer.Throughout this project, the Twitter team collaborated very closely with Google engineers to exchange feedback and discuss product enhancements. We look forward to continuing this joint technical effort on several ongoing large-scale cloud migration projects at Twitter. Stay tuned for more updates!
Quelle: Google Cloud Platform

Azure Network Watcher’s new and improved Connection Monitor now provides unified end-to-end connection monitoring capabilities for hybrid and Azure deployments. Users can now use the same solution to monitor connectivity for on-premises, Azure, and multi-cloud setups. In this preview phase, the solution brings together the best of two key capabilities—Network Watcher's Connection Monitor and Network Performance Monitor's (NPM) Service Connectivity Monitor. Check out the documentation and start using Connection Monitor to check connectivity in your network.
The monitoring question
Customers have long stressed over the need for unified connection monitoring for hybrid deployments, where complex applications transact across Azure, on-premises, and with other public applications to deliver business-critical functionality. These challenges escalate in multi-cloud environments. Monitoring teams then wrestle with basic challenges including:
Which monitoring solution to use in these complex set-ups?
Do I need different monitoring solutions for on-premises and Azure or any other clouds?
Where does my data go and how do I correlate data from multiple sources?
How do I get the fastest alerts when things go wrong in my network?
Connection Monitor in preview
With the new Connection Monitor, you can now configure both Azure and non-Azure virtual machines and hosts for monitoring connectivity to global endpoints from a single console. You can set up Connection Monitor and create multiple test groups for various use cases including connectivity between Azure regions, connectivity to Office 365, and connectivity between app and database tiers. With the ability to add multiple sources and destinations in one test group, configuring monitoring gets much easier. You also benefit from an aggregated view of your network parameters, with the ability to drill down to individual links at the time of troubleshooting.
You can monitor loss and latency of network connections both within Azure and between Azure and external destinations, and view the topology to localize issues. The solution identifies the top five tests in your Connection Monitor, test groups, sources, and destinations, then highlights potential problem tests. For Azure resources, issues with your hops are shown in the topology.
Alerts and data storage
Monitoring data is stored in both Azure Monitor as metrics and in Log Analytics workspaces. You can now set up fast, metrics-based alerts to react to issues expeditiously. To build additional correlations on your historical data, use Log Analytics queries.
Other benefits
Single console for configuring and monitoring connectivity and network quality from Azure and on-premises virtual machines and hosts.
Monitor multiple endpoints within and across Azure regions, on-premises sites, and global service locations.
Higher and configurable probing frequencies.
More protocols supported to give better visibility into network performance.
Cross-region, cross-workspace monitoring.
Access to historical monitoring data retained in Log Analytics.
Rich user experience.
Automation through PowerShell and CLI.
Start monitoring today
The new Connection Monitor feature will be available for no charge during preview. The general availability pricing for Connection Monitor will be available soon on the pricing page. For more details, please visit the Connection Monitor (Preview) documentation.
We're here for you
We would love to hear from you. Send us your suggestions via the User Voice page.
Quelle: Azure

Das Umweltbundesamt hält schon länger eine Quote für Elektroautos in Deutschland für erforderlich. Neueste Zahlen zum CO2-Ausstoß im Verkehr bestätigen dies. (Klimakrise, GreenIT)
Quelle: Golem
The post Our commitment to you appeared first on Mirantis | Pure Play Open Cloud.
An open letter to our customers, business partners and friends
I am sure that you are doing everything possible to support your employees, customers and families during this challenging time. We at Mirantis are doing the same.
We understand how critical our products and services are to your business. I want to assure you that every one of you can continue to rely on us. Mirantis continues to operate without any interruption as we have taken all necessary steps to protect the well-being of our employees in every country where we are present.
To that end:
We have assigned additional staff to customer support. We continuously track our support quality with particular attention to critical incidents.
Our product development continues without disruption, and our software release schedule remains on track.
We are soliciting feedback from all our customers on where we can do better and go above and beyond our contractual commitments and prior expectations.
In summary, we will do whatever it takes to help you achieve your goals.
To help us better serve you I also have one ask: if you have any feedback, request or just a problem where we can help, please contact me. I would love to hear from you.
Thank you for your continued trust in Mirantis, and may you and your loved ones be well.
Sincerely,
Adrian Ionel
CEO and Chairman
Mirantis
The post Our commitment to you appeared first on Mirantis | Pure Play Open Cloud.
Quelle: Mirantis

Amazon erhöht wegen des Coronavirus die Löhne und stellt mehr Arbeiter ein. Zum Teil sind die Wartezeiten für die Kunden länger. (Coronavirus, Amazon)
Quelle: Golem

Die neue Beta soll mit Windows und Linux funktionieren. Auch gibt es einen Ausblick auf den Release der finalen Version für alle. (Windows, JSON)
Quelle: Golem

Die Macher von Slack geben zu, dass das Programm in letzter Zeit sehr unübersichtlich geworden ist. Ein umfangreiches Update soll dies ändern. (Slack, Applikationen)
Quelle: Golem

Drei Tage lang sollen Programmierer und Designer digitale Werkzeuge für den Umgang mit der Coronavirus-Pandemie entwickeln. Vorbild ist ein anderes EU-Land. (Coronavirus, Handy)
Quelle: Golem