OpenShift Commons Briefing: Quay v3 Release Update and Road Map

  In this briefing, Dirk Herrmann, Red Hat’s Quay Product Manager walks through Quay v3.0’s features, and discusses the road map for future Quay releases, including a progress update on the open sourcing of Quay. Built for storing container images, Quay offers visibility over images themselves, and can be integrated into your CI/CD pipelines and […]
The post OpenShift Commons Briefing: Quay v3 Release Update and Road Map appeared first on Red Hat OpenShift Blog.
Quelle: OpenShift

Exploring the Micorosoft Healthcare Bot partner program

This post was co-authored by Hadas Bitran, Group Manager, Microsoft Healthcare Israel.

Every day, healthcare organizations are beginning their digital transformation journey with the Microsoft Healthcare Bot Service built on Azure. The Healthcare Bot service empowers healthcare organizations to build and deploy an Artificial Intelligence (AI) powered, compliant, conversational healthcare experience at scale. The service combines built-in medical intelligence with natural language capabilities, extensibility tools, and compliance constructs, allowing healthcare organizations such as providers, payers, pharma, HMOs, and telehealth to give people access to trusted and relevant healthcare services and information.

Healthcare organizations can leverage the Healthcare Bot Service on their digital transformation journey today, as we announced in our blog Microsoft Healthcare Bot brings conversational AI to healthcare. That’s why we are so happy to share more information on the Healthcare Bot Service partner program. Our Healthcare Bot certified partners empower healthcare organizations to successfully deploy virtual assistants on the Microsoft Healthcare Bot service. Working with an official partner, healthcare organizations can achieve the full potential of the Microsoft Healthcare Bot by leveraging the expertise and experience of partners who understand the business needs and challenges in healthcare.

This new program is open to existing Microsoft partners that support organizations in the healthcare domain, and delivers the training and resources required to support customers with end to end solutions using Microsoft’s Healthcare Bot Service. The program is designed to support partner success and enable partners to provide tailored solutions using the Healthcare Bot service as a foundation.

With the power of the cloud and a platform that is uniquely built for healthcare conversational intelligence, partners can quickly demonstrate value and iterate on solutions for customers. Official partners have access to partner-only resources and benefits that will enable them to provide customers with differentiated and value-added offerings such as:

Partner listing in the Healthcare Bot partner directory.
Preferential messaging tiers.
Free demonstration and proof of concept Healthcare Bot Instances.
Direct support channel from the product team.
Partner resources including sales materials, product updates and release notes.

The Microsoft Healthcare Bot service helps partners bring conversational AI to innovative healthcare organizations. Partners can support healthcare organizations to deploy customized conversational experiences at scale, reducing costs and improving outcomes for their patients with virtual assistants built to complement their healthcare services.

The Healthcare Bot provides partners with a comprehensive platform to automate healthcare engagements and provides patients with instant access to the services they need. The service facilitates multi-channel healthcare conversations such as chat bots or handoff to live nurses over Microsoft Teams. Partners can build differentiated offerings and create unique conversational healthcare experiences that support the type of digital interaction required by the patient.

Next steps

Partners interested in certification should submit a request to HealthBotSupport@microsoft.com. Healthcare organizations seeking certified Healthcare Bot partners can find more information in the official partner directory.
Quelle: Azure

Announcing new GKE architecture specialization—now with one month free access

Today, IT organizations want to move fast, deploy software efficiently, and scale big. Kubernetes, containers, and Google Kubernetes Engine (GKE) can help you do that—and we can help you get started with learning these technologies with our newest training path, the Architecting with Google Kubernetes Engine Specialization.In this specialization, you’ll learn all about Kubernetes, the open-source, vendor-neutral system for orchestrating workloads that are packaged in containers. You’ll gain an understanding for how you can run Kubernetes, and deploy production solutions on it, usingGoogle Cloud Platform (GCP). We’ll also deep dive into our GKE managed service that gives you access to Google’s advanced load-balancing technologies, its worldwide network, and GCP’s range of data and machine-learning managed services. If you’re already familiar with working in a virtual-machine-based environment, this specialization will present familiar architecture principles, but in a GKE environment. You’ll also learn how to configure your GKE environment; build, schedule, load-balance, and monitor workloads; manage access control and security; and give your applications persistent storage. This specialization is delivered as a combination of lectures and hands-on labs to help you master your skills. When you finish each course, you will receive a certificate that you can share with your professional network and employers.The Architecting with GKE Specialization consists of four courses:GCP Fundamentals: Core Infrastructure – Learn about important concepts and terminologies for working with GCP. Architecting with GKE: Foundations – Master the foundations of architecting with GKE by reviewing the layout and principles of GCP, followed by an introduction to creating and managing software containers and to the architecture of Kubernetes. Architecting with GKE: Workloads – Learn about how to perform Kubernetes operations, create and manage deployments, use GKE networking tools; and how to give your Kubernetes workloads persistent storage. Architecting with GKE: Production – The last course covers Kubernetes and GKE security, logging and monitoring, and using GCP managed storage and database services from within GKE. Want to learn more? Join us July 26th at 9:00 am PST for a special webinar, Architecting with Google Kubernetes Engine: Get started on your Anthos journey. In this webinar you will learn how to enable a hybrid cloud strategy with Kubernetes and participate in a free hands-on lab on how to configure persistent storage for GKE. Just for attending the webinar, we’ll give you one month free access to the GKE Specialization. Register for the webinar today.
Quelle: Google Cloud Platform

Production debugging comes to Cloud Source Repositories

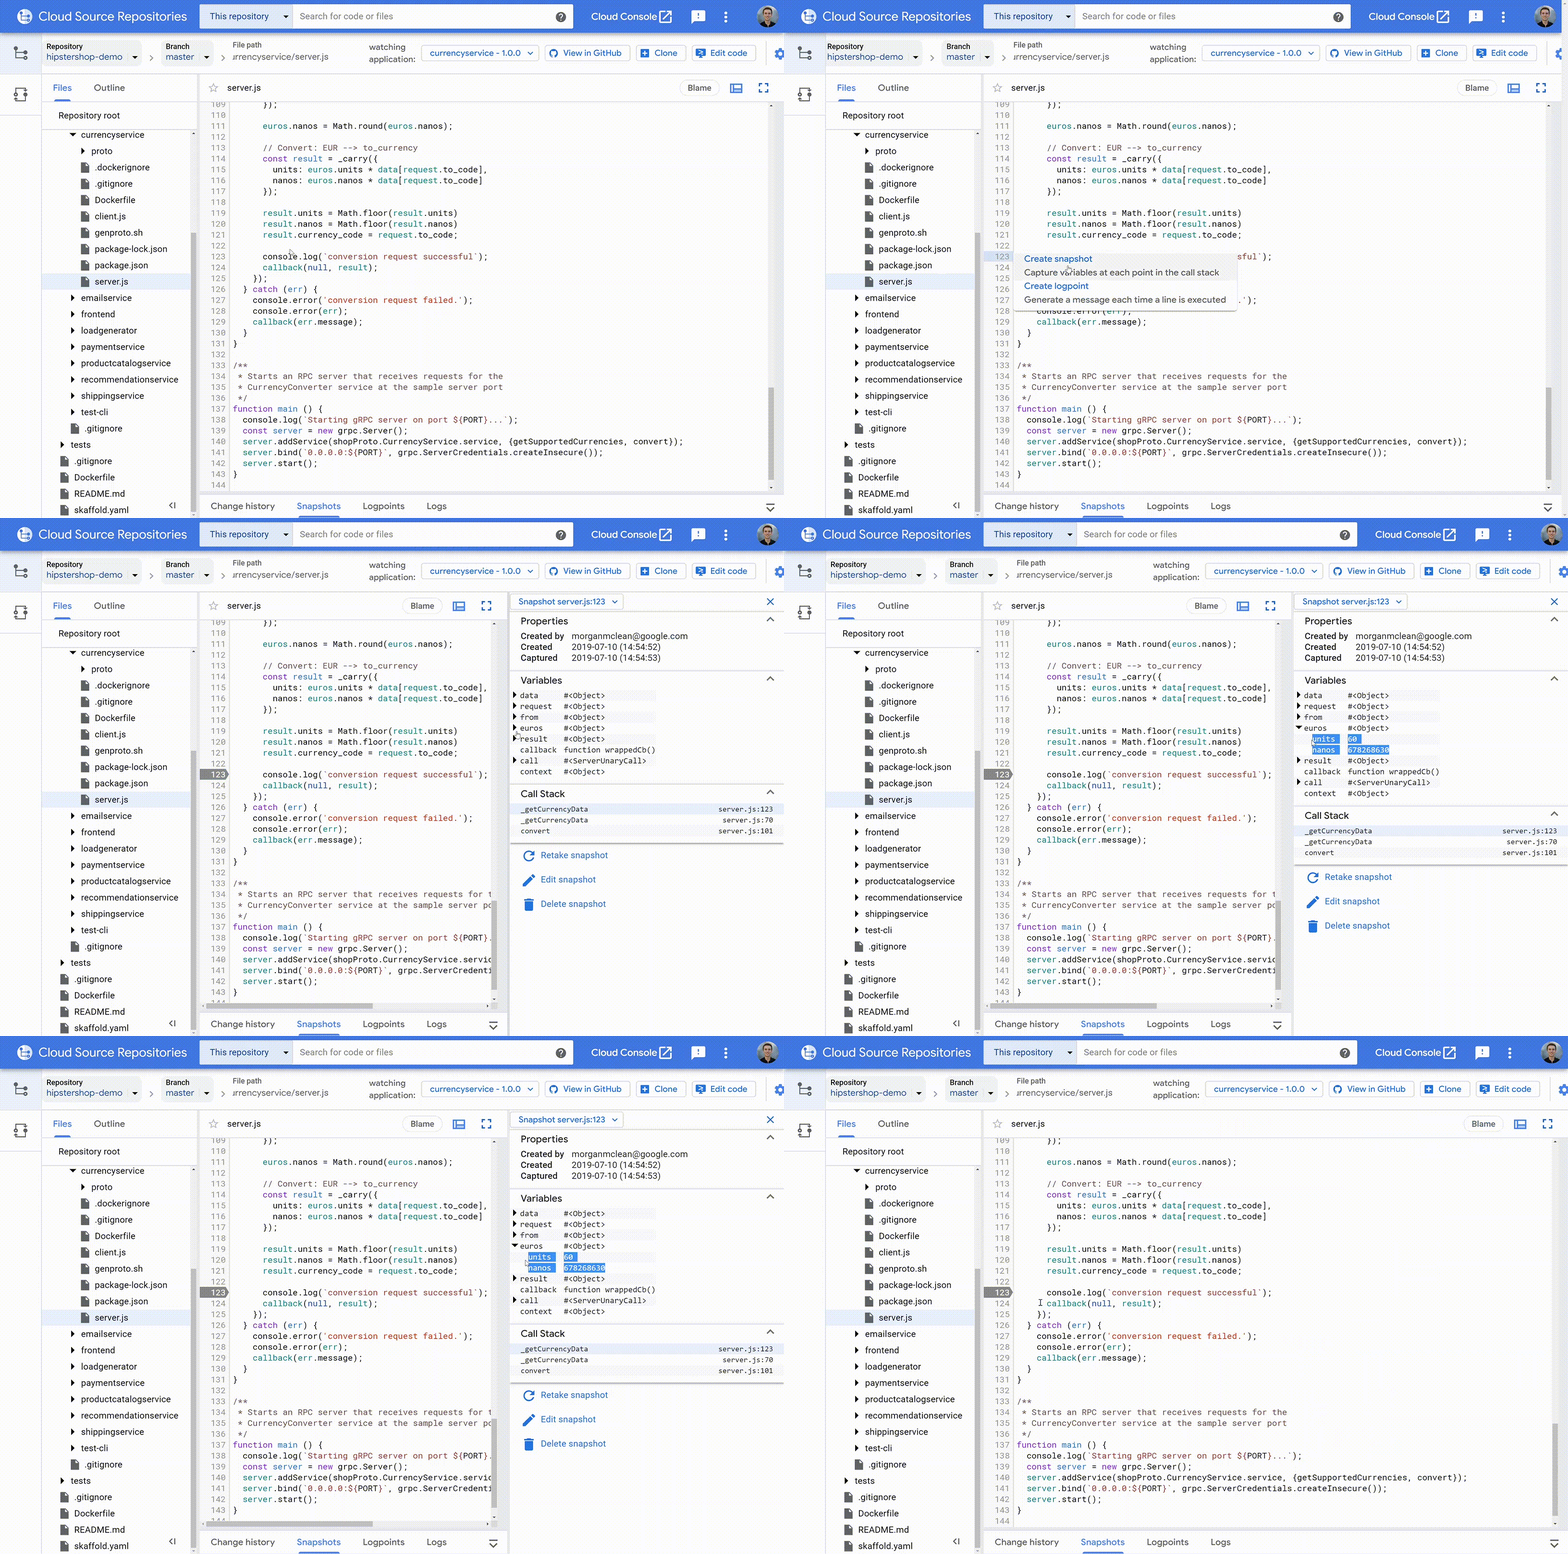
Google Cloud has some great tools for software developers. Cloud Source Repositories and Stackdriver Debugger are used daily by thousands of developers who value Cloud Source Repositories’ excellent code search and Debugger’s ability to quickly and safely find errors in production services.But Debugger isn’t a full-fledged code browser, and isn’t tightly integrated with all the most common developer environments. The good news is that these tools are coming together! Starting today, you can debug your production services directly in Cloud Source Repositories, for every service where Stackdriver Debugger is enabled.What’s new in Cloud Source RepositoriesThis integration brings two pieces of functionality to Cloud Source Repositories: support for snapshots, and logpoints.SnapshotsSnapshots are point-in-time images of your application’s local variables and stack that are triggered when a code condition is met. Think of snapshots as breakpoints that don’t halt execution. To create one, simply click on a line number as you would with a traditional debugger, and the snapshot will activate the next time that one of your instances executes the selected line. When this happens, you’ll see the local variables captured during the snapshot and the complete call stack—without halting the application or impacting its state and ongoing operations!You can navigate and view local variables in this snapshot from each frame in the stack, just as with any other debugger. You also have full access to conditions and expressions, and there are safeguards in place to protect against accidental changes to your application’s state.LogpointsLogpoints allow you to dynamically insert log statements into your running services without redeploying them. Each logpoint operates just like a log statement that you write into your code normally: you can add free text, reference variables, and set the conditions for the log to be saved. Logpoints are written to your standard output path, meaning that you can use them with any logging backend, not just Stackdriver Logging.Creating a logpoint is a lot like creating a snapshot: simply click on the line number of the line where you wish to set it, and you’re done.Upon adding a logpoint to your application, it’s pushed out to all instances of the selected service. Logpoints last for 24 hours or until the service is redeployed, whichever comes first. Logpoints have the same performance impact as any other log statement that exists normally in your source code.Getting startedTo use Cloud Source Repositories’ production debugging capabilities, you must first enable your Google Cloud Platform projects for Stackdriver Debugger. You can learn more about these setup steps in the Stackdriver Debugger documentation.Once this is complete, navigate to the source code you wish to debug in Cloud Source Repositories, then select ‘Debug application’. Today this works best with code stored in Cloud Source Repositories or that is mirrored from supported third-party sources including GitHub, Bitbucket, and GitLab. Once you’ve selected your application you can start placing snapshots and logpoints in your code by clicking on the line numbers in the left gutter.Production debugging done rightBeing able to debug code that’s running in production is a critical capability—and being able to do so from a full-featured code browser is even better! Now, through bringing production debugging to Cloud Source Repositories, you can track down hard-to-find problems deep in your code, while being able to do things like  continually sync code from a variety of different sources, cross-reference classes, look at blame layers, view change history, and search by class name, method name, etc. To learn more, check out this getting started guide. Russell Wolf, Product Manager, also contributed to this blog post.
Quelle: Google Cloud Platform