How HSBC built its PayMe for Business app on Microsoft Azure

Bank-grade security, super-fast transactions, and analytics 

If you live in Asia or have ever traveled there, you’ve probably witnessed the dramatic impact that mobile technology has had on all aspects of day to day life. In Hong Kong in particular, most consumers now use a smart phone daily, presenting new opportunities for organizations to deliver content and services directly to their mobile devices.

As one of the world’s largest international banks, HSBC is building new services on the cloud to enable them to organize their data more efficiently, analyze it to understand their customers better, and make more core customer journeys and features available on mobile first.

HSBC’s retail and business banking teams in Hong Kong have combined the convenience afforded by smart phones with cloud services to allow “cashless” transactions where people can use their smart phone to perform payments digitally. Today, over one and a half million people use HSBC’s PayMe app to exchange money with people in their personal network for free. And businesses are using HSBC’s new PayMe for Business app, built natively on Azure, to collect payments instantly, with 98 percent of all transactions completed in 500 milliseconds or less. Additionally, the businesses can leverage powerful built-in intelligence on the app to improve their sales and operations.

On today’s Microsoft Mechanics episode of “How We Built it,” Alessio Basso, Chief Architect of PayMe from HSBC, explains the approach they took and why.

Bank-grade security, faster time to delivery, dynamic scale and resiliency

The first decision Alessio and team made was to use fully managed services to allow them to go from ideation to a fully operational service in just a few months. Critical to their approach was adopting a microservices-based architecture with Azure Kubernetes Service and Azure Database for MySQL.

They designed each microservice to be independent, with their own instance of Azure managed services, including Azure Database for MySQL, Azure Event Hub, Azure Storage, Azure Key Vault for credentials and secrets management, and more. They architected for this level of isolation to strengthen security and overall application uptime, as shared dependencies are eliminated.

Each microservice can rapidly scale compute and database resources elastically and independently, based on demand. What’s more, Azure Database for MySQL, allows for the creation of read replicas to offload read-only and analytical queries without impacting payment transaction response times.

Also, from a security perspective, because each microservice runs within its own subnet inside of Azure Virtual Network, the team is able to isolate network and communications back and forth between Azure resources with service principals via Virtual Network service endpoints.

Fast and responsive analytics platform

At its core, HSBC’s PayMe is a social app that allows consumers to establish their personal networks, while facilitating the interactions and transactions with the people in their circle and business entities. In order to create more value for both businesses and consumers, Azure Cosmos DB is used for graph data modelled to store customer-merchant-transaction relationships.

Massive amounts of structured and unstructured data from Azure Database for MySQL, Event Hubs, and Storage are streamed and transformed. The team designed an internally developed data ingestion process, feeding an analytical model called S.L.I.M (simple, lightly, integrated model), optimized for analytics queries performance, as well as making data virtually available to the analytics platform, using Azure Databricks Delta’s unmanaged table capability.

Then machine learning within their analytics platform built on Azure Databricks allows for the quick determination of patterns and relationships, as well as for the detection of anomalous activity.

With Azure, organizations can immediately take advantage of new opportunities to deliver content and services directly to mobile devices, including a next-level digital payment platform.

To learn more about how HSBC architected their cashless digital transaction platform, please watch the full episode.
Learn more about achieving microservice independence with your own instance of a Azure managed service like Azure Database for MySQL.

Quelle: Azure

Get Ready for the Tech Preview of Docker Desktop for WSL 2

Today at OSCON, Scott Hanselman, Kayla Cinnamon, and Yosef Durr of Microsoft demonstrated some of the new capabilities coming with Windows Subsystem for Linux (WSL) 2, including how it will be integrated with Docker Desktop. As part of this demonstration, we are excited to announce that users can now sign up for the end of July Docker Desktop Technical Preview of WSL 2. WSL 2 is the second generation of a compatibility layer for running Linux binary executables natively on Windows. Since it was announced at Microsoft Build, we have been working in partnership with Microsoft to deliver an improved Linux experience for Windows developers and invite everyone to sign up for the upcoming Technical Preview release.

Improving the Linux Experience on Windows

There are over half a million active users of Docker Desktop for Windows today and many of them are building Java and Node.js applications targeting Linux-based server environments. Leveraging WSL 2 will make the Docker developer experience more seamless no matter what operating system you’re running and what type of application you’re building. And the performance improvements will be immediately noticeable.

WSL 2 introduces a significant architectural change as it is a full Linux kernel built by Microsoft, allowing Linux containers to run natively without emulation. With the new WSL 2 Docker Desktop preview you will get access to Linux workspaces, removing the need to maintain both Linux and Windows build scripts. WSL 2 also supports dynamic memory and CPU allocation and an improved startup time down from 40 seconds to 2 seconds! 

Preview of Docker Desktop with WSL2

Thanks to our collaboration with Microsoft, we are already hard at work on getting this into your hands ahead of the WSL 2 full availability. We have written core functionalities to deploy an integration package, run the daemon and expose it to Windows processes, with support for bind mounts and port forwarding to simplify the experience.

For more details on the engineering work involved, read this engineering blog post.

The Tech Preview will be available shortly and we look forward to hearing your feedback.

Sign-up for the Docker Desktop for WSL 2 Tech Preview notification

Interested in trying out the #tech preview of Docker Desktop for WSL 2? Learn more in this blog post and sign up for the beta.Click To Tweet
The post Get Ready for the Tech Preview of Docker Desktop for WSL 2 appeared first on Docker Blog.
Quelle: https://blog.docker.com/feed/

New ways to train custom language models – effortlessly!

Video Indexer (VI), the AI service for Azure Media Services enables the customization of language models by allowing customers to upload examples of sentences or words belonging to the vocabulary of their specific use case. Since speech recognition can sometimes be tricky, VI enables you to train and adapt the models for your specific domain. Harnessing this capability allows organizations to improve the accuracy of the Video Indexer generated transcriptions in their accounts.

Over the past few months, we have worked on a series of enhancements to make this customization process even more effective and easy to accomplish. Enhancements include automatically capturing any transcript edits done manually or via API as well as allowing customers to add closed caption files to further train their custom language models.

The idea behind these additions is to create a feedback loop where organizations begin with a base out-of-the-box language model and improve its accuracy gradually through manual edits and other resources over a period of time, resulting with a model that is fine-tuned to their needs with minimal effort.

Accounts’ custom language models and all the enhancements this blog shares are private and are not shared between accounts.

In the following sections I will drill down on the different ways that this can be done.

Improving your custom language model using transcript updates

Once a video is indexed in VI, customers can use the Video Indexer portal to introduce manual edits and fixes to the automatic transcription of the video. This can be done by clicking on the Edit button at the top right corner of the Timeline pane of a video to move to edit mode, and then simply update the text, as seen in the image below.


The changes are reflected in the transcript, captured in a text file From transcript edits, and automatically inserted to the language model used to index the video. If you were not already using a customer language model, the updates will be added to a new Account Adaptations language model created in the account.

You can manage the language models in your account and see the From transcript edits files by going to the Language tab in the content model customization page of the VI website.

Once one of the From transcript edits files is opened, you can review the old and new sentences created by the manual updates, and the differences between them as shown below.

All that is left is to do is click on Train to update the language model with the latest changes. From that point on, these changes will be reflected in all future videos indexed using that model. Of course, you do not have to use the portal to train the model, the same can be done via the Video Indexer train language model API. Using the API can open new possibilities such as allowing you to automate a recurring training process to leverage ongoing updates.

There is also an update video transcript API that allows customers to update the entire transcript of a video in their account by uploading a VTT file that includes the updates. As a part of the new enhancements, when a customer uses this API, Video Indexer also adds the transcript that the customers uploaded to the relevant custom model automatically in order to leverage the content as training material. For example, calling update video transcript for a video titled "Godfather" will result with a new transcript file named “Godfather” in the custom language model that was used to index that video.

Improving your custom language model using closed caption files

Another quick and effective way to train your custom language model is to leverage existing closed captions files as training material. This can be done manually, by uploading a new closed caption file to an existing model in the portal, as shown in the image below, or by using the create language model and update language model APIs to upload a VTT, SRT or TTML files (similarly to what was done until now with TXT files.)


Once uploaded, VI cleans up all the metadata in the file and strip it down to the text itself. You can see the before and after results in the following table.


Type
Before
After

VTT

NOTE Confidence: 0.891635
00:00:02.620 –> 00:00:05.080
but you don't like meetings before 10 AM.

but you don’t like meetings before 10 AM.

SRT

2
00:00:02,620 –> 00:00:05,080
but you don't like meetings before 10 AM.

but you don’t like meetings before 10 AM.

TTML

<!– Confidence: 0.891635 –>
<p begin="00:00:02.620" end="00:00:05.080">but you don't like meetings before 10 AM.</p>

but you don’t like meetings before 10 AM.

From that point on, all that is left to do is review the additions to the model and click Train or use the train language model API to update the model.

Next Steps

The new additions to the custom language models training flow make it easy for you and your organization to get more accurate transcription results easily and effortlessly. Now, it is up to you to add data to your custom language models, using any of the ways we have just discussed, to get more accurate results for your specific content next time you index your videos.

Have questions or feedback? We would love to hear from you! Use our UserVoice page to help us prioritize features, or email VISupport@Microsoft.com for any questions.
Quelle: Azure

Silo busting 2.0—Multi-protocol access for Azure Data Lake Storage

Cloud data lakes solve a foundational problem for big data analytics—providing secure, scalable storage for data that traditionally lives in separate data silos. Data lakes were designed from the start to break down data barriers and jump start big data analytics efforts. However, a final “silo busting” frontier remained, enabling multiple data access methods for all data—structured, semi-structured, and unstructured—that lives in the data lake.

Providing multiple data access points to shared data sets allow tools and data applications to interact with the data in their most natural way. Additionally, this allows your data lake to benefit from the tools and frameworks built for a wide variety of ecosystems. For example, you may ingest your data via an object storage API, process the data using the Hadoop Distributed File System (HDFS) API, and then ingest the transformed data using an object storage API into a data warehouse.

Single storage solution for every scenario

We are very excited to announce the preview of multi-protocol access for Azure Data Lake Storage! Azure Data Lake Storage is a unique cloud storage solution for analytics that offers multi-protocol access to the same data. Multi-protocol access to the same data, via Azure Blob storage API and Azure Data Lake Storage API, allows you to leverage existing object storage capabilities on Data Lake Storage accounts, which are hierarchical namespace-enabled storage accounts built on top of Blob storage. This gives you the flexibility to put all your different types of data in your cloud data lake knowing that you can make the best use of your data as your use case evolves.

Single storage solution

Expanded feature set, ecosystem, and applications

Existing blob features such as access tiers and lifecycle management policies are now unlocked for your Data Lake Storage accounts. This is paradigm-shifting because your blob data can now be used for analytics. Additionally, services such as Azure Stream Analytics, IoT Hub, Azure Event Hubs capture, Azure Data Box, Azure Search, and many others integrate seamlessly with Data Lake Storage. Important scenarios like on-premises migration to the cloud can now easily move PB-sized datasets to Data Lake Storage using Data Box.

Multi-protocol access for Data Lake Storage also enables the partner ecosystem to use their existing Blob storage connector with Data Lake Storage.  Here is what our ecosystem partners are saying:

“Multi-protocol access for Azure Data Lake Storage is a game changer for our customers. Informatica is committed to Azure Data Lake Storage native support, and Multi-protocol access will help customers accelerate their analytics and data lake modernization initiatives with a minimum of disruption.”

– Ronen Schwartz, Senior Vice President and General Manager of Data Integration, Big Data, and Cloud, Informatica

You will not need to update existing applications to gain access to your data stored in Data Lake Storage. Furthermore, you can leverage the power of both your analytics and object storage applications to use your data most effectively.

Multi-protocol access enables features and ecosystem

Multiple API endpoints—Same data, shared features

This capability is unprecedented for cloud analytics services because not only does this support multiple protocols, this supports multiple storage paradigms. We now bring you this powerful capability to your storage in the cloud. Existing tools and applications that use the Blob storage API gain these benefits without any modification. Directory and file-level access control lists (ACL) are consistently enforced regardless of whether an Azure Data Lake Storage API or Blob storage API is used to access the data.  

Multi-protocol access on Azure Data Lake Storage

Features and expanded ecosystem now available on Data Lake Storage

Multi-protocol access for Data Lake Storage brings together the best features of Data Lake Storage and Blob storage into one holistic package. It enables many Blob storage features and ecosystem support for your data lake storage.

Features
More information

Access tiers
Cool and Archive tiers are now available for Data Lake Storage. To learn more, see the documentation “Azure Blob storage: hot, cool, and archive access tiers.”

Lifecycle management policies
You can now set policies to a tier or delete data in Data Lake Storage. To learn more, see the documentation “Manage the Azure Blob storage lifecycle.”

Diagnostics logs
Logs for the Blob storage API and Azure Data Lake Storage API are now available in v1.0 and v2.0 formats. To learn more, see the documentation "Azure Storage analytics logging."

SDKs
Existing blob SDKs can now be used with Data Lake Storage. To learn more, see the below documentation:

Azure Blob storage client library for .NET
Azure Blob storage client library for Java
Azure Blob storage client library for Python

PowerShell
PowerShell for data plane operations is now available for Data Lake Storage. To learn more, see the Azure PowerShell quickstart.

CLI
Azure CLI for data plane operations is now available for Data Lake Storage. To learn more, see the Azure CLI quickstart.

Notifications via Azure Event Grid
You can now get Blob notifications through Event Grid. To learn more, see the documentation “Reacting to Blob storage events.” Azure Data Lake Storage Gen2 notifications are currently available.


Ecosystem partner
More information

Azure Stream Analytics
Azure Stream Analytics now writes to, as well as reads from, Data Lake Storage.

Azure Event Hubs capture
The capture feature within Azure Event Hubs now lets you pick Data Lake Storage as one of its destinations.

IoT Hub
IoT Hub message routing now allows routing to Azure Data Lake Storage Gen 2.

Azure Search
You can now index and apply machine learning models to your Data Lake Storage content using Azure Search.

Azure Data Box
You can now ingest huge amounts of data from on-premises to Data Lake Storage using Data Box.

Please stay tuned as we enable more Blob storage features using this amazing capability.

Next steps

All these new capabilities are available today in West US 2 and West Central US. Sign up for the preview today. For more information, please see our documentation on multi-protocol access for Azure Data Lake Storage.
Quelle: Azure

Making it easier to bring your Linux based web apps to Azure App Service

Application development has radically changed over the years. From having to host all the physical hardware hosting the app and its dependences on-premises, to moving to a model where the hardware is hosted by external companies yet still managed by the users on to hosting your apps on a fully managed platform where all hardware and software management is done by the hosting provider. And then finally over to a full serverless solution where no resources need to be set up to run applications.

The perception of complexity in running smaller solutions in the cloud are slowly being eradicated due to moving solutions to a managed platform, where even non-technical audiences can manage their application in the cloud.

A great example in the managed platform realm is Azure App Service. Azure App Service provides an easy way to bring source code or containers and deploy full web apps in minutes, with the ease of configuration settings at the hands of the app owner. Built in features such as secure sockets layer (SSL) certificates, custom domains, auto-scaling, setting up a continuous integration and deployment (CI/CD) pipeline, diagnostics, troubleshooting, and much more, provides a powerful platform for full cycle build and management of the applications. Azure App Service also abstracts all of the infrastructure and its management overhead away from the users, maintaining the physical hardware running the service, patching security vulnerabilities, and continuously updating the underlying operating system.

Even in the managed platform world where customers shouldn’t care about the underlying platform they are physically running on, the reality is that some applications, depending on their framework, perform better on a specific operating system. This is the reason the team is putting a lot of work into the Linux hosting offering and making it easier to try it out. This includes our recent announcement about the free tier for Linux web apps, making it quick and simple to try out the platform with no commitments.

We’re excited to introduce a promotional price on the Basic app service plan for Linux, which depending on regional meters in your datacenter of choice, leads to a 66 percent price drop!

You can use the free tier to test the platform out, and then move up to the Basic tier and enjoy more of the platform’s capabilities. You can host many frameworks on this tier, including WordPress sites, Node.js, Python, Java, and PHP sites, and one of the most popular options that we’ve seen on the Linux offering – custom docker containers. Running a container hosted in Azure App Service provides an easy on-ramp for customers wanting to enjoy a fully managed platform, but also want a single deployable artifact containing an app and all of its dependencies, or want to work with a custom framework or version beyond the defaults built into the Azure App Service platform.

You can even use the Linux offering with networking solutions to secure your app using the preview feature of Azure virtual networks (VNet) integration to connect to an on-premise database, or to call into an Azure virtual network of your choice. You may also use access restrictions to control where your app may receive traffic from and place additional safeguards on the platform level.

What now? If you have a web workload you’re thinking of taking to the next level, try out Azure App Service now! Explore all of the possibilities waiting for you as you host your code or container on a managed platform that currently hosts more than two million sites!

Create your free Azure trial today.

Post on the Microsoft Developer Network forum for questions about Azure App Service.

If you have a feature suggestion for the product, please enter it in the feedback forum.
Quelle: Azure

Introducing the What-If Tool for Cloud AI Platform models

Last year our TensorFlow teamannounced theWhat-If Tool, an interactive visual interface designed to help you visualize your datasets and better understand the output of your TensorFlow models. Today, we’re announcing a new integration with the What-If Tool to analyze your models deployed onAI Platform. In addition to TensorFlow models, you can also use the What-If Tool for your XGBoost and Scikit Learn models deployed on AI Platform.As AI models grow in complexity, understanding the inner workings of a model makes it possible to explain and interpret the outcomes driven by AI. As a result, AI explainability has become a critical requirement for most organizations in industries like financial services, healthcare, media and entertainment, and technology. With this integration, AI Platform users can develop a deeper understanding of how their models work under different scenarios, and build rich visualizations to explain model performance to business users and other stakeholders of AI within an enterprise.With just one method call, you can connect your AI Platform model to the What-If Tool:You can use this new integration from AI Platform Notebooks, Colab notebooks, or locally via Jupyter notebooks. In this post, we’ll walk you through an example using an XGBoost model deployed on AI Platform.Getting started: deploying a model to AI PlatformIn order to use this integration, you’ll need a model deployed on Cloud AI Platform. Once you’ve trained a model, you can deploy it to AI Platform using the gcloud CLI. If you don’t yet have a Cloud account, we’ve got one notebook that runs the What-if Tool on a public Cloud AI Platform model so you can easily try out the integration before you deploy your own.The XGBoost example we’ll be showing here is a binary classification model for predicting whether or not a mortgage application will be approved, trained on this public dataset. In order to deploy this model, we’ve exported it to a .bst model file (the format XGBoost uses) and uploaded this to a Cloud Storage bucket in our project. We can deploy it with this command (make sure to define the environment variables when you run this):Connecting your model to the What-If ToolOnce your model has been deployed, you can view its performance on a dataset in the What-If Tool by setting up a WitConfigBuilder object as shown in the code snippet above. Provide your test examples in the format expected by the model, whether that be a list of JSON dictionaries, JSON lists, or tf.Example protos. Your test examples should include the ground truth labels so you can explore how different features impact your model’s predictions. Point the tool at your model through your project name, model name, and model version, and optionally set the name of the feature in the dataset that the model is trying to predict. Additionally, if you want to compare the performance of two models on the same dataset, set the second model using the set_compare_ai_platform_model method. One of our demo notebooks shows you how to use this method to compare tf.keras and Scikit Learn models deployed on Cloud AI Platform.Understanding What-If Tool visualizationsClick here for a full walkthrough of the features of the What-If Tool.The initial view in the tool is the Datapoint Editor, which shows all examples in the provided dataset and their results from prediction through the model:Click on any example in the main panel to see its details in the left panel. You can change anything about the datapoint and run it again through the model to see how the changes affect prediction. The main panel can be organized into custom visualizations (confusion matrices, scatter plots, histograms, and more) using the dropdown menus at the top. Click the partial dependence plot option in the left panel to see how changing each feature individually for a datapoint causes the model results to change, or click the “Show nearest counterfactual datapoint” toggle to compare the selected datapoint to the most similar datapoint that the model predicted a different outcome for.The Performance + Fairness tab shows aggregate model results over the entire dataset:Additionally, you can slice your dataset by features and compare performance across those slices, identifying subsets of data on which your model performs best or worst, which can be very helpful for ML fairness investigations.Using What-If Tool from AI Platform NotebooksThe WitWidget comes pre-installed in all TensorFlow instances of AI Platform Notebooks.You can use it in exactly the same way as we’ve described above, by calling set_ai_platform_model to connect the What-If Tool to your deployed AI Platform models.Start buildingWant to start connecting your own AI Platform models to the What-If Tool? Check out these demos and resources:Demo notebooks: these work on Colab, Cloud AI Platform Notebooks, and Jupyter. If you’re running them from AI Platform Notebooks, it will work best if you use one of the TensorFlow instance types.XGBoost playground example: connect the What-If Tool to an XGBoost mortgage model already deployed on Cloud AI Platform. No Cloud account is required to run this notebook.End-to-end XGBoost example: train the XGBoost mortgage model described above on your own project, and use the What-If Tool to evaluate it.tf.keras and Scikit Learn model comparison: build tf.keras and Scikit Learn models trained on the UCI wine quality dataset and deploy them to Cloud AI Platform. Then use the What-If Tool to compare them.What-If Tool: For a detailed walkthrough of all the What-If Tool features, check out their guide or the documentation.We’re actively working on introducing more capabilities for model evaluation and understanding within the AI Platform to help you meaningfully interpret how your models make predictions, and build end user trust through model transparency. And if you use our new What-If Tool integration we’d love your feedback. Find us on Twitter at @SRobTweets and @bengiswex.
Quelle: Google Cloud Platform

Conversational AI updates for July 2019

At Build, we highlighted a few customers who are building conversational experiences using the Bot Framework to transform their customer experiences. For example, BMW discussed its work on the BMW Intelligent Personal Assistant to deliver conversational experiences across multiple canvases by leveraging the Bot Framework and Cognitive Services. LaLiga built their own virtual assistant which allows fans to experience and interact with LaLiga across multiple platforms.

With the Bot Framework release in July, we are happy to share new releases of Bot Framework SDK 4.5 and preview of 4.6, updates to our developer tools, and new channels in Azure Bot Service. We’ll use the opportunity to provide additional updates for the Conversational AI releases from Microsoft.

Bot Framework channels

We continue to expend channels support and functionality for Bot Framework and Azure Bot Service.

Voice-first bot applications: Direct Line Speech preview

The Microsoft Bot Framework lets you connect with your users wherever your users are. We offer thirteen supported channels, including popular messaging apps like Skype, Microsoft Teams, Slack, Facebook Messenger, Telegram, Kik, as well as a growing number of community adapters.

Today, we are happy to share the preview of Direct Line Speech channel. This is a new channel designed for voice-first experiences for your Bot Framework utilizing Microsoft’s Speech Services technologies.  he Direct Line Speech channel is a native implementation of speech for mobile applications and IoT devices, with support for Text-to-speech, Speech-to-text, and custom wake words.  We’re happy to share that we’re now opening the preview to all Bot Framework customers.

Getting started with voice support to your bot is easy. Simply update to the latest Bot Framework SDK, configure the Direct Line Speech channel for your bot, and use the Speech SDK to embed voice into your mobile application or device today.

Better isolation for your bot: Direct Line App Service Extension

Direct Line and Webchat are used broadly by Bot Framework customers to provide chat experiences on their web pages, mobile apps, and devices. For some scenarios, customers have given us the feedback that they’d like a version of Direct Line that can be deployed in isolation, such as in a Virtual Network (VNET). A VNET lets you create your own private space in Azure and is crucial to your cloud network as it offers isolation, segmentation, and other key benefits. The Direct Line App Service Extension can be deployed as part of a VNET, allowing IT administrators to have more control over conversation traffic and improve latency in conversations due to reduction in the number of hops. Feel free to get started with Direct Line App Service Extension.

Bot Framework SDK

As part of the Bot Framework SDK 4.6 preview we updated Adaptive Dialog, which allows developers to dynamically update conversation flow based on context and events. This is especially handy when dealing with conversation context switches and interruptions in the middle of a conversation. Learn more by reading the documentation and reviewing the samples.

Continuing our commitment to the Open Source community and following on our promise to allow developers to use their favorite programing language, we updated Bot Framework Python SDK. The Python SDK now supports OAuth, Prompts, CosmosDB, and includes all major functionality in SDK 4.5. In addition we got new samples.

Addressing customers’ and developers’ ask for better testing tools, the July version of the SDK introduces a new unit testing capability. The Microsoft.Bot.Builder.testing package simplifies the process of unit testing dialogs in your bot. Check out the documentation and samples.

Introduced at Microsoft Build 2019, the Bot Inspector is a new feature in the Bot Framework Emulator which lets you debug and test bots on channels like Microsoft Teams, Slack, Cortana, and more. As you use the bot on specific channels, messages will be mirrored to the Bot Framework Emulator where you can inspect the message data that the bot received. Additionally, a snapshot of the bot memory state for any given turn between the channel and the bot is rendered as well.

Following enterprise customers asks, we put together a web chat sample for a single sign-on to enterprise apps using OAuth. In this sample, we show how to authorize a user to access resources on an enterprise app with a bot. Two types of resources are used to demonstrate the interoperability of OAuth, Microsoft Graph and GitHub API.

Solutions

Virtual agent solution accelerator

We updated the Virtual Assistant and associated skills to enable out-of-box support for Direct Line Speech opening voice assistant experiences with no additional steps. This includes middleware to enable control of the voice being used. Once a new Virtual Assistant has been deployed, you can follow instructions for configuring Virtual Assistant with the Direct Line Speech channel. The example test harness application is also provided to enable you to quickly and easily test Speech scenarios.

An Android app client for Virtual Assistant is also available which integrates with Direct Line Speech and Virtual Assistant, demonstrating how a device client can interact with your Virtual Assistant and render Adaptive Cards.

In addition, we have added out-of-box support for Microsoft Teams ensuring that your Virtual Assistant and skills work including authentication and adaptive cards. You can follow steps for creating the associated application manifest.

The Virtual Assistant Solution Accelerator provides a set of templates, solution accelerators, and skills to help build sophisticated conversational experiences. A new Android app client for Virtual Assistant that integrates with Direct Line Speech and Virtual Assistant demonstrates how a device client can interact with your Virtual Assistant and render adaptive cards. Updates also include support for Direct-Line Speech and Microsoft Teams.

The Dynamics 365 Virtual Agent for Customer Service preview provides exceptional customer service with intelligent, adaptable virtual agents. Customer service experts can easily create and enhance bots with AI-driven insights. The Dynamic 365 Virtual Agent is built on top of the Bot Framework and Azure.
Quelle: Azure

Operate with confidence: Keeping your functions functioning with monitoring, logging and error reporting

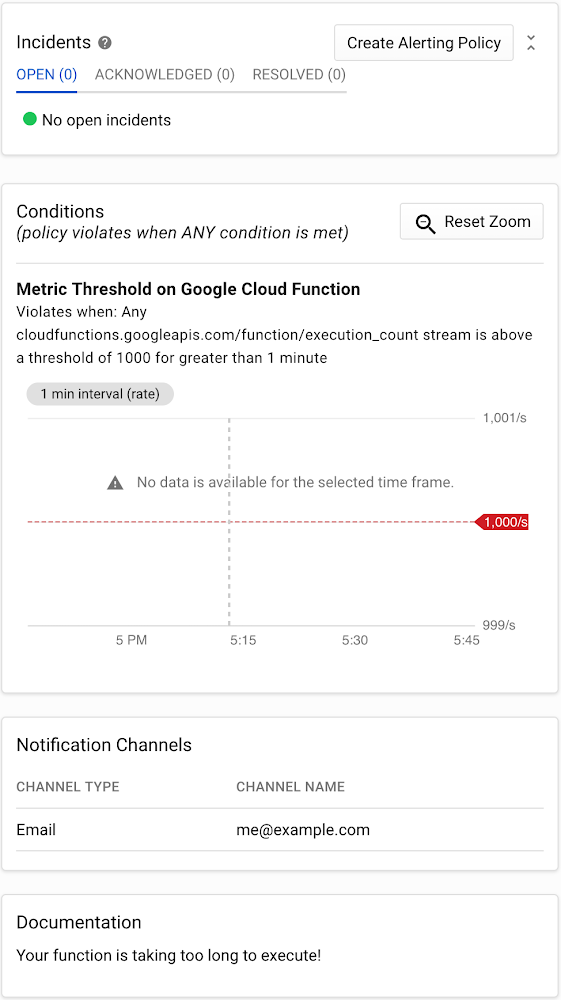
If you want to keep bugs from making it into production, it’s important to have a comprehensive testing plan that employs a variety of techniques. But no matter how complete your plan might be, tests are bound to miss bugs every now and then, which get pushed into production.In our previous post, Release with confidence: How testing and CI/CD can keep bugs out of production, we discussed ways to reduce bugs in a Cloud Functions production environment. In this post, we’ll show you how to find bugs that did slip through as quickly and painlessly as possible by answering two basic questions: if there is a problem in our code, and where in our codebase that problem occurred.  To do this, you have to monitor your functions and keep an eye out for unusual values in key metrics. Of course, not all unusual values are due to errors—but the occasional false alarm is almost always better than not getting an alert when something goes wrong. Then, once you have monitoring in place and are receiving alerts, examining function and error logs will help you further isolate where the bugs are happening, and why.  Stackdriver, Google Cloud’s provider-agnostic suite of monitoring, logging, and Application Performance Management (APM) tools, is a natural starting point for monitoring your Cloud Functions. Stackdriver Monitoring’s first-party integration with Cloud Functions makes it easy to set up a variety of metrics for Cloud Functions deployments.Stackdriver Monitoring is typically used along with a set of companion Stackdriver tools, including Logging, Error Reporting, and Trace. Stackdriver Logging and Error Reporting are natively integrated with Cloud Functions, and Stackdriver Trace is relatively simple to install.Monitoring: Is there a problem?Once you have a monitoring stack in place, it’s time to go bug hunting! When looking for bugs in production, the first thing you want to know is if there is a problem in your code. The best way to answer this question is to set up a monitoring and alerts policy with different types and levels of monitoring. Generally speaking, the more metrics you monitor, the better. Even if you don’t have  time to implement a comprehensive level of monitoring from the start, some is always better than none. Also, you don’t have to set up your monitoring all at once—start with the basics and build from there. Basic monitoringThe first level of monitoring is to set up alerts for when severe log entries, such as errors, become too frequent. A good rule of thumb is to consider errors that are greater than a certain percentage of function invocations. Of course, this percentage will depend on your use case. For stable mission-critical applications, you might send an alert if 0.5%, 0.1%, or even 0.01% of your invocations fail. For less critical and/or unstable applications, alert thresholds of 1% – 5% can help reduce the likelihood of receiving too many false alarms.Intermediate monitoringNext, you should set up alerts for when certain metrics exceed normal limits. Ideally this should be built on top of error monitoring, since different monitoring techniques catch different potential issues. Two metrics that are particularly useful are execution time and invocation count. As their names suggest, execution time measures the amount of time it takes your function to execute, and invocation count is the number of times a function is called during a certain time period. Once you’ve set up the triggers you want to monitor, you need to calibrate your alerts. That may take some time depending on your application. Your goal should be to find a range that avoids getting too many or too few alerts. It can be tempting to set relatively low alert thresholds, on the theory that it’s better to receive more alerts than fewer. This is generally true, but at extreme levels, you may find yourself getting too many alerts, leading you to ignore potential emergencies. The reverse is also true: If your metrics are too lax, you may not get an alarm at all and miss a significant issue.Generally, for both metrics, it’s ideal to set alert thresholds of about two-to-four times greater than your normal maximums and .25-.5 times your normal minimums. Advanced monitoringA step up from monitoring execution time and invocation count is to monitor your functions’ memory use, using Stackdriver HTTP/S uptime checks (for HTTP/S-triggered functions), and monitoring other components of your overall application (such as any Cloud Pub/Sub topics that trigger functions). Again, finding the sweet spot of when to get alerts is critical.An example Stackdriver alerting policy that emails you when your functions take too long to complete.Logging and error reporting: Where’s the broken code?Once you’re alerted to the fact that something is wrong in your production environment, the next step is to determine where it’s broken. For this step, we can take advantage of Stackdriver Logging and Error Reporting.Stackdriver Logging stores and indexes your function logs. Error Reporting aggregates and analyzes these logs in order to generate meaningful reports. Both features are relatively easy to use, and together they provide critical information that helps you quickly determine where errors are occurring.In our example above, the log shows an error: “Uninitialized email address.” By looking at the report for this error, we can find several important pieces of information:The name of the Cloud Function involved (onNewMessage)How many times the error  has occurredWhen the error started: It first occurred 13 days ago and was last seen six days ago.Data points like these make the process of pinpointing and fixing production errors much quicker, helping to reduce the impact of bugs in production.Bugs begoneTesting is rarely perfect. A solid monitoring system can provide an additional line of defense against bugs in production, and Stackdriver tools provide all the monitoring, logging, and error reporting you need for your Cloud Functions applications. Combined with the lessons from the first post of this series on testing and CI/CD, you can reduce the number of bugs that slip into your production environment, and minimize the damage caused by those that do find their way there.
Quelle: Google Cloud Platform

Azure Monitor for containers with Prometheus now in preview

Prometheus is a popular open source metric monitoring solution and is a part of Cloud Native Compute Foundation. We have many customers who like the extensive metrics which Prometheus provides on Kubernetes. However, they also like how easy it is to use Azure Monitor for containers which provides fully managed, out of the box monitoring for Azure Kubernetes Service (AKS) clusters. We have been receiving requests to funnel the Prometheus data into Azure Monitor and today, we are excited to share Prometheus integration with Azure Monitor for containers is now in preview and brings together the best of two worlds.

Typically, to use Prometheus you need to setup and manage a Prometheus server with a database. With the Azure Monitor integration, no Prometheus server is needed. You just need to expose the Prometheus end-point through your exporters or pods (application), and the containerized agent for Azure Monitor for containers can scrape the metrics for you. We have provided a seamless onboarding experience to collect Prometheus metrics with Azure Monitor. The example below shows how the coredns metrics, which is part of the kube-dns-metric, is collected into Azure Monitor for logs. 

You can also collect workload metrics from your containers by instrumenting Prometheus SDK into your application. The example below shows the collection of the prommetrics_demo_requests_counter. You can collect workload metrics through URL, endpoints, or pod annotation as well.

Full stack monitoring with Azure Monitor for containers

So how does Prometheus metrics fit in with the rest of the metrics including the recently added storage and network performance metrics that Azure Monitor for containers already provides. You can see how the metrics all fit together below. Azure Monitor for containers provides out of the box telemetry at the platform, container, orchestrator level, and to an extent the workload level. With the additional workload metrics from Prometheus you now get full stack, end to end monitoring view for your Azure Kubernetes Services (AKS) in Azure Monitor for containers.

Visualizing Prometheus metrics on Azure dashboard and alerting

Once the metrics are stored in Azure Monitor logs, you can query against the metrics using Log Analytics with Kusto Query Language (KQL). Here’s a sample query that instruments the Prometheus SDK.  You can quickly plot the result using queries in the Azure portal.

<Queries>
InsightsMetrics
| where Name == "prommetrics_demo_requests_counter_total"
| extend dimensions=parse_json(Tags)
| extend request_status = tostring(dimensions.request_status)
| where request_status == "bad"
| where TimeGenerated > todatetime('2019-07-02T09:40:00.000')
| where TimeGenerated < todatetime('2019-07-02T09:54:00.000')
| project request_status, Val, TimeGenerated | render timechart

You can pin the chart to your Azure dashboard and create your own customized dashboard. You can also pin your current pod and node charts to the dashboard from the Azure Monitor for container cluster view.

If you would like to alert against the Prometheus metrics, you can do so using alerts in Azure. 

This has been an exciting integration for us, and we are looking to continue our effort to help our customers on monitoring Kubernetes. For more information on configuring the agent to collect Prometheus data, querying, and using the data on Azure Monitor for containers, visit our documentation. Prometheus provides rich and extensive telemetry, if you need to understand the cost implications here’s a query which will show you the data ingested from Prometheus into Azure Monitor logs.

For available metrics on Prometheus, please go to Prometheus website.

For any feedback or suggestions, please reach out to us through the techforum or stackoverflow.
Quelle: Azure