Identity and authentication, the Google Cloud way

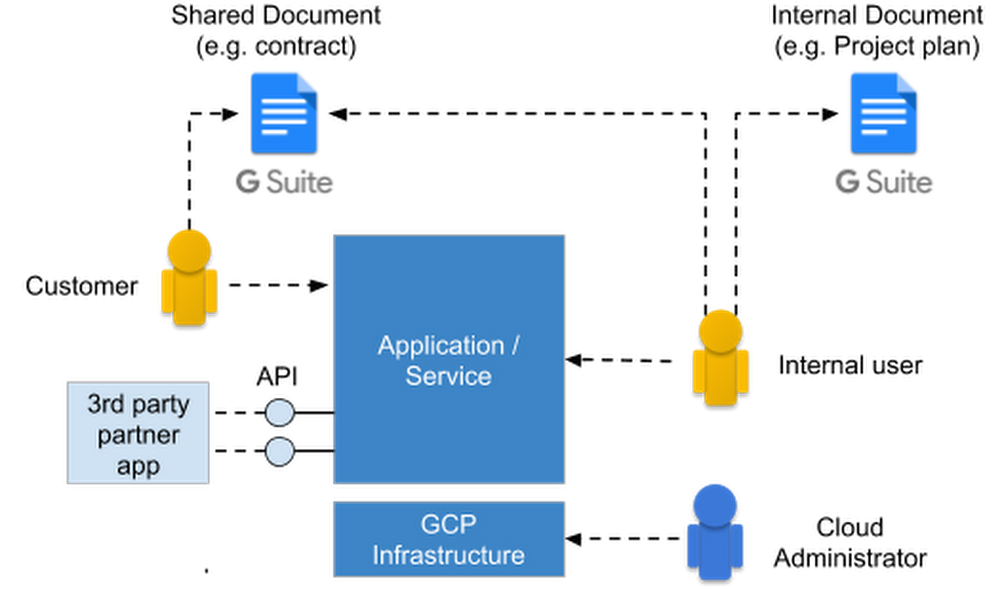
Users expect simple and secure sign-up, sign-in, and self-service experiences from all their favorite devices. As a security professional, you could build identity and access management functionality for your organization, but that’s hard and expensive: you’d need to build and maintain an identity platform that stays up-to-date with constantly evolving authentication requirements, keeps user accounts secure in the face of increasing threats, and scale the system reliably when the demand for the service grows. Or, you can have Google do it for you.Whatever your identity needs, Google Cloud has a complete set of tools that you can integrate to create a modern, sophisticated identity platform. This post describes Google Cloud’s authentication and identity management offerings to help you determine what solution best fits your needs.Authentication use casesSetting up authentication can be tricky. You’ve got a variety of use cases—everything from workplace productivity suites, cloud-based resources and APIs. Some authentication is done on behalf of a piece of software, e.g., when one service invokes another service’s API. Most other authentication is based on user populations, including customers, partners, and employees. Some of these populations collaborate through shared resources, e.g., a G Suite document that’s shared between an employee and a customer. The following diagram shows a potential (simplified) scenario:In all but the most trivial cases, there are lots of different types of users that need to be authenticated:Internal users accessing workplace or office productivity solutionsInternal users accessing third-party appsInternal users accessing internally built and hosted appsInternal users accessing and administering cloud resources directlyUsers making a proxy call to an API (tracking who made call, and on behalf of which end user the request was made)External users accessing applicationsIf you deploy your own applications, those too need to be authenticated. Examples include:API calls from internal servicesAPI calls from third partiesDevices authenticating to cloud-hosted servicesWith this variety of users, use cases and applications, it can be confusing to know which identity and authentication method to use, in what circumstances.  GCP identity management and authentication methodsGoogle Cloud offers a number of authentication and identity management solutions that support many common use cases:Cloud Identity- Cloud Identity is an Identity as a Service (IDaaS) and enterprise mobility management (EMM) product that offers identity services and endpoint administration for G Suite or as a stand-alone product. As an administrator, you can use Cloud Identity to manage your users, apps, and devices from the central Google Admin console. Click here to learn more about Cloud Identity features.Secure LDAP – This feature of Cloud Identity and G Suite lets employees access LDAP-based apps and infrastructure using their Cloud Identity (or G Suite) credentials. With Secure LDAP, IT teams can use a single cloud-based identity and access management solution (Cloud Identity) to enable employees access to both SaaS and traditional apps/infrastructure.Cloud Identity for Customers and Partners (CICP) – CICP is a customer identity and access management (CIAM) platform that lets you add Google-grade identity management functionality to your apps. Built on top of Firebase Authentication, CICP provides an end-to-end authentication system for third-party users to access your apps and services, including mobile/web apps, games, and APIs, to name a few. If you’re building a service on Google Cloud (or anywhere else for that matter), and need secure, yet easy-to-use authentication capabilities, check out CICP.In addition to managing/federating end user credentials, CICP also provides a token brokerage service.API Proxies (Apigee Edge / Cloud Endpoints) – Google Cloud API proxies are an abstraction layer that “fronts” for your backend service APIs, providing not only a proxy but also management and security features such as authentication and validation. That way, you know what is calling your APIs, with short-lived tokens and logging helping to prevent their unauthorized use. Google Cloud provides two options: Cloud Endpoints are a great choice across GCP while Apigee Edge works cross-platform and includes enterprise features like rate limiting, quotas, analytics, and more.Cloud Identity-Aware Proxy (IAP) – Cloud IAP works by verifying user identity and the context of a request to access a cloud-based application hosted on GCP. It determines if a user should be allowed to access the application. Cloud IAP is a building block toward BeyondCorp, an enterprise security model that enables every employee to work from untrusted networks without having to use a VPN.When Cloud IAP grants a user access to an application or resource, they’re subject to the fine-grained access controls implemented by the product in use without requiring a VPN. When a user tries to access a Cloud IAP-secured resource, Cloud IAP performs authentication and authorization checks. Context-aware access allows organizations to define and enforce granular access to GCP workloads and G Suite based on a user’s identity and the context (location, device, etc.) of their request. Context-aware access verifies that:The user is trusted: they have a password, authentication strength (e.g. 2SV, Security Keys), and Cloud IAP’s machine-learning detects no abnormal user behaviour.The device is trusted with Endpoint Verification.The location is trusted (IP address).Authenticating against GCP  – Authenticating directly to GCP requires a recognized identity such as a Google account, a service account, a Google Group or a Cloud Identity or G Suite identity (including identities that have been synced with Cloud Identity).Mapping your use case to a GCP authentication methodNote in all cases we assume that GCP is the identity providerThe following matrix helps you determine what identity/authentication solution is appropriate for your use case:Internal user authentication requirementsApplication access authentication requirementsAuthentication decision treeIf text and tables aren’t your thing, here’s a visual way to help you decide how to pick the appropriate identity and authentication method for your use case.As you can see, Google Cloud provides a wealth of authentication options for seemingly any kind of user or application. To learn more about identity and authentication of Google Cloud, check out the resources in this blog post. Then, there’s also the Security & Identity Fundamentals quest1, a hands-on training course. And be sure to let us know about any use cases that aren’t covered here!1. Use code 1j-security-983 and get one month of Qwiklabs access to complete the quest free of charge (redeem by Jan 31, 2019)
Quelle: Google Cloud Platform

Questions on data residency and compliance in Microsoft Azure? We got answers!

Questions about the security of and control over customer data, and where it resides, are on the minds of cloud customers today. We’re hearing you, and in response, we published a whitepaper that gives clear answers and guidance into the security, data residency, data flows, and compliance aspects of Microsoft Azure. The paper is designed to help our customers ensure that their customer data on Azure is handled in a way that meets their data protection, regulatory, and sovereignty requirements.

Transparency and control are essential to establishing and maintaining trust in cloud technology, while restricted and regulated industries have additional requirements for risk management and to ensure ongoing compliance. To address this, Microsoft provides an industry-leading security and compliance portfolio.

Security is built into the Azure platform beginning with the development process, which is conducted in accordance with the Security Development Lifecycle (SDL). Azure also includes technologies, controls, and tools that address data management and governance, such as Active Directory identity and access controls, network and infrastructure security technologies and tools, threat protection, and encryption to protect data in transit and at rest.

Microsoft gives customers options so they can control the types of data and locations where customer data is stored on Azure. With the innovation of the security and compliance frameworks, customers in regulated industries can confidently run mission-critical workloads in the cloud and leverage all the advantages of Microsoft’s hyperscale cloud.

Download the whitepaper, “Achieving compliant data residency and security with Azure.”

Learn more and get a list of Microsoft‘s compliance offerings on the Microsoft Trust Center site.
Quelle: Azure

Performance troubleshooting using new Azure Database for PostgreSQL features

At Ignite 2018, Microsoft’s Azure Database for PostgreSQL announced the preview of Query Store (QS), Query Performance Insight (QPI), and Performance Recommendations (PR) to help ease performance troubleshooting, in response to customer feedback. This blog intends to inspire ideas on how you can use features that are currently available to troubleshoot some common scenarios.

A previous blog post on performance best practices touched upon the layers at which you might be experiencing issues based on the application pattern that you are using. This blog nicely categorizes the problem space into several areas and the common techniques to rule out possibilities to quickly get to the root cause. We would like to further expand on this with the help of these newly announced features (QS, QPI, and PR).

In order to use these features, you will need to enable data collection by setting pg_qs.query_capture_mode and pgms_wait_sampling.query_capture_mode to ALL.

You can use Query Store for a wide variety of scenarios where you can enable data collection to help with troubleshooting these scenarios better. In this article, we will limit the scope to regressed queries scenario.

Regressed queries

One of the important scenarios that Query Store enables you to monitor is the regressed queries. By setting pg_qs.query_capture_mode to ALL, you get a history of your query performance over time. We can leverage this data to do simple or more complex comparisons based on your needs.

One of the challenges you face when generating a regressed query list is the selection of comparison period in which you baseline your query runtime statistics. There are a handful of factors to think about when selecting the comparison period:

Seasonality: Does the workload or the query of your concern occur periodically rather than continuously?
History: Is there enough historical data?
Threshold: Are you comfortable with a flat percentage change threshold or do you require a more complex method to prove the statistical significance of the regression?

Now, let’s assume no seasonality in the workload and that the default seven days of history will be enough to evaluate a simple threshold of change to pick regressed queries. All you need to do is to pick a baseline start and end time, and a test start and end time to calculate the amount of regression for the metric you would like to track.

Looking at the past seven-day history, compared to last two hours of execution, below would give the top regressed queries in the order of descending percentage. Note that if the result set has negative values, it indicates an improvement from baseline to test period when it’s zero, it may either be unchanged or not executed during the baseline period.

create or replace function get_ordered_query_performance_changes(
baseline_interval_start int,
baseline_interval_type text,
current_interval_start int,
current_interval_type text)
returns table (
query_id bigint,
baseline_value numeric,
current_value numeric,
percent_change numeric
) as $$
with data_set as (
select query_id
, round(avg( case when start_time >= current_timestamp – ($1 || $2)::interval and start_time < current_timestamp – ($3 || $4)::interval then mean_time else 0 end )::numeric,2) as baseline_value
, round(avg( case when start_time >= current_timestamp – ($3 || $4)::interval then mean_time else 0 end )::numeric,2) as current_value
from query_store.qs_view where query_id != 0 and user_id != 10 group by query_id ) ,
query_regression_data as (
select *
, round(( case when baseline_value = 0 then 0 else (100*(current_value – baseline_value) / baseline_value) end )::numeric,2) as percent_change
from data_set )
select * from query_regression_data order by percent_change desc;
$$
language 'sql';

If you create this function and execute the following, you will get the top regressed queries in the last two hours in descending order compared to their calculated baseline value over the last seven days up to two hours ago.

select * from get_ordered_query_performance_changes (7, 'days', 2, 'hours');

The top changes are all good candidates to go after unless you do expect the kind of delta from your baseline period because, say, you know the data size would change or the volume of transactions would increase. Once you identified the query you would like to further investigate, the next step is to look further into query store data and see how the baseline statistics compare to the current period and collect additional clues.

create or replace function compare_baseline_to_current_by_query_id(baseline_interval_cutoff int,baseline_interval_type text,query_id bigint,percentile decimal default 1.00)
returns table(
query_id bigint,
period text,
percentile numeric,
total_time numeric,
min_time numeric,
max_time numeric,
rows numeric,
shared_blks_hit numeric,
shared_blks_read numeric,
shared_blks_dirtied numeric,
shared_blks_written numeric,
local_blks_hit numeric,
local_blks_read numeric,
local_blks_dirtied numeric,
local_blks_written numeric,
temp_blks_read numeric,
temp_blks_written numeric,
blk_read_time numeric,
blk_write_time numeric
)
as $$

with data_set as
( select *
, ( case when start_time >= current_timestamp – ($1 || $2)::interval then 'current' else 'baseline' end ) as period
from query_store.qs_view where query_id = ( $3 )
)
select query_id
, period
, round((case when $4 <= 1 then 100 * $4 else $4 end)::numeric,2) as percentile
, round(percentile_cont($4) within group ( order by total_time asc)::numeric,2) as total_time
, round(percentile_cont($4) within group ( order by min_time asc)::numeric,2) as min_time
, round(percentile_cont($4) within group ( order by max_time asc)::numeric,2) as max_time
, round(percentile_cont($4) within group ( order by rows asc)::numeric,2) as rows
, round(percentile_cont($4) within group ( order by shared_blks_hit asc)::numeric,2) as shared_blks_hit
, round(percentile_cont($4) within group ( order by shared_blks_read asc)::numeric,2) as shared_blks_read
, round(percentile_cont($4) within group ( order by shared_blks_dirtied asc)::numeric,2) as shared_blks_dirtied
, round(percentile_cont($4) within group ( order by shared_blks_written asc)::numeric,2) as shared_blks_written
, round(percentile_cont($4) within group ( order by local_blks_hit asc)::numeric,2) as local_blks_hit
, round(percentile_cont($4) within group ( order by local_blks_read asc)::numeric,2) as local_blks_read
, round(percentile_cont($4) within group ( order by local_blks_dirtied asc)::numeric,2) as local_blks_dirtied
, round(percentile_cont($4) within group ( order by local_blks_written asc)::numeric,2) as local_blks_written
, round(percentile_cont($4) within group ( order by temp_blks_read asc)::numeric,2) as temp_blks_read
, round(percentile_cont($4) within group ( order by temp_blks_written asc)::numeric,2) as temp_blks_written
, round(percentile_cont($4) within group ( order by blk_read_time asc)::numeric,2) as blk_read_time
, round(percentile_cont($4) within group ( order by blk_write_time asc)::numeric,2) as blk_write_time
from data_set
group by 1, 2
order by 1, 2 asc;
$$
language 'sql';

Once you create the function, provide the query id you would like to investigate. The function will compare the aggregate values between the before and after based on the cutoff time you provide. For instance, the below statement would compare all points prior to two hours from now to points after the two hours mark up until now for the query. If you are aware of outliers that you want to exclude, you can use a percentile value.

select * from compare_baseline_to_current_by_query_id(30, 'minutes', 4271834468, 0.95);

If you don’t use any, the default value is 100 which does include all data points.

select * from compare_baseline_to_current_by_query_id(2, 'hours', 4271834468);

If you rule out that there is not a significant data size change and the cache hit ratio is rather steady, you may also want to investigate any obvious wait event occurrence changes within the same period. As wait event types combine different wait types into buckets similar by nature, there is not a single prescription on how to analyze the data. However, a general comparison may give us ideas around the system state change.

create or replace function compare_baseline_to_current_by_wait_event (baseline_interval_start int,baseline_interval_type text,current_interval_start int,current_interval_type text)
returns table(
wait_event text,
baseline_count bigint,
current_count bigint,
current_to_baseline_factor double precision,
percent_change numeric
)
as $$
with data_set as
( select event_type || ':' || event as wait_event
, sum( case when start_time >= current_timestamp – ($1 || $2)::interval and start_time < current_timestamp – ($3 || $4)::interval then 1 else 0 end ) as baseline_count
, sum( case when start_time >= current_timestamp – ($3 || $4)::interval then 1 else 0 end ) as current_count
, extract(epoch from ( $1 || $2 ) ::interval) / extract(epoch from ( $3 || $4 ) ::interval) as current_to_baseline_factor
from query_store.pgms_wait_sampling_view where query_id != 0
group by event_type || ':' || event
) ,
wait_event_data as
( select *
, round(( case when baseline_count = 0 then 0 else (100*((current_to_baseline_factor*current_count) – baseline_count) / baseline_count) end )::numeric,2) as percent_change
from data_set
)
select * from wait_event_data order by percent_change desc;
$$
language 'sql';

select * from compare_baseline_to_current_by_wait_event (7, 'days', 2, 'hours');

The above query will let you see some abnormal changes between the two periods. Note that event count here is taken as an approximation and the numbers should be taken within the context of the comparative load of the instance given the time.

As you can see, with the available time series data in Query Store, your creativity is your limit to the kinds of analysis and algorithms you could implement here. We showed you some simple calculations by which you could apply straight forward techniques to identify candidates and improve. We hope that this could be your starting point and that you share with us what works, what doesn’t and how you take this to the next level.

We are always looking forward to hearing feedback from you!

Acknowledgments

Special thanks to Senior Data Scientist Korhan Ileri, and Principal Data Scientist Managers Intaik Park and Saikat Sen for their contributions to this blog post.
Quelle: Azure

Purism: Librem 5 kann telefonieren

Zusätzlich zur Hardware arbeitet das Purism-Team an eigener Software für das freie Linux-Smartphone Librem 5. Unter anderem funktioniert nun das Telefonieren und die Bibliothek Libhandy macht GTK3-Anwendungen mobilfähig. (librem5, Smartphone)
Quelle: Golem

Process modeling is the first step to Lean Six Sigma success

Lean Six Sigma is a combination of two process improvement methods: Lean and Six Sigma. It’s designed to reduce organizational costs by removing waste, or “muda”, from a process through continual business processes improvement. By removing waste and reducing process variation, organizations can improve overall production quality and efficiency.
Why use a process model?
Organizations often implement Lean Six Sigma to improve business processes, run more efficiently and reduce costs. Getting a handle on processes can bring order to the chaos.

The Lean Six Sigma method calls upon organizations to define, measure, analyze, improve and control (DMAIC), laying the foundation for a successful Lean Six Sigma process improvement project.
The first step, “define”, involves thoroughly understanding processes. To do that, an organization should model processes exactly how they exist today. This is not a future state or wish list exercise. Documenting the current state helps all team members work together to define a common understanding of the process from start to finish. Once the current process is captured, the organization can effectively improve it by following the other DMAIC steps.
Process modeling helps by:

Bringing team members together to understand a full and true view of the process
Creating a process picture with associated data, allowing for Lean Six Sigma analysis
Increasing the ability to understand the process, which helps identify pain points and improvement changes

Benefits of dedicated process modeling
Basic diagramming tools help define an initial business process and provide a good path to getting processes off of sticky notes and into a digital format. However, if company-wide collaboration and real-time change management are important, a dedicated process modeling tool may be the better choice.
Basic diagramming tools lack many of the capabilities that lead to the next level of true process improvement. Simple diagramming tools often don’t include the ability to add data to activities such as role; time; cost; and information about suppliers, inputs, process, outputs and customers (SIPOC), which is what turns a static process map into a dynamic, data-rich process model that allows for continuous improvement. By moving to a dedicated process modeling software such as IBM Blueworks Live, organizations can input data to turn process maps into process models while implementing version control, keeping teams in sync and standardizing an effective process modeling solution across the organization.
View the comparison guide to see when you’d benefit from a dedicated process mapping tool such as Blueworks Live over a simple drawing tool.
Visit the Blueworks Live website to learn more and download the free 30-day trial.
The post Process modeling is the first step to Lean Six Sigma success appeared first on Cloud computing news.
Quelle: Thoughts on Cloud