Preview: SQL Transparent Data Encryption (TDE) with Bring Your Own Key support

We’re glad to announce the preview of Transparent Data Encryption (TDE) with Bring Your Own Key (BYOK) support for Azure SQL Database and Azure SQL Data Warehouse! Now you can have control of the keys used for encryption at rest with TDE by storing these master keys in Azure Key Vault.

TDE with BYOK support gives you increased transparency and control over the TDE Protector, increased security with an HSM-backed external service, and promotion of separation of duties.

When you use TDE, your data is encrypted at rest with a symmetric key (called the database encryption key) stored in the database or data warehouse distribution. To protect this data encryption key (DEK) in the past, you could only use a certificate that the Azure SQL Service managed. Now, with BYOK support for TDE, you can protect the DEK with an asymmetric key that is stored in Key Vault. Key Vault is a highly available and scalable cloud-based key store which offers central key management, leverages FIPS 140-2 Level 2 validated hardware security modules (HSMs), and allows separation of management of keys and data, for additional security.

All the features of Azure SQL Database and SQL Data Warehouse will work with TDE with BYOK support, and you can start enabling TDE with a key from Key Vault today using Azure Portal, PowerShell, and REST API.

In the Azure Portal, we’ve kept the experience simple. Let’s go over three common scenarios.

Enabling TDE

We’ve kept the same simple experience for enabling TDE on the database or data warehouse.

Setting a TDE Protector

On the server, you can now choose to use your own key as the TDE Protector for the databases and data warehouses on your server. Browse through your key vaults to select an existing key or create a new key in Key Vault.


Rotating Your Keys

You can rotate your TDE Protector through Key Vault, by adding a new version to the current key. You can also switch the TDE Protector to another key in Key Vault or back to a service-managed certificate at any time. The Azure SQL service will pick up these changes automatically. Rotating the TDE Protector is a fast online process: instead of re-encrypting all data, the rotation re-encrypts the DEK on each database and data warehouse distribution using the TDE Protector.

Integrating BYOK support for SQL TDE allows you to leverage the benefits of TDE as an encryption feature and Key Vault as an external key management service.

You can get started by visiting the Azure Portal or the how-to guide using PowerShell today. To learn more about the feature including best practices, watch our Channel 9 video or visit Transparent Data Encryption with Bring Your Own Key support.

Tell us what you think about TDE with BYOK by visiting the SQL Database and SQL Data Warehouse forums.
Quelle: Azure

Default compatibility level 140 for Azure SQL databases

As of today, the default compatibility level for new databases created in Azure SQL Database is 130. Very soon, we’ll be changing the Azure SQL Database default compatibility level for newly created databases to 140.

The alignment of SQL versions to default compatibility levels are as follows:

100: in SQL Server 2008 and Azure SQL Database
110: in SQL Server 2012 and Azure SQL Database
120: in SQL Server 2014 and Azure SQL Database
130: in SQL Server 2016 and Azure SQL Database
140: in SQL Server 2017 and Azure SQL Database

For details on what compatibility level 140 specifically enables, please see the blog post Public Preview of Compatibility Level 140 for Azure SQL Database. 

Once this new database compatibility default goes into effect, if you wish to still use database compatibility level 130, or lower, please follow the instructions detailed to view or change the compatibility level of a database. For example, you may wish to ensure that new databases created in Azure SQL Database use the same compatibility level as other databases in Azure SQL Database. This is to ensure consistent query optimization behavior across development, QA, and production versions of your databases.

We recommend that database configuration scripts explicitly designate COMPATIBILITY_LEVEL rather than rely on the defaults, in order to ensure consistent application behavior.

For new databases supporting new applications, we recommend using the latest compatibility level, 140. For pre-existing databases running at lower compatibility levels, the recommended workflow for upgrading the query processor to a higher compatibility level is detailed in the article Change the Database Compatibility Mode and Use the Query Store. Note that this article refers to compatibility level 130 and SQL Server, but the same methodology applies for moves to 140 for SQL Server and Azure SQL DB.

To determine the current compatibility level of your database, execute the following Transact-SQL statement:

SELECT compatibility_level
FROM [sys].[databases]
WHERE [name] = 'Your Database Name';

For newly created databases, if you wish to use database compatibility level 130, or lower, instead of the new 140 default, execute ALTER DATABASE. For example:

ALTER DATABASE database_name
SET COMPATIBILITY_LEVEL = 130;

Databases created prior to the new compatibility level default change will not be affected and will maintain their current compatibility level. Also note that Azure SQL Database Point in Time Restore will preserve the compatibility level that was in effect when the full backup was performed. 
Quelle: Azure

ASP.NET Core developers, meet Stackdriver diagnostics

By Ian Talarico, Software Engineer

Being able to diagnose application logs, errors and latency is key to understanding failures, but it can be tricky and time-consuming to implement correctly. That’s why we’re happy to announce general availability of Stackdriver Diagnostics integration for ASP.NET Core applications, providing libraries to easily integrate Stackdriver Logging, Error Reporting and Trace into your ASP.NET Core applications, with a minimum of effort and code. While on the road to GA, we’ve fixed bugs, listened to and applied customer feedback, and have done extensive testing to make sure it’s ready for your production workloads.

The Google.Cloud.Diagnostics.AspNetCore package is available on NuGet. ASP.NET Classic is also supported with the Google.Cloud.Diagnostics.AspNet package.

Now, let’s look at the various Google Cloud Platform (GCP) components that we integrated into this release, and how to begin using them to troubleshoot your ASP.NET Core application.

Stackdriver Logging 
Stackdriver Logging allows you to store, search, analyze, monitor and alert on log data and events from GCP and AWS. Logging to Stackdriver is simple with Google.Cloud.Diagnostics.AspNetCore. The package uses ASP.NET Core’s built in logging API; simply add the Stackdriver provider and then create and use a logger as you normally would. Your logs will then show up in the Stackdriver Logging section of the Google Cloud Console.

Initializing and sending logs to Stackdriver Logging only requires a few lines of code:

public void Configure(IApplicationBuilder app, ILoggerFactory loggerFactory)
{
// Initialize Stackdriver Logging
loggerFactory.AddGoogle(“YOUR-GOOGLE-PROJECT-ID”);

}

public void LogMessage(ILoggerFactory loggerFactory)
{
// Send a log to Stackdriver Logging
var logger = loggerFactory.CreateLogger(“NetworkLog”);
logger.LogInformation(“This is a log message.”);
}
Here’s view of Stackdriver logs shown in Cloud Console:

This shows two different logs that were reported to Stackdriver. An expanded log shows its severity, timestamp, payload and many other useful pieces of information.

Stackdriver Error Reporting 
Adding the Stackdriver Error Reporting middleware to the beginning of your middleware flow reports all uncaught exceptions to Stackdriver Error Reporting. Exceptions are grouped and shown in the Stackdriver Error Reporting section of Cloud Console.

Here’s how to initialize Stackdriver Error Reporting in your ASP.NET Core application:

public void ConfigureServices(IServiceCollection services)
{
services.AddGoogleExceptionLogging(options =>
{
options.ProjectId = “YOUR-GOOGLE-PROJECT-ID”;
options.ServiceName = “ImageGenerator”;
options.Version = “1.0.2”;
});

}

public void Configure(IApplicationBuilder app)
{
// Use before handling any requests to ensure all unhandled exceptions are reported.
app.UseGoogleExceptionLogging();

}

You can also report caught and handled exceptions with the IExceptionLogger interface:

public void ReadFile(IExceptionLogger exceptionLogger)
{
try
{
string scores = File.ReadAllText(@”C:Scores.txt”);
Console.WriteLine(scores);
}
catch (IOException e)
{
exceptionLogger.Log(e);
}
}
Here’s a view of Stackdriver Error Reports in Cloud Console:

This shows the occurrence of an error over time for a specific application and version. The exact error is shown on the bottom.

Stackdriver Trace 
Stackdriver Trace captures latency information on all of your applications. For example, you can diagnose if HTTP requests are taking too long by using a Stackdriver Trace integration point. Similar to Error Reporting, Trace hooks into your middleware flow and should be added at the beginning of your middleware flow.

Initializing Stackdriver Trace is similar to setting up Stackdriver Error Reporting:

public void ConfigureServices(IServiceCollection services)
{
string projectId = “YOUR-GOOGLE-PROJECT-ID”;
services.AddGoogleTrace(options =>
{
options.ProjectId = projectId;
});

}

public void Configure(IApplicationBuilder app)
{
// Use at the start of the request pipeline to ensure the entire request is traced.
app.UseGoogleTrace();

}
You can also manually trace a section of code that will be associated with the current request:

public void TraceHelloWorld(IManagedTracer tracer)
{
using (tracer.StartSpan(nameof(TraceHelloWorld)))
{
Console.Out.WriteLine(“Hello, World!”);
}
}
Here’s a view of a trace across multiple servers in Cloud Console:

This shows the time spent for portions of an HTTP request. The timeline shows both time spent on the front-end and on the back-end.

Not using ASP.NET Core? 

If you are haven’t made the switch to ASP.NET Core but still want to use Stackdriver diagnostics tools, we also provide a package for ASP.NET accordingly named Google.Cloud.Diagnostics.AspNet. It provides simple Stackdriver diagnostics integration into ASP.NET applications. You can add Error Reporting and Tracing for MVC and Web API with a line of code to your ASP.NET application. And while ASP.NET does not have a logging API, we have also integrated Stackdriver Logging with log4net in our Google.Cloud.Logging.Log4Net package. 

Our goal is to make GCP a great place to build and run ASP.NET and ASP.NET Core applications, and troubleshooting performance and errors is a big part of that. Let us know what you think of this new functionality, and leave us your feedback on GitHub.
Quelle: Google Cloud Platform

Here's How To Find Out Who Left Your Facebook Requests Hanging

Many people don’t reject Facebook friend requests from semi-strangers, they just leave them hanging as “pending” for a long time.

Many people don't reject Facebook friend requests from semi-strangers, they just leave them hanging as "pending" for a long time.

MTV

I just discovered my very nice coworker here at BuzzFeed had 77 pending friend requests on Facebook. 77! What a monster!

When she gets a request from someone she doesn't know, or barely knows, instead of rejecting them she just leaves them hanging. In her opinion, this is kinder than rejecting them, somehow.

I disagree. I hate seeing all those pending requests, so I quickly reject anyone who I don't know at all (I'll accept acquaintances and put them on a limited privacy list).

I should point out that if you leave someone “pending”, they get subscribed to your updates. That means anything you post with the privacy level “Public”, they see in their feed. This also means they probably THINK you accepted them. Sneaky!

You can see who has left YOU hanging. Here's how.

If you're on the Facebook website, you can CLICK THIS LINK to go to the “outgoing requests” page. Or, go into your Friend Requests, then click “view sent requests”.

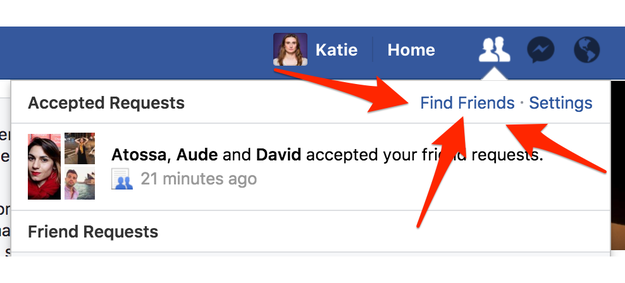
Click on “Find Friends”

Click on "Find Friends"

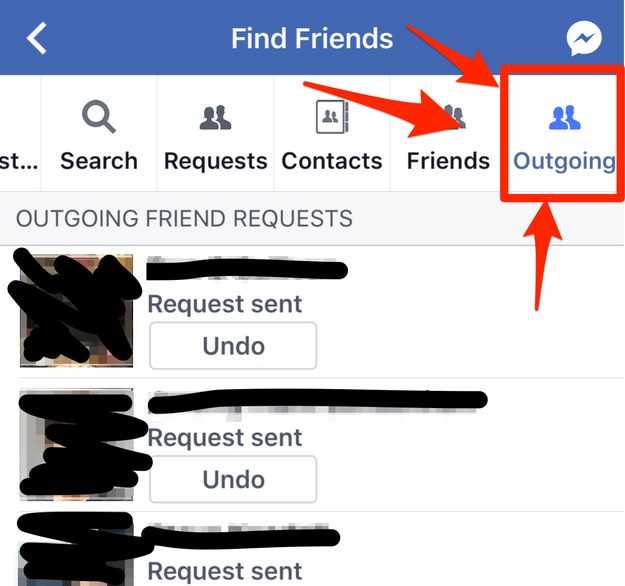
Then click on “View Sent Requests” – this is the list of people who have left you pending.

Then click on "View Sent Requests" – this is the list of people who have left you pending.

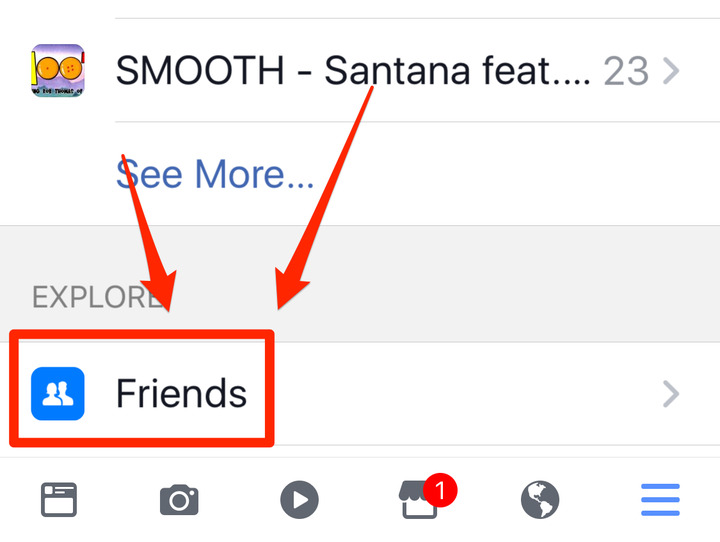
On the mobile Facebook app, go into the 3 lines at the bottom corner.

On the mobile Facebook app, go into the 3 lines at the bottom corner.

Then go into “Friends.”

Then go into "Friends."

Do this at your own risk – it might be an unexpected blow to your ego to see who hasn't accepted your request!

For example, BuzzFeed's head of U.S. News, just told me she checked her outgoing friend requests, and only one person has been keeping her in friend purgatory: BuzzFeed's CEO.

Quelle: <a href="Here's How To Find Out Who Left Your Facebook Requests Hanging“>BuzzFeed

Announcing Azure Data Lake Store Capture Provider for Event Hubs Capture

Event Hubs Capture went to generally availability in June 2017. To this feature, we are adding Azure Data Lake Store as a new Capture provider. Yes, you can now choose your Azure Data Lake Store to capture events from Event Hubs.

Event Hubs Capture addresses key scenarios of data-streaming such as long-term data retention and downstream micro-batch processing. Capture enabled on your event hub pulls the data directly from Event Hubs to your Azure Data Lake Store. Capture will manage all the compute and downstream processing required to do this. Create your Azure Data Lake Store and set up appropriate permissions for your event hub that has Capture enabled, and you will see how easy it is to stream data into Azure.

How can I enable this provider?

Azure Data Lake Store provider can be enabled in one of the following ways:

On Azure portal, by selecting Azure Data Lake store from the Capture Provider
Azure Resource Manager templates

Once Capture is enabled with Azure Data Lake Store as the provider, choose your time and size window, and you will see your events being captured in your chosen destination.

Event Hubs Capture provides the benefit of simple setup, reduced cost of ownership, no configuration overheads so you can focus on your apps while providing near-real time batch analytics.

Unleash the power of Azure Data Lake Store for your big data requirements at real-time or batch processing and visualization. With Event Hubs Capture streaming data, you can now optimize your data analysis and visualization.

Enjoy this new provider and refer to this article for more details on enabling your Azure Data Lake Store to capture events from your event hub.

Happy eventing!

Next Steps

Get started with Event Hubs Capture

Know more about Azure Data Lake Store
Quelle: Azure

Hortonworks extends IaaS offering on Azure with Cloudbreak

This blog post is co-authored by Peter Darvasi, Engineer, Hortonworks.

We are excited to announce the availability of Cloudbreak for Hortonworks Data Platform on Azure Marketplace. Hortonworks Data Platform (HDP) is an enterprise-ready, open source Apache Hadoop distribution. With Cloudbreak, you can easily provision, configure, and scale HDP clusters in Azure. Cloudbreak is designed for the following use cases:

Create clusters which you can fully control and customize to best fit your workload
Create on-demand clusters to run specific workloads, with data persisted in Azure Blob Storage or Azure Data Lake Store
Create, manage, and scale your clusters intuitively using Cloudbreak UI, or automate with Cloudbreak Shell or API
Automatically configure Kerberos and Apache Knox to secure your cluster

When you deploy Cloudbreak, it installs a “controller” VM which runs the Cloudbreak application. You can use the controller to launch and manage clusters. The following diagram illustrates the high-level architecture of Cloudbreak and HDP on Azure:

Cloudbreak lets you manage all your HDP clusters from a central location. You can configure your clusters with all the controls that Azure and HDP have to offer, and you can automate and repeat your deployments with:

Infrastructure templates for specifying compute, storage, and network resources in the cloud
Ambari blueprints for configuring Hadoop workload
Custom scripts that you can run before or after cluster creation

In addition, Cloudbreak on Azure features the following unique capabilities:

Easily install Cloudbreak by following a UI wizard on Azure Marketplace
Choose among Azure Blob Storage, Azure Data Lake Store, as well as Managed Disks attached to the cluster nodes to persist your data
Follow a simple Cloudbreak wizard to automate the creation of an Azure Active Directory Service Principal for Cloudbreak to manage your Azure resources
Enable high availability with Azure Availability Set
Deploy clusters in new or existing Azure VNet

Getting started

Go to Azure Marketplace and follow the wizard to install Cloudbreak. 
Once deployment is succeeded, retrieve the public DNS name for the Cloudbreak VM. 

Open https with the DNS name, and you will see a browser warning. This is because by default there is no certificate set for this https site. You can still continue to your Cloudbreak web UI and follow the wizard to provision clusters. We recommend that you set up a valid certificate and disable public IP in a production environment. 

Additional resources

For a step-by-step guide, visit Cloudbreak for Hortonworks Data Platform on Azure Marketplace documentation.
Get your questions answered at Hortonworks Community Connection.
To learn more about Cloudbreak and the Hortonworks Data Platform, visit www.hortonworks.com.

Quelle: Azure

Debug Spark Code Running in Azure HDInsight from Your Desktop

This month’s IntelliJ HDInsight Tools release delivers a robust remote debugging engine for Spark running in the Azure cloud. The Azure Toolkit for IntelliJ is available for users running Spark to perform interactive remote debugging directly against code running in HDInsight.

Debugging big data applications is a longstanding pain point. The data-intensive, distributed, scalable computing environment in which big data apps run is inherently difficult to troubleshoot, and this is no different for Spark developers. There is little tooling support for debugging such scenarios, leaving developers with manual, brute-force approaches that are cumbersome, and come with limitations. Common approaches include local debugging against sample data which poses limitations on data size; analysis of log files after the app has completed, requiring manual parsing of unwieldy log files; or use of a Spark shell for line by line execution, which does not support break points.

Azure Toolkit for IntelliJ addresses these challenges by allowing the debugger to attach to Spark processes on HDInsight for direct remote debugging. Developers connect to the HDInsight cluster at any time, leverage IntelliJ built-in debug capabilities, and automatically collect log files. The steps for this interactive remote debugging are the same ones developers are familiar with from debugging one-box apps. Developers do not need to know the configurations of the cluster, nor understand the location of the logs.

To learn more, watch this demo of HDInsight Spark Remote Debugging.

Customer key benefits

Use IntelliJ to run and debug Spark application remotely on an HDInsight cluster anytime via “Run->Edit Configurations”.
Use IntelliJ built-in debugging capabilities, such as conditional breakpoints, to quickly identify data-related errors. Developers can inspect variables, watch intermediate data, step through code, and finally edit the app and resume execution – all against Azure HDInsight clusters with production data.
Set a breakpoint for both driver and executor code. Debugging executor code lets developers detect data-related errors by viewing RDD intermediate values, tracking distributed task operations, and stepping through execution units.
Set a breakpoint in Spark external libraries allowing developers to step into Spark code and debug in the Spark framework.
View both driver and executor code execution logs in the console panel (see the “Driver Tab” and “Executor Tab”).

How to start debugging

The initial configuration to connect to your HDInsight Spark cluster for remote debugging is as simple as a few clicks in the advanced configuration dialog. You can set up a breakpoint on the driver code and executor code in order to step through the code and view the execution logs. To learn more, read the user guide Spark Remote Debug through SSH.

How to install or update

You can get the latest bits by going to IntelliJ repository, and search “Azure Toolkit.” IntelliJ will also prompt you for the latest update if you have already installed the plugin.

For more information, visit the following resources:

User Guide: Use HDInsight Tools in Azure Toolkit for IntelliJ to create Spark applications for HDInsight Spark Linux cluster
Documentation: Spark Remote Debug through SSH
Documentation: Spark Remote Debug through VPN
Spark Local Run: Use HDInsight Tools for IntelliJ with Hortonworks Sandbox
Create Scala Project (Video): Create Spark Scala Applications
Remote Debug (Video): Use Azure Toolkit for IntelliJ to debug Spark applications remotely on HDInsight Cluster

Learn more about today’s announcements on the Azure blog and Big Data blog. Discover more Azure service updates.   

If you have questions, feedback, comments, or bug reports, please use the comments below or send a note to hdivstool@microsoft.com.
Quelle: Azure

Facebook Cracks Down On Fake News With New Ad Rules

Justin Sullivan / Getty Images

Facebook is ramping up its fight against fake news.

The company, which was plagued by a wave of fake news in the run up to the 2016 election, is taking another step to prevent these stories from spreading. Today, it announced it will prevent pages that repeatedly share fabricated news stories from running ads on its platform, effectively ending an economic incentive to spread misinformation.

Since Facebook is a prime channel for fake news purveyors use to share false information, the move could deal a blow to their businesses.

“This update will help to reduce the distribution of false news which will keep Pages that spread false news from making money,” Facebook product managers Satwik Shukla and Tessa Lyons explained in a blog post announcing the move. “If a Page repeatedly shares stories that have been marked as false by third-party fact-checkers, they will no longer be able to buy ads on Facebook. If Pages stop sharing false news, they may be eligible to start running ads again.”

Facebook has come a long way since CEO Mark Zuckerberg dismissed the idea that fake news influenced the 2016 election was “pretty crazy.” Outside of these ad restrictions, the company also partnered with third party fact checkers to monitor content on its platform, and will indicate when these fact checkers believe a story is intentionally misleading.

Quelle: <a href="Facebook Cracks Down On Fake News With New Ad Rules“>BuzzFeed