The Internet's Domain Naming System Is Now A 2016 Campaign Issue, Somehow

Mike Stone / Reuters

Donald Trump and Sen. Ted Cruz see eye to eye on at least one issue: blocking the long-planned transfer of the internet&;s technical management to an international body.

“Donald Trump is committed to preserving Internet freedom for the American people and citizens all over the world,” Stephen Miller, the national policy director for the Trump campaign, said in a statement released Wednesday. “The U.S. should not turn control of the Internet over to the United Nations and the international community.”

Since 1998, an international nonprofit called the Internet Corporation for Assigned Names and Numbers (ICANN) has been responsible for overseeing the web&039;s global domain naming system — which allows us to connect to unique Web addresses from anywhere in the world.

Oversight of the naming system officially resides with the US Department of Commerce. But for almost two decades the agency has contracted out the responsibility to ICANN. To remove the US government as a middleman, and to advance a vision of the internet as a truly global, open network, ICANN is scheduled to take on the management responsibilities of the naming system on Oct. 1.

Cruz, however, has been mounting a campaign to block the transfer and has been gathering support on the Hill from key Republicans. They fear that ceding authority to an international, multi-stakeholder organization will empower authoritarian governments to censor what people see online. Trump&039;s endorsement of the position elevates the ICANN transfer to the 2016 campaign stage.

“Internet freedom is now at risk with the President’s intent to cede control to international interests, including countries like China and Russia, which have a long track record of trying to impose online censorship,” Miller said.

Awkwardly, Cruz has thus far not endorsed Trump for president though his spokeswoman said the senator is “glad to have” Trump&039;s support on this particular issue.

In a recent congressional hearing on the ICANN transition, ICANN&039;s president and a top official in the Commerce Department insisted that fears of a Russian-Chinese takeover of the internet are unfounded. While authoritarian governments do deploy a variety of methods to filter, block, and surveil internet traffic, the domain name system that ICANN manages operates at a different level than those forms of censorship.

Experts say that blocking the transfer would actually embolden Russia and other foreign powers who would rather see internet stewardship reside with state governments, as opposed to the global, non-governmental make-up of ICANN.

But Cruz, and now Trump, remain unconvinced. Along with dozens of congressional Republicans, Cruz is working to delay the transfer of ICANN&039;s oversight. The disagreement over ICANN has also become entangled with protracted budget negotiations that must be resolved by Sept. 30, in order for the government to remain open.

“Congress needs to act, or Internet freedom will be lost for good, since there will be no way to make it great again,” Miller said. ICANN declined to comment for this story. The Clinton campaign did not immediately respond to a request for comment.

Quelle: <a href="The Internet&039;s Domain Naming System Is Now A 2016 Campaign Issue, Somehow“>BuzzFeed

High performance network policies in Kubernetes clusters

Editor’s note: today’s post is by Juergen Brendel, Pritesh Kothari and Chris Marino co-founders of Pani Networks, the sponsor of the Romana project, the network policy software used for these benchmark tests.Network PoliciesSince the release of Kubernetes 1.3 back in July, users have been able to define and enforce network policies in their clusters. These policies are firewall rules that specify permissible types of traffic to, from and between pods. If requested, Kubernetes blocks all traffic that is not explicitly allowed. Policies are applied to groups of pods identified by common labels. Labels can then be used to mimic traditional segmented networks often used to isolate layers in a multi-tier application: You might identify your front-end and back-end pods by a specific “segment” label, for example. Policies control traffic between those segments and even traffic to or from external sources.Segmenting trafficWhat does this mean for the application developer? At last, Kubernetes has gained the necessary capabilities to provide “defence in depth”. Traffic can be segmented and different parts of your application can be secured independently. For example, you can very easily protect each of your services via specific network policies: All the pods identified by a Replication Controller behind a service are already identified by a specific label. Therefore, you can use this same label to apply a policy to those pods.Defense in depth has long been recommended as best practice. This kind of isolation between different parts or layers of an application is easily achieved on AWS and OpenStack by applying security groups to VMs. However, prior to network policies, this kind of isolation for containers was not possible. VXLAN overlays can provide simple network isolation, but application developers need more fine grained control over the traffic accessing pods. As you can see in this simple example, Kubernetes network policies can manage traffic based on source and origin, protocol and port.apiVersion: extensions/v1beta1kind: NetworkPolicymetadata: name: pol1spec: podSelector:   matchLabels:     role: backend ingress: – from:   – podSelector:      matchLabels:       role: frontend   ports:   – protocol: tcp     port: 80Not all network backends support policiesNetwork policies are an exciting feature, which the Kubernetes community has worked on for a long time. However, it requires a networking backend that is capable of applying the policies. By themselves, simple routed networks or the commonly used flannel network driver, for example, cannot apply network policy.There are only a few policy-capable networking backends available for Kubernetes today: Romana, Calico, and Canal; with Weave indicating support in the near future. Red Hat’s OpenShift includes network policy features as well.We chose Romana as the back-end for these tests because it configures pods to use natively routable IP addresses in a full L3 configuration. Network policies, therefore, can be applied directly by the host in the Linux kernel using iptables rules. This results is a high performance, easy to manage network. Testing performance impact of network policiesAfter network policies have been applied, network packets need to be checked against those policies to verify that this type of traffic is permissible. But what is the performance penalty for applying a network policy to every packet? Can we use all the great policy features without impacting application performance? We decided to find out by running some tests.Before we dive deeper into these tests, it is worth mentioning that ‘performance’ is a tricky thing to measure, network performance especially so. Throughput (i.e. data transfer speed measured in Gpbs) and latency (time to complete a request) are common measures of network performance. The performance impact of running an overlay network on throughput and latency has been examined previously here and here. What we learned from these tests is that Kubernetes networks are generally pretty fast, and servers have no trouble saturating a 1G link, with or without an overlay. It’s only when you have 10G networks that you need to start thinking about the overhead of encapsulation. This is because during a typical network performance benchmark, there’s no application logic for the host CPU to perform, leaving it available for whatever network processing is required. For this reason we ran our tests in an operating range that did not saturate the link, or the CPU. This has the effect of isolating the impact of processing network policy rules on the host. For these tests we decided to measure latency as measured by the average time required to complete an HTTP request across a range of response sizes. Test setupHardware: Two servers with Intel Core i5-5250U CPUs (2 core, 2 threads per core) running at 1.60GHz, 16GB RAM and 512GB SSD. NIC: Intel Ethernet Connection I218-V (rev 03)Ubuntu 14.04.5Kubernetes 1.3 for data collection (verified samples on v1.4.0-beta.5)Romana v0.9.3.1Client and server load test softwareFor the tests we had a client pod send 2,000 HTTP requests to a server pod. HTTP requests were sent by the client pod at a rate that ensured that neither the server nor network ever saturated. We also made sure each request started a new TCP session by disabling persistent connections (i.e. HTTP keep-alive). We ran each test with different response sizes and measured the average request duration time (how long does it take to complete a request of that size). Finally, we repeated each set of measurements with different policy configurations. Romana detects Kubernetes network policies when they’re created, translates them to Romana’s own policy format, and then applies them on all hosts. Currently, Kubernetes network policies only apply to ingress traffic. This means that outgoing traffic is not affected.First, we conducted the test without any policies to establish a baseline. We then ran the test again, increasing numbers of policies for the test’s network segment. The policies were of the common “allow traffic for a given protocol and port” format. To ensure packets had to traverse all the policies, we created a number of policies that did not match the packet, and finally a policy that would result in acceptance of the packet.The table below shows the results, measured in milliseconds for different request sizes and numbers of policies:Response SizePolicies.5k1k10k100k1M00.7320.7381.0772.53210.487100.7440.7421.0842.57010.556500.7450.7551.0862.58010.5661000.7620.7701.1042.64010.5972000.7830.7831.1472.65210.677What we see here is that, as the number of policies increases, processing network policies introduces a very small delay, never more than 0.2ms, even after applying 200 policies. For all practical purposes, no meaningful delay is introduced when network policy is applied. Also worth noting is that doubling the response size from 0.5k to 1.0k had virtually no effect. This is because for very small responses, the fixed overhead of creating a new connection dominates the overall response time (i.e. the same number of packets are transferred).Note: .5k and 1k lines overlap at ~.8ms in the chart aboveEven as a percentage of baseline performance, the impact is still very small. The table below shows that for the smallest response sizes, the worst case delay remains at 7%, or less, up to 200 policies. For the larger response sizes the delay drops to about 1%. Response SizePolicies.5k1k10k100k1M00.0%0.0%0.0%0.0%0.0%10-1.6%-0.5%-0.6%-1.5%-0.7%50-1.8%-2.3%-0.8%-1.9%-0.8%100-4.1%-4.3%-2.5%-4.3%-1.0%200-7.0%-6.1%-6.5%-4.7%-1.8%What is also interesting in these results is that as the number of policies increases, we notice that larger requests experience a smaller relative (i.e. percentage) performance degradation.This is because when Romana installs iptables rules, it ensures that packets belonging to established connection are evaluated first. The full list of policies only needs to be traversed for the first packets of a connection. After that, the connection is considered ‘established’ and the connection’s state is stored in a fast lookup table. For larger requests, therefore, most packets of the connection are processed with a quick lookup in the ‘established’ table, rather than a full traversal of all rules. This iptables optimization results in performance that is largely independent of the number of network policies. Such ‘flow tables’ are common optimizations in network equipment and it seems that iptables uses the same technique quite effectively. Its also worth noting that in practise, a reasonably complex application may configure a few dozen rules per segment. It is also true that common network optimization techniques like Websockets and persistent connections will improve the performance of network policies even further (especially for small request sizes), since connections are held open longer and therefore can benefit from the established connection optimization.These tests were performed using Romana as the backend policy provider and other network policy implementations may yield different results. However, what these tests show is that for almost every application deployment scenario, network policies can be applied using Romana as a network back end without any negative impact on performance.If you wish to try it for yourself, we invite you to check out Romana. In our GitHub repo you can find an easy to use installer, which works with AWS, Vagrant VMs or any other servers. You can use it to quickly get you started with a Romana powered Kubernetes or OpenStack cluster.
Quelle: kubernetes

Docker Presents at Inaugural Cloud Field Day

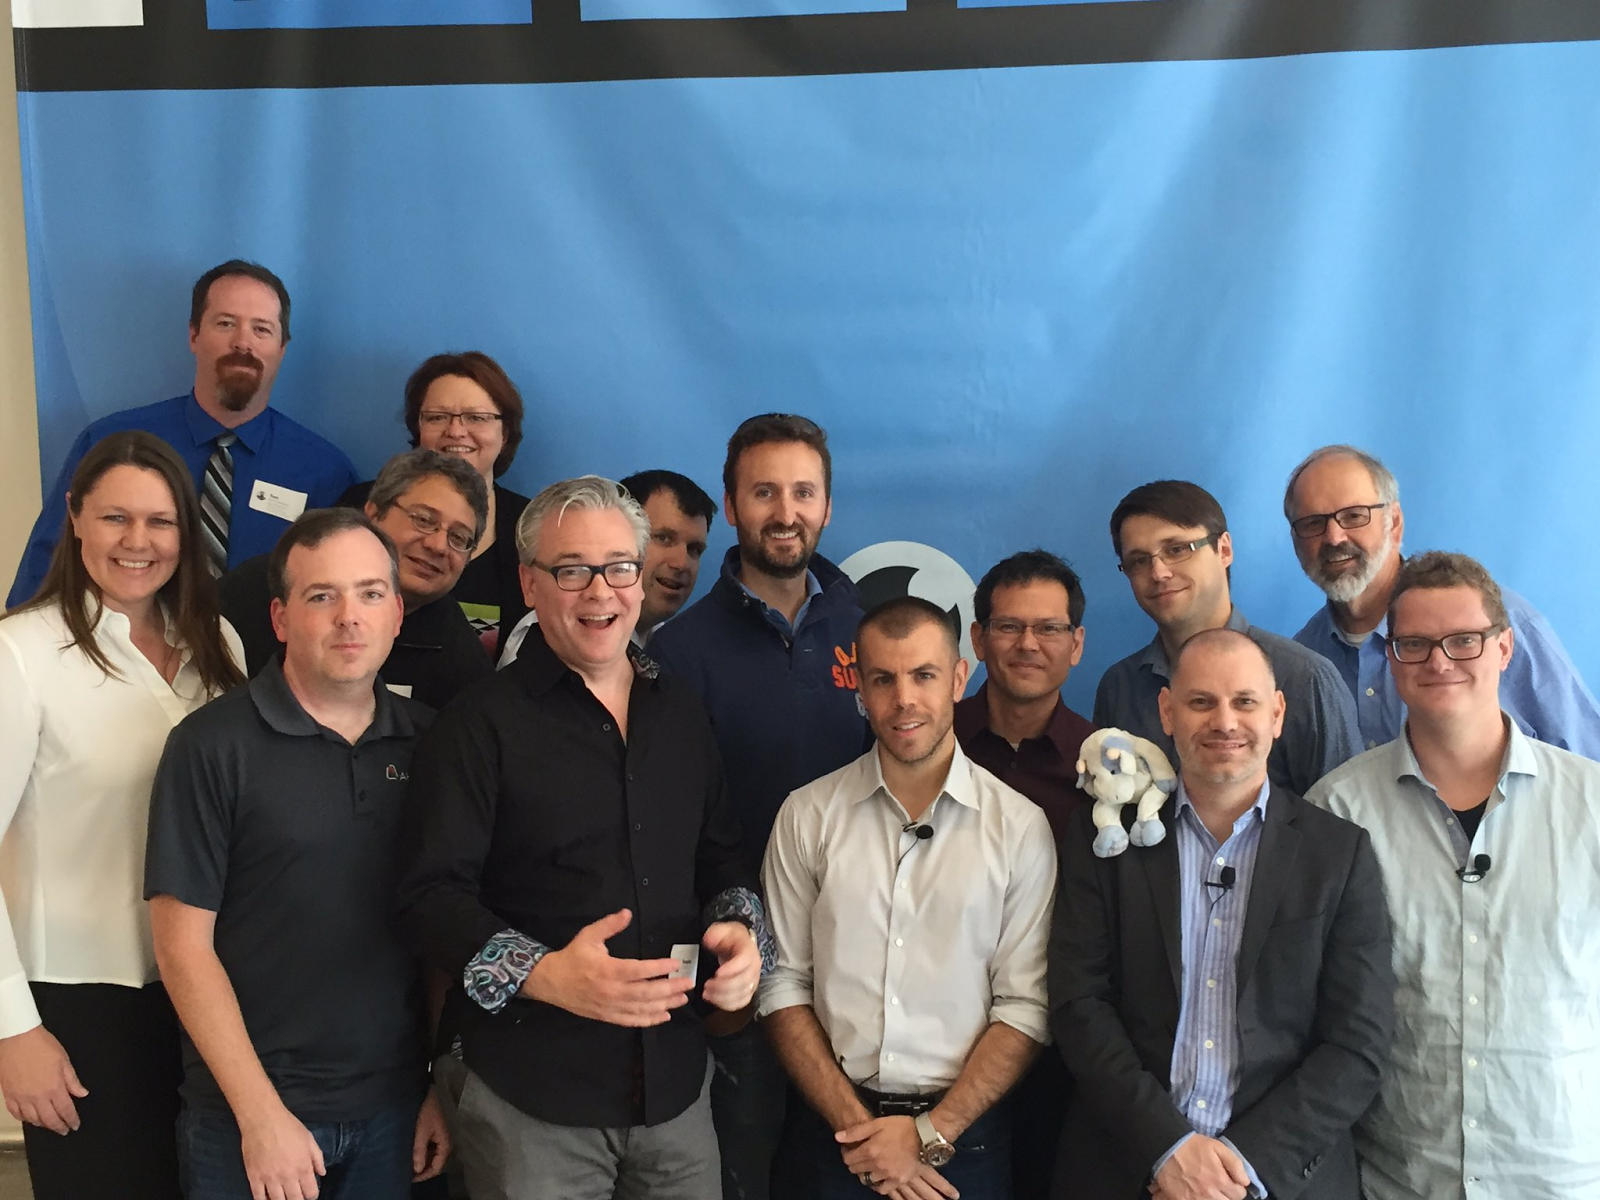
Thanks to everyone who joined us last Thursday. We were really excited to participate in the first Cloud Field Day event and to host at Docker HQ in San Francisco. In watching the trend to cloud and the changing dynamics of application development, the Tech Field Day organizers, Stephen Foskett and Tom Hollingsworth started Cloud Field Day to create a forum for companies to share and for the delegates to discuss. The delegates came from backgrounds in software development, , networking, virtualization, storage, data and of course, cloud… As always, the delegates asked a lot of questions, kicked off some great discussions, even had some spirited debates both in the room and online, always with the end user in mind. We are looking forward to doing this again.

ICYMI: The videos and event details are now available online and also follow the conversation from Twitter with the delegates.

containers are really about applications, not infrastructure @docker https://t.co/BAabGfwKIm pic.twitter.com/S8YrLDLd92
— Karen Lopez (@datachick) September 15, 2016


It’s staggering how far apart many traditional IT departments are from where the leading edge currently is… CFD1
— Jason Nash (@TheJasonNash) September 15, 2016


There is NO way to run @docker swarm mode insecurely! TLS built in! Gotta like that&; CFD1
— Nigel Poulton (@nigelpoulton) September 15, 2016

The three livestreamed sessions have been recorded and are now available to view.
Session 1: What is Docker?  Featuring product manager Vivek Saraswat
In this session, Vivek explains container architecture, how it is different than VMs and how they can be applied to application environments.  Bonus demo featuring an app with rotating cat gifs.

Session 2: Docker Orchestration featuring architect Andrea Luzzardi
With Docker 1.12, orchestration is built in directly into the Engine.  As an optional feature, orchestration includes node clustering, container scheduling, notion of application level services, container aware networking, security and much more.

Session 3: Docker and Microsoft featuring product manager Michael Friis
Enterprises have a mix of Linux and Windows application workloads. In this session, Michael explains how Docker and Windows Server deliver Windows containers and other integrations to the native Microsoft developer and IT pro toolset.

And we are not finished yet! The Docker Team will be participating in the upcoming Tech Field Day 12 in Silicon Valley on November 15-16th. Check back on the Tech Field Day site to get updated times and a link to view the live stream.
See you online soon!
More resources:

Learn more about Docker for the Enterprise
Read the white paper: Docker for the Virtualization Admin
Docker 1.12 with built in orchestration
Learn more about Docker Datacenter

The post Docker Presents at Inaugural Cloud Field Day appeared first on Docker Blog.
Quelle: https://blog.docker.com/feed/

Mark Zuckerberg And Priscilla Chan To Give $3 Billion To Science

Pricilla Chan and her husband Mark Zuckerberg announce the Chan Zuckerberg Initiative at a news conference in San Francisco, California on September 21, 2016.

Beck Diefenbach / Reuters

When Mark Zuckerberg and Priscilla Chan welcomed their daughter, Max, into the world in December 2015, it was a birth announcement with a bang: They unveiled the Chan Zuckerberg Initiative, a limited liability company intended to “advance human potential and promote equality.” They funded it with 99 percent of their Facebook shares, then valued at about $45 billion.

On Wednesday, the pair announced the Initiative&;s biggest investment to date: at least $3 billion over the next decade to an all-star team of doctors and academics who will search for breakthroughs and develop tools to tackle the most common diseases — heart disease, cancer, infectious disease, and neurological disease. The goal? “Cure, prevent, or manage all diseases by the end of the century.” (No big deal.)

“That doesn&039;t mean that no one will ever get sick,” Chan said during an event at UC San Francisco, the university where she trained to become the pediatrician she is today after meeting Zuckerberg at Harvard University. “But it does mean our children and their children could get sick a lot less. And when they do, we should be able to detect and treat it or at least manage it as an ongoing physician.”

At times tearing up, Chan cited her difficult experiences as a doctor — “from making a devastating diagnosis of leukemia, to sharing with a family they were unable to resuscitate their child” — in showing her that “we are at the limit of what we understand about the human body and disease.” “We want to push back that boundary,” she said.

Curing, preventing, or managing “all diseases” in the foreseeable future is a lofty goal, to put it mildly, and the announcement was met with more than a little skepticism.

But the couple have assembled an impressive team to at least attempt this feat. Chan Zuckerberg Science is led by Cori Bergmann of Rockefeller University, whose work has investigated how neurons and genes affect behavior. And the first effort is a $600 million, 10-year “biohub” at UC San Francisco that will bring together researchers from that university, as well as nearby UC Berkeley and Stanford University. Leading it are two prominent Bay Area scientists: Stanford bioengineer and physicist Stephen Quake and UC San Francisco&039;s Joe DeRisi, who studies the underlying genetics of infectious diseases. Their initial focus, they said, will be on constructing a “cell atlas” — a characterization of all the cell types in the human body — and developing new ways to detect, respond to, treat, and prevent infectious disease.

Programmers will work alongside scientists on these kinds of problems, an interdisciplinary approach that fits Zuckerberg and Chan&039;s respective backgrounds. Zuckerberg described his own optimism for the future as rooted in an “engineering mindset.” “It&039;s this belief you can take any system, no matter how complex,” he said, “and make it much, much better than it is today, whether it&039;s code, hardware, biology, a company, an education system, a government — anything.”

This initiative isn&039;t the couple&039;s first contribution to health and medicine. Not far from the site of Wednesday&039;s event is San Francisco&039;s public hospital, which was recently renamed the Zuckerberg San Francisco General Hospital and Trauma Center after Chan and Zuckerberg donated $75 million toward its equipment and technology last year. Last year, Facebook said its engineers had developed personalized-learning software for a public school system. And Chan is opening a free school in East Palo Alto with a dual focus on health and education.

The couple&039;s philanthropy efforts have been controversial in the past; in 2010, they donated $100 million to Newark, N.J. public schools, an effort that critics described as poorly managed. Zuckerberg defended it.

On Wednesday, Zuckerberg and Chan stressed that they had done their homework over the last two years, “talking to scientists ranging from Nobel Prize laureates to graduate students,” as Chan put it. “We&039;ve learned a lot and we know we have a lot more to learn.”

At the end of the event, they got an endorsement from someone who&039;s been in their shoes: Bill Gates, whose foundation with his wife Melinda Gates has also backed projects tackling everything from public health to education. “This idea of curing and preventing all diseases by the end of the century,” Gates said, “that&039;s very bold, very ambitious, and I can&039;t think of a better partnership to take it on.”

Quelle: <a href="Mark Zuckerberg And Priscilla Chan To Give Billion To Science“>BuzzFeed

Amazon EMR now supports data encryption for Apache Spark, Tez, and Hadoop MapReduce

You can now easily enable encryption for data at-rest and in-transit for Apache Spark, Apache Tez, and Apache Hadoop MapReduce on Amazon EMR. For encryption at-rest, you can encrypt data stored in Amazon S3 with the EMR File System (EMRFS) and data stored on your Amazon EMR cluster in the local file system on each node and the Hadoop Distributed File System (HDFS). For encryption in-transit, Amazon EMR will enable the open-source encryption features for Apache Spark, Apache Tez, and Apache Hadoop MapReduce.
Quelle: aws.amazon.com

Digging in on Cloud SQL automatic storage increases

Posted by Greg Wilson, Head of Developer Advocacy

There’s a cool new setting in the storage dialog of Cloud SQL Second Generation: “Enable automatic storage increase.” When selected, it checks the available database storage every 30 seconds and adds more capacity as needed in 5GB to 25GB increments, depending on the size of the database. This means that instead of having to provision storage to accommodate future database growth, storage capacity grows as the database grows.

There are two key benefits to Cloud SQL automatic storage increases:

Having a database that grows as needed can reduce application downtime by reducing the risk of running out of database space. You can take the guesswork out of capacity sizing without incurring any downtime or performing database maintenance.
If you’re managing a growing database, automatic storage increases can save a considerable amount of money. That’s because allocated database storage grows as needed rather than you having to provision a lot of space upfront. In other words, you pay for only what you use plus a small margin.

According to the documentation, Cloud SQL determines how much capacity to add in the following way: “The size of the threshold and the amount of storage that is added to your instance depends on the amount of storage currently provisioned for your instance, up to a maximum size of 25 GB. The current storage capacity is divided by 25, and the result rounded down to the nearest integer. This result is added to 5 GB to produce both the threshold size and the amount of storage that is added in the event that the available storage falls below the threshold.”

Expressed as a JavaScript formula, that translates to the following (units=GB):

Math.min((Math.floor(currentCapacity/25) + 5),25)

Here’s what that looks like for a few database sizes:

Current capacity

Threshold

Amount auto-added

50GB

7GB

7GB

100GB

9GB

9GB

250GB

15GB

15GB

500GB

25GB

25GB

1000GB

25GB

25GB

5000GB

25GB

25GB

If you already have a database instance running on Cloud SQL Second generation, you can go ahead and turn this feature on now.

Quelle: Google Cloud Platform

Microsoft Research: How we operate Deep Neural Network with Log Analytics

Microsoft Research is at the forefront of solving and tackling cutting edge problems with technologies such as Machine Learning and Deep Neural Networks (DNN). These technologies employ next generation server infrastructure that span immense Windows and Linux cluster environments. Additionally, for DNNs, these application stacks don’t only involve traditional system resources (CPUs, Memory), but also graphic processing units (GPUs).

With a nontraditional infrastructure environment, the Microsoft Research Operations team needed a highly flexible, scalable, and Windows and Linux compatible service to troubleshoot and determine root causes across the full stack.

Enter Azure Log Analytics

Azure Log Analytics, a component of Microsoft Operations Management Suite, natively supports log search through billions of records, real time metric collection, and rich custom visualizations across numerous sources. These out of the box features paired with the flexibility of available data sources made Log Analytics a great option to produce visibility & insights by correlating across DNN clusters & components.

The following diagram illustrates how Log Analytics offers the flexibility for different hardware and software components to send real time data within a single Deep Neural Network cluster node.

1. Linux Server System Resource Monitoring

Deep Neural Networks traditionally run on Linux, and Log Analytics supports major Linux distributions as first class citizens. The OMS Agent for Linux was also recently made generally available, built on the open source log collector FluentD.  By leveraging the Linux agent, we were able to easily collect system metrics at 10 second interval and all of our Linux logs without any customization effort.

2. NVIDIA GPU Information

The Log Analytics platform is also extremely flexible, allowing users to send data via a recently released HTTP POST API. We were able to write a custom Python application to retrieve data from their NVIDIA GPUs and unlock the ability to alert based off of metrics such as GPU Temperature. Additionally, these metrics can be visualized with Custom Views to create rich performance graphs for the team to further monitor.

Whoa, I’d love to learn more

We wrote this post to showcase the flexibility Log Analytics offers customers in the type of data sources that can onboard. Additionally, check out the full walkthrough on the MSOMS blog that includes Python code examples if you are interested in replicating this type of insight.
Finally, if you are completely new to Log Analytics be sure to try our fully hydrated demo environment located here, or sign up for a free Microsoft Operations Management Suite subscription so you can test out all these capabilities with your own environment.
Quelle: Azure