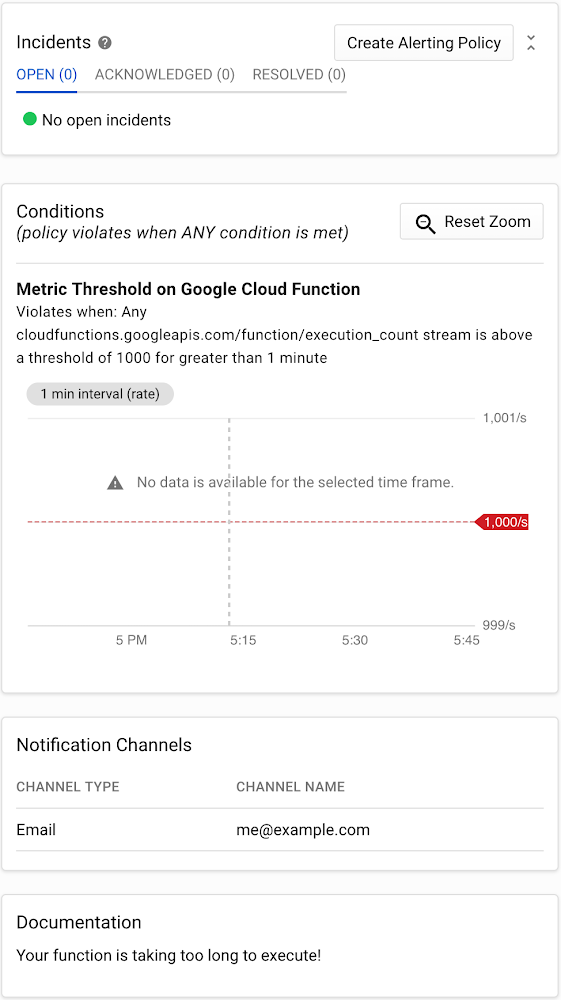
If you want to keep bugs from making it into production, it’s important to have a comprehensive testing plan that employs a variety of techniques. But no matter how complete your plan might be, tests are bound to miss bugs every now and then, which get pushed into production.In our previous post, Release with confidence: How testing and CI/CD can keep bugs out of production, we discussed ways to reduce bugs in a Cloud Functions production environment. In this post, we’ll show you how to find bugs that did slip through as quickly and painlessly as possible by answering two basic questions: if there is a problem in our code, and where in our codebase that problem occurred. To do this, you have to monitor your functions and keep an eye out for unusual values in key metrics. Of course, not all unusual values are due to errors—but the occasional false alarm is almost always better than not getting an alert when something goes wrong. Then, once you have monitoring in place and are receiving alerts, examining function and error logs will help you further isolate where the bugs are happening, and why. Stackdriver, Google Cloud’s provider-agnostic suite of monitoring, logging, and Application Performance Management (APM) tools, is a natural starting point for monitoring your Cloud Functions. Stackdriver Monitoring’s first-party integration with Cloud Functions makes it easy to set up a variety of metrics for Cloud Functions deployments.Stackdriver Monitoring is typically used along with a set of companion Stackdriver tools, including Logging, Error Reporting, and Trace. Stackdriver Logging and Error Reporting are natively integrated with Cloud Functions, and Stackdriver Trace is relatively simple to install.Monitoring: Is there a problem?Once you have a monitoring stack in place, it’s time to go bug hunting! When looking for bugs in production, the first thing you want to know is if there is a problem in your code. The best way to answer this question is to set up a monitoring and alerts policy with different types and levels of monitoring. Generally speaking, the more metrics you monitor, the better. Even if you don’t have time to implement a comprehensive level of monitoring from the start, some is always better than none. Also, you don’t have to set up your monitoring all at once—start with the basics and build from there. Basic monitoringThe first level of monitoring is to set up alerts for when severe log entries, such as errors, become too frequent. A good rule of thumb is to consider errors that are greater than a certain percentage of function invocations. Of course, this percentage will depend on your use case. For stable mission-critical applications, you might send an alert if 0.5%, 0.1%, or even 0.01% of your invocations fail. For less critical and/or unstable applications, alert thresholds of 1% – 5% can help reduce the likelihood of receiving too many false alarms.Intermediate monitoringNext, you should set up alerts for when certain metrics exceed normal limits. Ideally this should be built on top of error monitoring, since different monitoring techniques catch different potential issues. Two metrics that are particularly useful are execution time and invocation count. As their names suggest, execution time measures the amount of time it takes your function to execute, and invocation count is the number of times a function is called during a certain time period. Once you’ve set up the triggers you want to monitor, you need to calibrate your alerts. That may take some time depending on your application. Your goal should be to find a range that avoids getting too many or too few alerts. It can be tempting to set relatively low alert thresholds, on the theory that it’s better to receive more alerts than fewer. This is generally true, but at extreme levels, you may find yourself getting too many alerts, leading you to ignore potential emergencies. The reverse is also true: If your metrics are too lax, you may not get an alarm at all and miss a significant issue.Generally, for both metrics, it’s ideal to set alert thresholds of about two-to-four times greater than your normal maximums and .25-.5 times your normal minimums. Advanced monitoringA step up from monitoring execution time and invocation count is to monitor your functions’ memory use, using Stackdriver HTTP/S uptime checks (for HTTP/S-triggered functions), and monitoring other components of your overall application (such as any Cloud Pub/Sub topics that trigger functions). Again, finding the sweet spot of when to get alerts is critical.An example Stackdriver alerting policy that emails you when your functions take too long to complete.Logging and error reporting: Where’s the broken code?Once you’re alerted to the fact that something is wrong in your production environment, the next step is to determine where it’s broken. For this step, we can take advantage of Stackdriver Logging and Error Reporting.Stackdriver Logging stores and indexes your function logs. Error Reporting aggregates and analyzes these logs in order to generate meaningful reports. Both features are relatively easy to use, and together they provide critical information that helps you quickly determine where errors are occurring.In our example above, the log shows an error: “Uninitialized email address.” By looking at the report for this error, we can find several important pieces of information:The name of the Cloud Function involved (onNewMessage)How many times the error has occurredWhen the error started: It first occurred 13 days ago and was last seen six days ago.Data points like these make the process of pinpointing and fixing production errors much quicker, helping to reduce the impact of bugs in production.Bugs begoneTesting is rarely perfect. A solid monitoring system can provide an additional line of defense against bugs in production, and Stackdriver tools provide all the monitoring, logging, and error reporting you need for your Cloud Functions applications. Combined with the lessons from the first post of this series on testing and CI/CD, you can reduce the number of bugs that slip into your production environment, and minimize the damage caused by those that do find their way there.
Quelle: Google Cloud Platform
Published by